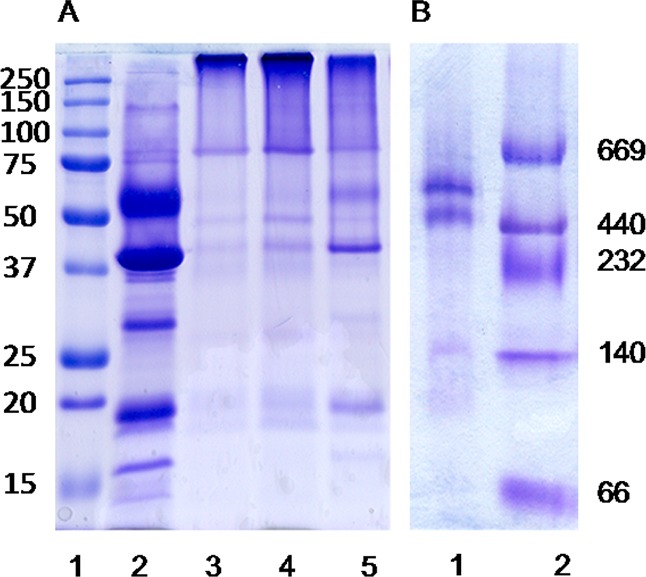
Figure 2.

(A) SDS–PAGE of the FMO/RCC complex: markers (lane 1), non-cross-linked control sample (lane 2), and FMO/RCC complex cross-linked by different concentrations of BS3 at room temperature [lanes 3–5 (10, 5, and 0.5 mM, respectively)]. (B) Blue-native gel of the FMO/RCC complex cross-linked by 10 mM BS3 (lane 1) and markers (lane 2).
