

Abstract
ATP-binding cassette (ABC) transporters translocate substrates across cell membranes, using energy harnessed from ATP binding and hydrolysis at their nucleotide binding domains (NBDs)1,2. ABC exporters are present in both prokaryotes and eukaryotes with examples implicated in multidrug resistance of pathogens and cancer cells, as well as in many human diseases3,4. TmrAB is a heterodimeric ABC exporter from the thermophilic Gram-negative eubacterium Thermus thermophilus homologous to various multidrug transporters and containing one degenerate site with a non-catalytic residue next to the Walker B motif5. Here we report a subnanometer resolution structure of detergent-solubilized TmrAB in a nucleotide-free, inward-facing conformation by single particle electron cryomicroscopy (cryo-EM). The reconstructions clearly resolved characteristic features of ABC transporters, including helices in the transmembrane domain (TMD) and NBDs. A cavity in the TMD is accessible laterally from the cytoplasmic side of the membrane as well as from the cytoplasm, indicating that the transporter lies in an inward-facing open conformation. The two NBDs remain in contact via their C-terminal helices. Furthermore, comparison between our structure and the crystal structures of other ABC transporters suggests a possible trajectory of conformational changes that involves a sliding and rotating motion between the two NBDs during the transition from the inward facing to outward facing conformations.
ABC transporters use ATP binding and hydrolysis to drive substrate translocation across a membrane. Many members of the ABC exporter family have varying selectivity and transport substrates from inside to outside of the cell, a property thought to allow them to facilitate export of xenobiotics such as drugs and toxins6,7. TmrAB has similar features to multidrug transporters, including transport of Hoechst 33342 dye and competitive inhibition by verapamil, which suggests a common mechanism for transport5. It is composed of two homologous subunits, TmrA and TmrB, arranged with pseudo 2-fold symmetry with a combined molecular weight of ∼135kDa. Each subunit has a 6-helix TMD and a cytoplasmic NBD. TmrAB has two ATP binding sites, each formed between both NBDs. However, only one site is an active ATPase consensus site capable of ATP hydrolysis. The degenerate (“inactive”) site has a non-canonical aspartate residue next to the Walker B motif contributed by one NBD and non-canonical residues from the ABC signature motif of the other NBD5.
Despite several crystal structures of ABC exporters representing various states along the transport cycle, there are competing models of how these states are functionally connected in a physiological setting8-10. Single particle cryo-EM holds the promise to offer structural information complimentary to x-ray crystallography, especially regarding conformational states that may be difficult to access within the confines of a crystal lattice. However, structure determination by single particle cryo-EM is favored by a relatively large molecular mass and higher symmetry. While recent technological breakthroughs enabled determination of the first atomic structures of homo-tetrameric ion channels of ∼300kDa11, determining a high-resolution structure of TmrAB still represents a major challenge, owing to its smaller size and pseudo-symmetric organization12.
Here, we used Fragment antigen binding (Fab) domains to overcome these challenges. A Fab that forms a stable complex with TmrAB has a number of advantages for structure determination by single particle cryo-EM13. Furthermore, conformational specific synthetic Fabs stabilize particles in a specific functional state14. Following our established procedure for Fab selection15, five Fabs were identified from a human naïve B cell Fab phage-displayed library using β-DDM (n-dodecyl-β-D-maltopyranoside)-solubilized TmrAB as the antigen. Fab binding was validated using a qualitative enzyme-linked immunosorbent assay (ELISA) screen15 (Fig. 1a and Extended Data Fig. 1a). The Fabs were further characterized by competitive ELISA analysis to establish whether these Fabs have overlapping or independent epitopes (see Online Methods and Fig. 1b). AD12, BA6, and AH11 (“class A”) were found to have overlapping epitopes, inhibiting the binding of one another, whereas AH5 (“class B”) and DH5 (“class C”) were found to have unique epitopes. Rigidity of the complexes was assessed by negative stain EM two-dimensional (2D) class averages. All TmrAB-Fab complexes yielded 2D class averages that show characteristic features of Fabs (Fig 1c and Extended Data Fig. 1d), suggesting that these Fabs form sufficiently rigid complexes with TmrAB. TmrAB complexes that clearly show two Fabs (Fig 1c) confirm that those Fabs bind to distinct sites. Furthermore, ELISA and negative stain EM demonstrated that AH5 and BA6 display the highest relative affinities (Extended Data Fig. 1b-d). Thus, these Fabs are preferred candidates for structure determination of TmrAB by cryo-EM. To gain more insight into the Fab-binding properties, AH5 and class A Fabs were used in an immunoblotting assay with denatured TmrAB. AH5, despite showing the highest affinity (Extended Data Fig. 1d), did not bind the denatured transporter, whereas all three class A Fabs, including BA6, bound to denatured TmrB (Fig 1d). These data suggested that AH5 recognizes a 3D epitope and that BA6 recognizes a linear epitope(s) within the TmrB sequence.
Figure 1. TmrAB Fab characterization.

a, Qualitative ELISA to assess Fab binding to TmrAB. All Fabs showed binding to TmrAB except BG12 in both experiments A and B where independently prepared Fab samples were used. Expression levels were assessed by immunoblotting and normalized (Extended Data Fig 1a). b, Representative competitive ELISA between AD12-myc and Fab-flag against TmrAB. AD12-myc binding was not affected by the presence of AH5-flag or DH5-flag (top left). AH5-flag and DH5-flag maintained near maximum binding (*) at all AD12-myc concentrations (top right). AD12-myc binding was almost abolished in the presence of AD12-flag or BA6-flag (middle left). AD12-flag and BA6-flag maintained near maximum binding (*) at all AD12-myc concentrations (middle right). AD12-myc binding was not significantly affected in the presence of AH11-flag (bottom left). AH11-flag binding decreased as AD12-myc concentrations increased shown (bottom right). Uninhibited binding of AD12-myc and Fab-flag suggests independent binding between AD12 and AH5 or DH5. Inhibited binding of either AD12-myc or Fab-flag suggests overlapping epitopes between AD12 and BA6 or AH11. c, Representative negative stain 2D class averages of TmrAB-Fab complexes. d, Immunoblotting of TmrAB, using Fab-flag. Class A Fabs recognized the denatured form of TmrB, and AH5 did not recognize the denatured form of either strand. BG12 was used as a non-binder control, which did not detect either strand significantly.
Detergent solubilized TmrAB-AH5 complex was purified (Extended Data Fig. 2a). Frozen-hydrated TmrAB-AH5 particles were imaged using a direct electron detection camera, K2 Summit, following newly implemented procedures16. 2D class averages of the TmrAB-AH5 complex show landmark features of both TmrAB and Fab (Extended Data Fig. 2b-e). We determined a 3D reconstruction of TmrAB-AH5 to a resolution of 8.2Å using gold standard Fourier Shell Correlation (FSC) = 0.143 criteria (Extended Data Fig. 2f-g)17. Local resolution estimation18 suggests most regions of the density map have a ∼6Å resolution (Extended Data Figure 2h-i). The density map is of sufficient quality to clearly resolve secondary structure features, including all helices in the TMDs and NBDs (Fig. 2 and Extended Data Fig.3). Such well-defined structural features suggest that TmrAB as visualized here adapts a defined conformation of an ABC exporter with well-ordered domain architecture. Furthermore, density corresponding to the detergent micelle defines a distorted ellipsoidal structure around the TMDs. The characteristic dumbbell-shaped Fab density is also clearly defined, validating the correctness of the 3D reconstruction.
Figure 2. 3D reconstruction of TmrAB-AH5 at subnanometer resolution.

a, Cryo-EM density map of the TmrAB-AH5 complex filtered to a resolution of 8.2Å. The atomic model of TmrAB and an atomic structure of a Fab (pdb code: 1M71) are docked into the density map. The map shows two NBDs, a bi-lobed DDM micelle, which is separated by TM4 (marked by two dashed lines in the top view), and well-defined AH5 density. In the bottom view, two parallel solid lines and dashed lines indicate orientations of the front and back halves of the micelle respectively. The two halves are tilted by ∼30° with each other. b, The density map at a higher isosurface threshold shows clearly resolved TM helices. c, A cross section view through the TMDs shows well resolved TM helices labeled red and blue for TmrA and TmrB respectively. d, NBDs of TmrAB in two different views. C-terminal helices (*) of the two NBDs are in close proximity depicted in both of the density map and the docked atomic model.
To confirm that the conformation of TmrAB is not influenced by AH5 binding, we determined two other 3D reconstructions -TmrAB alone and in complex with BA6. The 3D reconstruction of the TmrAB-BA6 complex was determined to a resolution of 9.4 Å (Extended Data Fig. 4) using a phosphor scintillator-based CMOS camera. At this resolution, the majority of the TmrAB helices are resolved, and the BA6 Fab density has the expected shape. The3D reconstruction of TmrAB alone was determined using the same CMOS camera to 10Å resolution (Extended Data Fig. 5). The densities of TmrAB in all reconstructions overlay with each other in a unique orientation as measured by local cross correlation (Extended Data Fig. 6), confirming that TmrAB is in a native conformation that is not induced by Fab binding. These experiments also demonstrated that both Fab incorporation and utilization of the direct electron detection camera improved accuracies of image alignment and subsequent resolution of the final reconstruction (Extended Data Table 1).
A model of TmrAB was constructed based on homology modeling and molecular dynamics flexible fitting. The crystal structure of a heterodimeric ABC exporter from a thermophilic bacterium Thermotoga maritima, TM287/2888, was used as starting template. TM287 shares 31.3% sequence identity with TmrB, whereas TM288 shares 37.8% sequence identity with the TmrA. Following consideration of 2D class averages (Fig. 1c), immunoblotting data (Fig. 1d) and 3D reconstruction of TrmAB-BA6 (Extended Data Fig. 4), we concluded that BA6 binds to the tip of TmrB's NBD, opposite the AH5 binding site. This allowed us to position unambiguously the homology model into the density map as well as determine the handedness of the 3D reconstruction. The model was fit into the TmrAB-AH5 density map by molecular dynamics flexible fitting (MDFF)19, yielding the final model of TmrAB (Extended Data Fig. 7). In both the 3D density map and the fitted model, a cavity is evident that is accessible to the cytoplasm, suggesting that TmrAB is in an inward-facing conformation (Fig. 3a). The model also confirms that AH5 and BA6 interact with the NBD of TmrA and TmrB respectively. Such Fab binding inhibits ATPases activity of TmrAB (Extended Data Fig. 8), thus locking TmrAB in the current conformation.
Figure 3. Atomic model of TmrAB showing the laterally open inward-facing conformation.

a, Representation of internal volume and opening to the external surface of the transporter. TmrA is colored salmon and TmrB is colored cyan. b, Two different views (tilted around the axis perpendicular to the membrane plan) of the substrate-binding cavity in the TMDs. Density bound to helix H4 (Tyr187) and H5 (His246) of TmrB was observed at a threshold of 5σ. It has the size to accommodate a Hoechst 33342 molecule, which is a known cargo molecule of TmrAB, but was not added during the protein purification. The cargo-like density is inside the cavity but near the inner leaflet of membrane. This position suggests a possible substrate pathway. c, Ribbon diagram of the TmrAB NBDs in the nucleotide free state. Predicted locations of two pairs of cysteine mutations are marked. d, Non-reducing SDS-PAGE gel demonstrating disulfide cross-linking of both double cysteine mutants in the apo-state, and showed a clear difference in cross-linking behavior between nucleotide free and bound TmrAB.
In the 3D reconstructions, the detergent micelle forms a torus in which two helices lie in the surface resulting in an unusual bi-lobed micelle with two halves tilted from each other by about 30° (Fig. 2a). This separation is mediated in both monomers by TM4, which curves outward with TM5 and protrudes closer to the head groups of α-DDM (Fig. 2c). The TMDs contain two subdivisions, each of which is composed of TM1, TM2, TM3 and TM6 of one monomer and TM4 and TM5 of the other monomer. The splitting of the micelle matches the subdivisions of the TMDs in this conformation.
A large cavity is located on one side of the TMDs, surrounded by TM1-3 and TM6 of TmrA and TM4-6 of TmrB (Fig. 3a). Significant density (visualized at 5σ) was observed in the cavity bound to TM5 of TmrB (Fig. 3b, Extended Fig. 3a), analogous to the substrate binding sites identified for glutathione ATM1-type transporters20,21. This density has sufficient size to accommodate molecules as large as a Hoechst 33342 molecule, a known substrate for TmrAB5. While the identity of the molecule that contributed to this density is unknown, we speculate that it is attributable to an unknown molecule co-purified with TmrAB, molecules of DDM detergent, or lipids, suggesting that the cavity contains the cytoplasmic substrate-binding site. Although the cavity is open to the cytosol, it also has a small, lateral V-shaped gap (formed by TM4 and TM6 of TmrB) that provides an additional entry point from the inner leaflet of the surrounding membrane. However, this gap is considerably smaller than the opening found in a wide-open, V-shaped apo conformation, such as in the open apo state of MsbA22.
The structure of TmrAB reported here is in an inward-facing state in which two NBDs are in contact with each other via their C-terminal helices. This conformation is similar to the substrate-bound nucleotide-free state of ATM1-type exporters20,21 or a eukaryotic P-glycoprotein homolog23. We confirmed that the isolated TmrAB truly is nucleotide free (Extended Data Fig. 8). Therefore, in the nucleotide-free TmrAB structure, two NBDs remain in contact with each other via the C-terminal helices of both NBDs (Fig. 2d), burying a total surface area of ∼980Å (see Online Methods) with a minimal distance between the Cα positions of the two C-terminal helices of ∼5Å. Disulfide bond cross-linking of nucleotide-free TmrAB with two independent cysteine mutation pairs in their C-terminal helices (TmrA-L585C/TmrB-G564C, or TmrA-A591C/TmrB-A567C) validated this interaction (Fig. 3c-d and Extended Data Figure 9). Consequentially, the two subdivisions of the TMDs are not widely separated. Indeed, no TmrAB particles were observed in a wide-open, V-shaped conformation as found in some crystal structures of nucleotide-free ABC exporters where the two NBDs are separated by a distance of 20 - 40Å9,22,24,25.
Connecting conformational states of a given ABC transporter to its substrate transport cycle requires structures at all distinct functional states, which are currently not available for most transporters. Therefore we were limited to compare the structures from different members of the family. The well-resolved helices and distinct features of our reconstruction ensure that the structure of TmrAB reported here is of sufficient precision to compare on a secondary structural level with structures of other ABC exporters, the AMPPNP-bound intermediate inward facing structure of TM287/2888 and the ADP bound outward facing structure of homodimeric Sav186626, determined by crystallography. Such comparison suggests a trajectory of conformational changes connecting these states (Supplementary Movie 1 and 2). In TmrAB, the Walker A motifs in the two NBDs face each other but do not face the ABC signature motifs of the opposite NBDs (Fig. 4a top). In AMPPNP-TM287/288 the NBDs are in a different dimer contact state with the Walker A and ABC signature motifs of the opposite NBDs facing each other (Fig. 4a middle). In the outward-facing Sav1866 structure, the NBDs are in a further closed dimer state (Fig. 4a bottom) to sandwich two nucleotides between the NBDs as if in a hydrolytically competent-like state. This suggests that the NBDs may slide and rotate against each other as they bind, then sandwich ATP molecules between the domains during the transition from the inward to outward facing conformation in a mechanism similar to that of the ABC importers27.
Figure 4. Comparison of the inward facing conformation of TmrAB with the intermediate inward facing structure of TM287/288 and the outward facing structure of Sav1866.

a, Conformational changes in NBDs viewed from the membrane towards the cytosol. The Walker A motifs (blue) do not face the ABC signature motifs (green) in the atomic model of TmrAB (top) while they do in the TM287/288 structure (middle), but a single AMPPNP molecule (shown as sticks) is bound predominantly in one NBD. In the Sav1866 structure (bottom), the two motifs from the opposite domains come close to sandwich two ADP molecules (shown as sticks). b, Changes in lateral opening to the cavity. The lateral opening between TM4 and TM6 shown by dashed lines (left) narrows down from the TmrAB model (top) to the TM287/288 structure (middle), and completely closes in the Sav1866 structure (bottom), resulting in an opening to the extracellular space.
The relative NBD positions are associated with reorganizations of the TMDs, especially TM4 and TM6. In TmrAB, TM4 and TM6 of chain B show the furthest separation of ∼18Å (Fig. 4b top), which corresponds to the lateral cavity opening shown in the open volume calculation of Fig. 3 as well as the substrate position. The lateral cavity opening is present in the intermediate state structure of TM287/288 but has narrowed to a maximal separation of 10Å (Fig. 4b middle) between the hinges of TM4 and TM6. In the outward-open conformation of Sav1866, the cavity is completely occupied by TM4 and TM6, leaving an opening exposed to the extracellular surface (Fig. 4b bottom). The rearrangements in the transmembrane domain, specifically TM4 and TM6, work in concert to close the lateral membrane gate and open a perpendicular extracellular gate. These movements are coupled to sliding and rotation of the NBDs from an orientation with Walker A motifs in contact with each other to an orientation wherein the Walker A motifs contact the opposing ABC motif (Supplementary Movie 3 and 4).
Here, we used single particle cryo-EM to determine a subnanometer resolution structure of detergent-solubilized TmrAB in the nucleotide-free state without influence from crystal packing. The resulting structure revealed an asymmetric inward-facing state with NBDs in contact but not in a position for ATP hydrolysis. Compared to another membrane protein recently determined to 3.4Å resolution (TRPV1, ∼300kDa and C4 symmetry)11, TmrAB is a more challenging target because of its smaller size (∼135kDa) and its pseudosymmetry. The structure reported here greatly extends the capability of single particle cryo-EM. At this resolution all helices in TMD and NBDs are unambiguously resolved, affording the determination of a reliable model based on the well-established workflow of homology modeling and flexible docking19. It was made possible by taking advantage of three novel technologies: (i) Fab assisted single-particle cryo-EM13, (ii) newly developed cryo-EM methodologies including a direct electron detection camera, and (iii) maximum likelihood based classification and refinement28. Each of these technological advancements improves accuracy of image alignments and the resolutions of the final reconstructions (Extended Data Table 1). In theory, it is possible to achieve ∼3Å resolution structure of proteins as small as ∼100kDa12. In practice, there are still major technological limitations that prevent achieving this goal, even with recent technological advances. Nevertheless, we expect that the combined approaches used in this study will be a powerful strategy for capturing the molecular features of membrane proteins in discrete functional states difficult to capture by crystallization. These structural snapshots will aid in the elucidation of membrane protein mechanisms while advancing the limits in structural determination by single particle cryo-EM.
While this manuscript is under review, Hohl et al. reported a nucleotide free structure of TM287/28829, which is almost identical with the singly AMPPNP bound structure (r.m.s.d. of 0.636Å). It supports our conclusion that NBDs remain in contact in the nucleotide free state, but cross-linking behavior (Fig. 3c) suggests a noticeable conformational change in TmrAB upon AMPPNP binding. Fully addressing such difference requires structures of the same protein at all functional states, which single particle cryo-EM holds promise to deliver.
Online Methods
Sample preparation
TmrAB was expressed and purified similarly as described previously5. Protein was extracted by using 1% β-DDM in a buffer containing 50mM Tris pH 8.0, 300mM NaCl and 1mg/mL iodoacetimide was added followed by purification on Ni2+ resin in 50mM Tris pH 8.0, 300mM NaCl, 0.05% α-DDM and finished with size exclusion chromatography on a superdex S200 (GE Healthcare) with 20mM HEPES pH 7.0, 150mM NaCl 0.05% α-DDM. For ELISA, purified TmrAB was biotinylated, using EZ-Link NHS-Chromogenic-Biotin (Pierce) as described previously15.
Phagemids were used for myc tagged Fab (Fab-myc) expression without further modification15. For constructs to express flag tagged Fab (Fab-flag), the myc tag in the phagemid was replaced with the flag tag by PCR site directed mutagenesis with a primer encoding DYKDDDDK. The amplified PCR products were cloned in at BstEII and NotI sites in the phagemids.
Fabs were expressed in Escherichia coli with IPTG induction. Phagemids encoding each Fab gene were transformed into BL21 (DE3) Gold (Stratagene). Transformed cells were grown in 2YT containing 100 μg/ml ampicillin and 2% glucose (2YT Amp Glu) at 250 rpm at 30°C overnight. The overnight culture was aliquoted into fresh 2YT Amp 0.1% Glu such that OD600 is around 0.05. The cultures were grown at 250 rpm at 37°C until the log phase where OD600 is between 0.5 and 0.8 and induced with 1mM IPTG. The induced cultures were grown at 200 rpm at 20°C overnight.
E. coli expressed Fabs were subject to periplasmic protein fractionation by osmotic shock. Cell pellets of the induced cultures were resuspended in ice-cold TES buffer (0.2M Tris pH8, 0.5mM EDTA, 0.5M sucrose), followed by an equal volume of ice-cold ddH2O containing protease inhibitor cocktail (complete EDTA-free, Roche). The cell resuspension was incubated on ice for 30 min with gentle swirling every 10 min and spun down at 13000g for 15 min. The supernatant was collected for further purification.
The periplasmic fraction was subject to affinity chromatography by a batch procedure using Ni2+-NTA agarose resin (QIAGEN) and a standard protocol recommended by the manufacturer. Purified Fabs were dialyzed against PBS buffer. For complex formation, the Fab samples were further purified by size exclusion chromatography using Superdex 75 (Pharmacia Biotech). For cryo-EM, TmrAB and Fab were mixed in a 1:2 molar ratio respectively, incubated for 30 min at room temperature and subject to size exclusion chromatography, using Superdex 200 (Pharmacia Biotech). All samples for cryo-EM were prepared and stored in 20 mM Hepes buffer, pH 7 containing 150 mM NaCl and 0.05 % α-DDM.
Fab Selection
Our Fab selection procedure has been described previously15. For a brief summary, the procedure included indirect immobilization of biotinylated TmrAB to streptavidin-coated magnetic beads, three rounds of selection of phage displayed Fabs that bind to TmrAB, and identification of binders by an ELISA screen, which used Fabs with unknown concentrations. In the Fab nomenclature, the first letters designated plates, and the second letters and the numbers designate well positions.
Qualitative and Competitive ELISA
Qualitative ELISA was done as described previously15. TmrAB was coated in the wells of Maxisorp plates (Nunc) and Fab solutions at unknown concentrations were added to the wells for binding. Fab solutions were prepared by serial dilutions of unpurified Fabs to yield series of relative concentrations.
Competitive ELISA was done in the same way as qualitative ELISA analysis using relative Fab concentrations15, with the following modifications: 1) Equal volumes of Fab-myc and Fab-flag solutions were added for each binding reaction. Unpurified Fab-myc at varying concentrations was prepared by serial dilution. Unpurified undiluted Fab-flag was kept at a constant concentration. 2) Duplicates for each binding reaction were set up. 3) Anti-c-myc-peroxidase (Roche) was added in one reaction, and anti-flag® M2-peroxidase (Sigma) was added in the other. In Fig. 1, binding reactions for each graph contain AD12-myc at varying concentrations and Fab-flag at constant concentrations, and TmrAB immobilized on wells. AD12-myc concentration in each binding reaction was relative to undiluted supernatant of AD12-myc culture that was considered 1. Normalized ELISA signals = (ELISA signal of Fab-flag in each binding reaction)/(ELISA signal of Fab-flag when [AD12-myc] = 0); * Normalized maximum binding of Fab-flag =1. Bound Fabs were detected by anti-flag® M2-peroxidase.
Analytical HPLC Measurments
TmrAB ATPase activity and nucleotide stochiometry measurments were performed with reversed-phase high-performance liquid chomragraphy (HPLC) using an Agilent 1100 system. For all measuremennts, TmrAB and nucleotide (ATP/ADP) standards underwent organic extraction in the same manner with 25:24:1 (v/v) phenol:chloroform:isoamyl alcohol. The aqueous layer was resolved using a C18 column (Vydac, 218TP104) and gradient elution (solvent A: 100 mM KH2PO4, pH 6.0; solvent B: 90% methanol) with absorbance measurements recorded at 254 nm.
Cysteine cross-linking
TmrAB double cysteine mutants were created to test the proximity of the nucleotide binding domains in the apo state. Two double-cysteine mutant constructs were generated, TmrA_A591C/TmrB_A567C and TmrA_L595A/TmrB_G564C. A591C/A567C was designed using the primers 5′ – GGCCAAGGGCGGCTACTACGCCTGCTTGTACCGGCTCCAGTTCCAG – 3′ and 5′ –CAGGCCGGAGGCCTCTACTGCGAGATGGACCGCCTGCAG – 3′ and L565C/G564C using 5′- CCGCCTTGTACCGGTGCCAGTTCCAGGAGGC – 3′ and 5′ – GAGAGCCTCCTTCAGGCCGGATGCCTCTACGCGGAGATGGACCGCCTG – 3′. Note that TmrAB contains an exposed native cysteine residue (TmrA-416C) that could not be removed.
The double cysteine mutants were purified without nucleotides following the similar procedure as used for the wild type TmrAB, with β-DDM (1 ∼ 1.05%) used for protein extraction and no iodoacetimide added. Cross-linking of TmrAB with double cysteine mutations was assessed in the presence or absence of 1mM Cu2+ Phenanthroline, 0.7mM AMPPNP or ATP/Na+ orthovanadate (5mM) with or without 5mM MgCl2 as indicated in the label of Extended Data Figure 9b. All nucleotides were heated to 68°C, the permissive temperature for maximal ATP hydrolysis, for 3.5min followed by immediate cooling on ice followed by 1mM Copper Phenanthroline (Sigma) induced crosslinking for 30 minutes on ice. Crosslinking was quenched with 125mM EDTA in a non-reducing SDS loading buffer and immediately loaded onto SDS-page for analysis.
Expression level of L595C/G564C was much lower than that of A591C/A567C. Nevertheless, L595C/G564C could be purified and was assessed for cross-linking with and without the oxidizing reagent Cu2+ phenanthroline at a lower concentration (567nM) because of lower yields. Crosslinking in both cases proceeded to >99% as judged by SDS page.
The A591C/A567C mutant activity was compared to the wild-type protein following cross-linking with Copper Phenanthroline followed by buffer exchange on Millipore spin concentrators. Samples were incubated with 73.28nM TmrAB, 2.09mM MgCl2and 1mM Copper Phenanthroline for 30min, followed by 3 ∼100 fold dilutions with the purification buffer (20mM Hepes, 150mM NaCl, 0.05% α-DDM). Samples were then incubated with ATP at a final concentration of 70nM transporter, 2mM MgCl2, and 250μM ATP (pH 7.0) at 60°C for 1 hour in preparation for analytical HPLC analysis.
Negative Stain EM
Each Fab and TmrAB were mixed in a 2:1 molar ratio in pH 7.4 PBS containing 0.05% ß-DDM, incubated at room temperature for 5 min, and negatively stained using uranyl formate. EM grids of negatively stained samples were prepared as previously described30. Specifically, 2.5 μl samples of detergent solubilized TmrAB alone or in complex with Fabs were applied to glow-discharged EM Cu grids covered by a thin layer of continuous carbon film and were stained with 0.75% (w/v) uranyl formate. Negatively stained EM grids were observed on a Tecnai T12 microscope (FEI Company, Hillsboro, OR) operated at 120kV. Images were recorded at a nominal magnification of 52 kX using a 4K × 4K CCD camera (UltraScan 4000, Gatan, Inc., Pleasanton, CA), corresponding to a pixel size of 2.21 Å on the specimen. All images were binned to the final pixel size of 4.42 Å for further processing. Particles were selected manually and were subjected to 6 cycles of multi-reference alignment (MRA) and K-means classification using SPIDER31. Approximately 3,000 particles for the TmrAB-Fab complex were manually picked from each sample and used for 2D analysis. 60 classes were generated for TmrAB in complex with single Fabs except DH5, and all double Fabs. 50 classes were generated for TmrAB in complex with DH5.
Cryo-EM
Cryo-EM grids were prepared by a standard plunge freezing procedure as described16. Specifically, Quantifoil grids (Quantifoil Micro Tools GmbH, Germany) were glow-discharged for 10 sec and a 2 μl sample was loaded onto the grid and plunge-frozen in liquid ethane cooled by liquid nitrogen using a Vitrobot Mark III (FEI Company). CryoEM grids of the TmrAB-AH5, -BA6 complexes and TmrAB alone were imaged using a Tecnai TF20 electron microscope equipped with a field emission source (FEI Company) and operated at 200 kV. Images were collected at a nominal magnification of 80 kX using a TemF816 8K × 8K CMOS camera (TVIPS GmbH, Gauting, Germany) corresponding to a pixel size of 0.935 Å on the specimen. All images were binned by a factor of 4 for further processing, resulting in a pixel size of 3.74 Å. Images were recorded with a defocus in the range from -2.0 to -3.5 μm. Defocus values were determined for each micrograph using CTFFIND332.
For the AH5 complex, an addition dataset was collected using Tecnai TF30 Polara equipped with a field emission source and operated at 300kV. Images were recorded on a Gatan K2 Summit camera operated in super-resolution counting mode following the established dose fractionation data acquisition protocol16. Specifically, images from TF30 were recorded at a nominal magnification of 20 kX, corresponding to a calibrated super resolution pixel size of 0.98 Å on the specimen. The dose rate on the camera was set to be ∼8 counts (corresponding to ∼9.9 electrons) per physical pixel per second. The total exposure time was 16 seconds, leading to a total accumulated dose of 41 e-/Å2 on the specimen. Each image was fractionated into 32 subframes, each with an accumulation time of 0.5 s/frame. All dose-fractionated cryo-EM images were recorded using a semi-automated acquisition program UCSFImage4 (written by Xueming Li). Images were recorded with a defocus in a range from -2.5 to -4.0μm. All super-resolution counting images were binned by 2 × 2 for further processing, resulting in a pixel size of 1.96 Å. All 32 motion corrected subframes were averaged together to a single micrograph for subsequent processing. Defocus values were determined for each micrograph using CTFFIND332. For the dataset of the AH5 complex collected with TF20 microscope, the particles were manually picked. For all other datasets, we used a semi-automated particle picking procedure similar as described recently11,33. For each dataset, we manually selected ∼2,000 particles and generated 2D class averages using reference-free classification followed by multiple rounds of multi-reference alignment (MRA) and classification. Unique 2D class averages were used as templates for automated particle picking. All picked particles were subject to visual inspection to remove all possible bad particles. Initial 3D models were generated using the common lines method34 and filtered to 60 Å resolution as the initial reference for further refinement. 3D reconstructions were calculated and refined using Relion28. The resolutions of final 3D reconstructions were estimated using gold-standard Fourier Shell Correlation (FSC) curve = 0.143 criteria17. The final map was sharpened by a resolution dependent amplitude-scaling factor35 and implemented in xmipp36. Local resolution was estimated using ResMap18. All cryo-EM image process parameters are listed in Extended Data Table S1, which also shows that adding Fab, and using direct electron detection camera improved the alignment accuracy and resolution of 3D reconstructions. Local correlations between maps are computed using “vop localCorrelation” function in UCSF Chimera (Extended Data Fig 7). The difference in resolution may contribute to the low correlation at certain regions.
Fitting of Atomic Structures
A homology model of TmrAB was generated using SWISS-MODEL Automated Mode37 and the atomic structure of heterodimeric ABC exporter TM287/TM288 with one AMPPNP bound (PDB code: 3QF4) used as the template. The atomic structure of a Fab (PDB code: 1M71) was used to fit the Fab density of either AH5 or BA6. Atomic models of TmrAB and Fab were docked into the 3D reconstructions using the “fit-in-map” function in UCSF Chimera38. Handedness was determined at this stage. The difference of fitting between the default map and its mirrored version is significant by visual inspection. The docked models were further refined by molecular dynamics flexible fitting (MDFF)19. The initial homology model shows an unstructured region between TM1 and TM2 of TmrA due to lack of corresponding sequence in the template. We analyzed the sequence around the region using the Quick2D function in MPI Bioinformatics Toolkit39 and part of it was predicted to form a helix by multiple prediction methods. Therefore, we built a short segment of helix for that part using the “Build Structure” function in UCSF Chimera. That helical segment fitted well in the density map. All molecular graphics images were produced using UCSF Chimera38.
Structure analysis
Sequence identity between the TmrAB chains and the TM287/288 model were determined with the clustalW webserver. Internal cavities that are connected to the external environment are visualized using the 3V algorithm40. This procedure uses 1.5Å sphere to represent water and calculates a completely accessible volume. The protein surface environment is calculated with a 12Å sphere that cannot access inner cavities, and the two volumes are subtracted to provide only those areas buried that water can enter from the external environment. In this calculation, only one large interconnected cavity was identified in the interior of TmrAB, connected to the surface via a cleft between TM4 and TM6. Buried surface area calculations were calculated in Pymol.
Extended Data
Extended Data Figure 1. Binding characterization of Fabs against TmrAB.
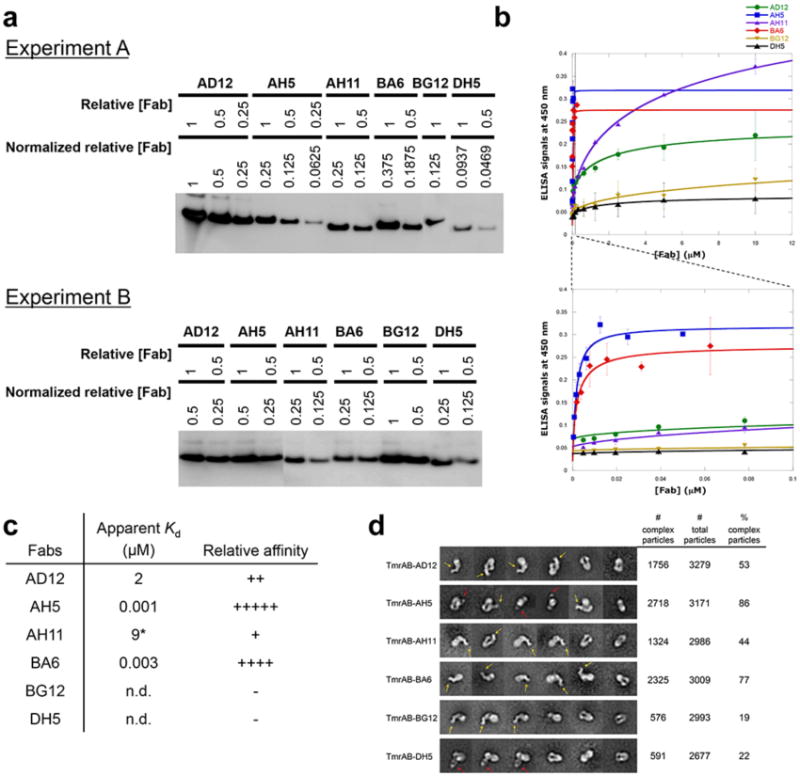
a, Expression levels of Fabs used in ELISA in Fig 1a. Expression levels were assessed by immunoblotting with anti-c-myc antibody and normalized against the highest expression level such that undiluted AD12 equals normalized relative concentration of 1. Binding was monitored by anti-c-myc antibody. b, ELISA with purified Fabs against TmrAB. Purified flag tagged Fabs (Fab-flag) were used in binding reactions. Binding was monitored by anti-flag® M2-peroxidase. Experiments were repeated twice. c, Relative affinities of the Fabs. The ELISA signal data from the Extended Data Fig 1b were fit to a bimolecular binding equation to produce binding curves and apparent Kd values. AH5 showed the highest affinity, followed by BA6, AD12 and AH11. DH5 and BG12 did not show significant binding. Apparent Kd values do not yield meaningful biophysical properties because the concentration of TmrAB participating in the binding reaction is unknown and the transporter is not free in solution. However, comparison among the Fabs should be sufficient enough to determine their relative affinities. Despite unpurified DH5 showed significant binding (Extended Data Fig 1a), purified DH5 did not show significant binding. n.d. not determined. d, Negative stain EM analysis of Fab +TmrAB mixes. Representative 2-D class averages include complex images that show clear Fab densities and images that do not. The two typical Fab views, the dumbbell and donut shaped views, are indicated by yellow and red arrows, respectively. Fab images indicate that Fabs are rigid and form rigid complexes. Percentages of complex particles were assessed by fractions of the numbers of images that clearly show Fab densities (# complex particles) to the total numbers of images that were included (# total particles) in 2-D class averages. The percentages correspond to relative affinity ranking determined by ELISA (Extended Data Fig 1c).
Extended Data Figure 2. Purification of a-DDM solubilized and Single particle cryo-EM of TmrAB-AH5 complex.

a, Elution profiles of TmrAB alone and TmrAB-AH5 from Superdex 200 are shown in blue and red curves respectively, showing a clear shift of the elution peak of the TmrAB-AH5 complex to a higher molecular weight position. The shifted peak corresponding to fractions A6-A8 contained TmrAB and AH5, confirmed by SDS-PAGE. Fractions B3-B5 correspond to unbound AH5 and the loading material was run for comparison. b, Raw micrograph of TmrAB-AH5 (∼185kDa) embedded in a thin layer of vitreous ice. c, Fourier power spectrum calculated from micrograph shown in a. d, 2D class averages of TmrAB-AH5 complex. Fab AH5 is clearly visible in many class averages. e, Initial 3D reconstruction calculated from 2D class averages using common lines method implemented in SPIDER. f, Fourier shell correlation (FSC) curves of TmrAB-AH5 (red), TmrAB-BA6 (purple) and TmrAB alone (blue). g, Euler angle distribution of all particles used in the final reconstruction. h, Final 3D reconstruction colored with local resolution. i, Voxel histogram corresponding to local resolution. The majority of voxels is at 6 ∼ 7Å resolution. Estimation of local resolution that is too close to the Nyquist (3.9Å) may not be accurate.
Extended Data Figure 3. Selected slice views of the 3D reconstruction of TmrAB-AH5.

The views are oriented in parallel with the membrane plane. The numbers of slices are marked. a, All transmembrane helices of both TmrA and TmrB are labeled. The arrow points to the extra density in the cavity. b, Two NBDs are in contact with each other. c, The C-terminal helices of TmrA and TmrB are in close contact.
Extended Data Figure 4. Single particle cryo-EM of TmrAB-BA6 complex.

a, Raw micrograph of TmrAB-BA6 (∼185kDa) embedded in a thin layer of vitreous ice. Images were collected on a Tecnai TF20 microscope using scintillator based TVIPS 8K × 8K CMOS camera. b, Fourier power spectrum calculated from micrograph shown in a. c, 2D class averages of TmrAB-BA6 complex. Fab BA6 is clearly visible in many class averages. d, Initial 3D reconstruction of TmrAB-BA6 determined using common lines method implemented in SPIDER. e, Two different views of the final 3D reconstruction of TmrAB-BA6 filtered to a resolution of 9.4Å. Same as in the 3D reconstruction of TmrAB-AH5, density of micelle is split into two halves and tilted with each other. The orientation of micelle is marked with a pair of black solid lines and the gap in the micelle density generated by the helix H4 from TmrB is marked with a pair of red dashed lines. f, Densities of TmrAB in the 3D reconstructions of TmrAB-AH5 (khaki) and TmrAB-BA6 (grey mesh) overlap. Fabs AH5 and BA6 are pointed with arrows. g, An enlarged view to show the interface between TmrAB and BA6, which has a linear epitope in the NBD of TmrB.
Extended Data Figure 5. Single particle cryo-EM of TmrAB alone without Fab.

a, Raw micrograph of TmrAB alone (∼135kDa) embedded in a thin layer of vitreous ice. Images were collected on a Tecnai TF20 microscope using scintillator based TVIPS 8K × 8K CMOS camera. b, Fourier power spectrum calculated from micrograph shown in a. c, 2D class averages of TmrAB. d-f, Three different views of TmrAB 3D reconstruction shown in different (low: grey, high: gold) isosurface thresholds. Model of TmrAB (in ribbon diagram) was docked into the density map. The orientation of micelle is indicated with pairs of solid black lines in f and the gap of micelle is indicated with a pair of red dashed lines. g-h, Densities of TmrAB in the 3D reconstructions of TmrAB alone (transparent khaki) and in complex with AH5 (grey mesh) overlap with each other.
Extended Data Figure 6. Cross correlation between TmrAB-AH5, TmrAB-BA6 and TmrAB.

Left: density map of TmrAB-AH5 is colored according to the value of local cross correlation values of TmrAB-AH5 with TmrAB-BA6 (upper), with TmrAB (lower). Middle: density map of TrmAB-BA6 is colored according to the value of local cross correlation values of TmrAB-BA6 with TmrAB-AH5 (upper), and with TmrAB (lower). Right: density map of TmrAB is colored according to the local cross correlation value of TmrAB with TmrAB-AH5 (upper) and with TmrAB-BA6 (lower).
Extended Data Figure 7. Atomic model of TmrAB.
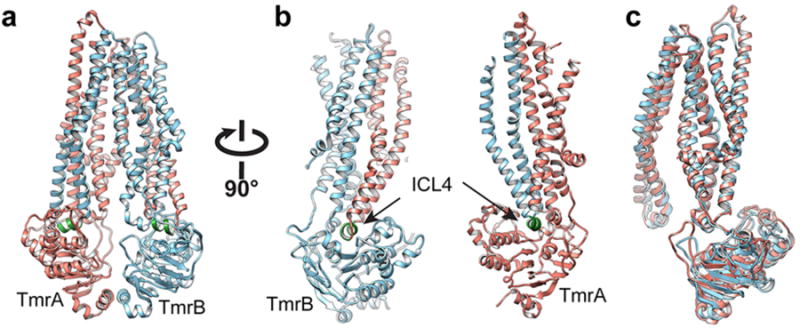
a, b, Two different views of the atomic model of TmrAB, generated by flexible fitting of the sequence homology model of TmrAB into the density map of TmrAB-AH5 complex. TmrA is colored in salmon, and TmrB is colored in blue. Intracellular loop 4 is colored in green. c, Two subunits are arranged with a pseudo-two fold symmetry.
Extended Data Figure 8. AH5 and BA6 inhibit the ATPase activity of the TmrAB.
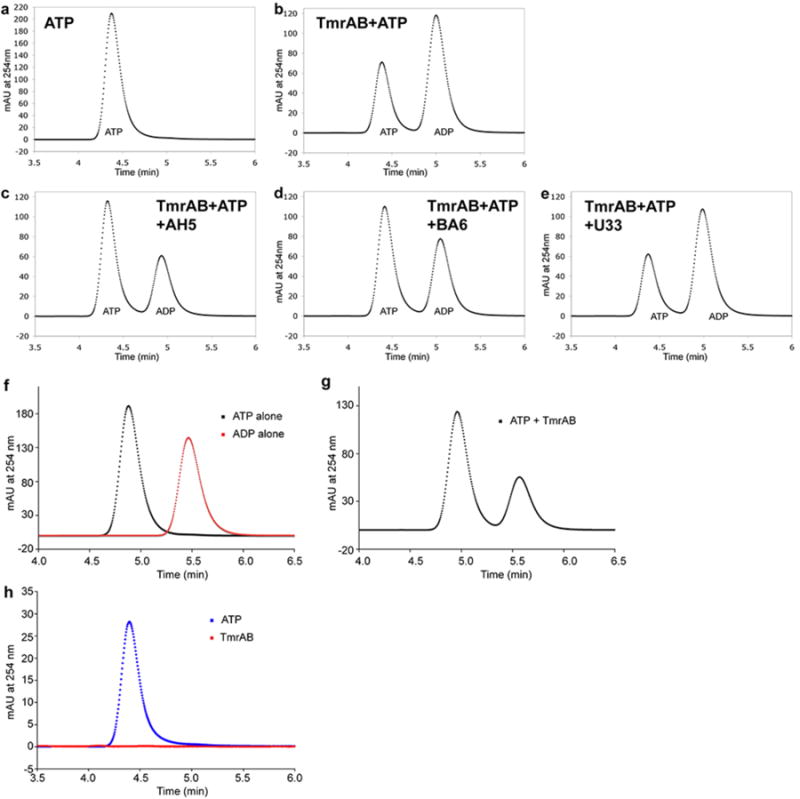
a, ATP standard for panels b to e. b - e, ATP hydrolysis assay at 37°C. Reactions were carried out at 37 °C for 20 min with 6.25 μM of TmrAB, 250 μM ATP and 2 mM MgCl2 in the presence of 25 μM of AH5 (c), BA6 (d) or a negative control Fab, U33 (e). ATP hydrolysis by TmrAB was reduced in the presence of AH5 or BA6 when compared to the equivalent reaction in the absence of Fabs (b). ATP hydrolysis was not affected by the presence of U33, which does not bind to TmrAB (e). f, ATP and ADP standards (250 μM each) for g. Two peaks were resolved corresponding to ATP and ADP (black and red curves respectively). g, ATP hydrolysis by TmrAB was carried out with 70 nM of TmrAB, 250 μM ATP and 2 mM MgCl2 at 60 °C for 30 min. h, Identification of the TmrAB nucleotide binding state. ATP was not detected from the protein-extracted aqueous phase (red curve). ATP at an equivalent concentration (blue curve) is shown as a control to demonstrate sufficient sensitivity for nucleotide detection.
Extended Data Figure 9. Cysteine cross-linking validating interaction between the C-terminal helices of TmrAB in the nucleotide free state.
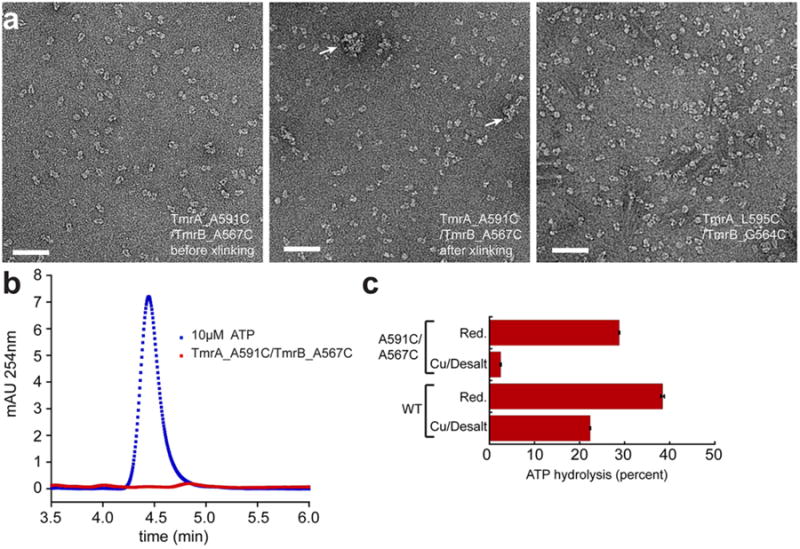
a, Three samples (marked with * in panel d of Fig. 3) were visualized by negative stain EM, showing that TmrAB with the double cysteine mutation has the native dimeric shape of TmrAB. TmrAB contains an exposed native cysteine residue (TmrA-C416) that could not be removed. It causes some inter-dimer cross-linking (marked by arrows) under the oxidative condition. b, Analytical HPLC demonstrating that purified TmrAB containing the A591C/A567C mutation is nucleotide free. c, ATP hydrolysis assay indicating that disulfide cross-linking inhibits the ATPase activity of TmrAB containing the double cysteine mutation. Assays were performed in triplicate for 1 hour at 60°C with 70nM reduced or oxidized TmrAB, 250μM ATP, and 2mM MgCl2 prior to analysis by analytical HPLC.
Extended Data Table 1.
Summary of TmrAB structure determination by single particle cryo-EM. We determined three 3D reconstructions of TmrAB complexed with a Fab, AH5 or BA6, and a 3D reconstruction of TmrAB alone, using two different microscopes, TF30 Polara and TF20. TF30 Polara is equipped with a K2 Summit camera, and TF20 is equipped with an 8K × 8K phosphor scintillator based CMOS camera. All 3D reconstructions were determined using RELION. Parameters of accuracy (marked with *) were obtained from RELION. The rotational accuracy of refinement of TmrAB in complex with Fabs (6.5° ∼ 7.3°) is significantly better than the TmrAB alone (9.5°), suggesting that the Fabs improved the accuracy of angular refinement.
| Protein sample | TmrAB-AH5 | TmrAB-AH5 | TmrAB-BA6 | TmrAB |
|---|---|---|---|---|
| Electron microscope | TF20 | TF30 Polara | TF20 | TF20 |
| Pixel size (Å) | 3.74Å | 1.96Å | 3.74Å | 3.74Å |
| Number of micrograph | 347 | 639 | 301 | 594 |
| # of particles picked | 27,000 | 131,000 | 41,000 | 46,000 |
| Final # of particles | 27,000 | 102,000 | 30,000 | 36,000 |
| Resolution (Å) | 10.6 Å | 8.2Å | 9.4Å | 10.0Å |
| AccuracyRotations* | 6.579° | 7.306° | 7.094° | 9.5° |
| AccuracyTranslation* | 1.085 pixel | 2.018 pixel | 0.994 pixel | 1.195 pixel |
| AccuracyTranslation* | 4.06Å | 3.96Å | 3.72Å | 4.47Å |
| B-factor | N/A | -1195Å2 | -1415Å2 | -1851Å2 |
Supplementary Material
Movie S1: 3D reconstruction of TmrAB-AH5 complex at a resolution of 8.2Å.
Movie S2: Slicing through TMDs of TmrAB, showing micelle density and the separation of TM helices.
Movie S3: Morph movie shows a conformational change from apo (TmrAB) through TM287/288 to Sav1866. In this orientation, closing of the lateral gate is shown.
Movie S4: Morph movie shows the same conformational change from an orientation different than Movie S3. Transition from inward-facing to outward-facing conformations is shown.
Acknowledgments
This work was supported by grants from the National Institute of Health (R01GM098672, and S10RR026814 to Y.C., P50GM082250 to A. Frankel, P50GM073210 to R.M.S. and C.S.C. and R37GM024485 to R.M.S.), the UCSF Program for Breakthrough Biomedical Research (Y.C.), and the German Research Foundation (SFB 807 and TA157/7 to R.T.) as well as the European Drug Initiative on Channels and Transporters (EDICT to R.T.) funded by the European Commission Seventh Framework Program.
Footnotes
Author contributions: J.K. identified, expressed, purified and characterized all Fabs used in this study, and generated TmrAB-Fab complexes. S.W carried out all cryo-EM experiments, including data acquisition and processing. T.T. and C.M. expressed and purified TmrAB, and purified TmrAB-Fab complexes. T.T. carried out cross-linking experiments. C.M. expressed and purified TmrAB for the generation and initial screening of all Fabs. S.S. carried out initial characterization of all Fabs. M.B.W. performed HPLC experiments. Y.R.C. performed mutagenesis experiments. J.K., S.W., T.T. and Y.C. analyzed data. J.K., S.W., T.T., M.B.W., R.M.S., R.T., C.S.C and Y.C. participated in discussion and wrote the manuscript.
Author Information: All 3D cryoEM density maps were deposited in the Electron Microscopy Data Bank under the accession number: EMD-6085 (TmrAB-AH5), EMM-6086 (TmrAB-BA6) and EMD-6087 (TmrAB).
The authors declare no competing financial interests.
References
- 1.Rees DC, Johnson E, Lewinson O. ABC transporters: the power to change. Nature review Molecular cell biology. 2009;10:218–227. doi: 10.1038/nrm2646. [DOI] [PMC free article] [PubMed] [Google Scholar]
- 2.Schmitt L, Tampe R. Structure and mechanism of ABC transporters. Current opinion in structural biology. 2002;12:754–760. doi: 10.1016/s0959-440x(02)00399-8. [DOI] [PubMed] [Google Scholar]
- 3.Gottesman MM, Ambudkar SV. Overview: ABC transporters and human disease. Journal of bioenergetics and biomembranes. 2001;33:453–458. doi: 10.1023/a:1012866803188. [DOI] [PubMed] [Google Scholar]
- 4.Parcej D, Tampe R. ABC proteins in antigen translocation and viral inhibition. Nature chemical biology. 2010;6:572–580. doi: 10.1038/nchembio.410. [DOI] [PubMed] [Google Scholar]
- 5.Zutz A, et al. Asymmetric ATP hydrolysis cycle of the heterodimeric multidrug ABC transport complex TmrAB from Thermus thermophilus. J Biol Chem. 2010;286:7104–7115. doi: 10.1074/jbc.M110.201178. [DOI] [PMC free article] [PubMed] [Google Scholar]
- 6.Higgins CF, Gottesman MM. Is the multidrug transporter a flippase. Trends in Biochemical Sciences. 1992;17:18–21. doi: 10.1016/0968-0004(92)90419-a. [DOI] [PubMed] [Google Scholar]
- 7.vanHelvoort A, et al. MDR1 P-glycoprotein is a lipid translocase of broad specificity, while MDR3 P-glycoprotein specifically translocates phosphatidylcholine. Cell. 1996;87:507–517. doi: 10.1016/s0092-8674(00)81370-7. [DOI] [PubMed] [Google Scholar]
- 8.Hohl M, Briand C, Grutter MG, Seeger MA. Crystal structure of a heterodimeric ABC transporter in its inward-facing conformation. Nature structural &molecular biology. 2012;19:395–402. doi: 10.1038/nsmb.2267. [DOI] [PubMed] [Google Scholar]
- 9.Shintre CA, et al. Structures of ABCB10, a human ATP-binding cassette transporter in apo- and nucleotide-bound states. Proceedings of the National Academy of Sciences of the United States of America. 2013;110:9710–9715. doi: 10.1073/pnas.1217042110. [DOI] [PMC free article] [PubMed] [Google Scholar]
- 10.Ward AB, et al. Structures of P-glycoprotein reveal its conformational flexibility and an epitope on the nucleotide-binding domain. Proceedings of the National Academy of Sciences of the United States of America. 2013;110:13386–13391. doi: 10.1073/pnas.1309275110. [DOI] [PMC free article] [PubMed] [Google Scholar]
- 11.Liao M, Cao E, Julius D, Cheng Y. Structure of the TRPV1 ion channel determined by electron cryo-microscopy. Nature. 2013;504:107–112. doi: 10.1038/nature12822. [DOI] [PMC free article] [PubMed] [Google Scholar]
- 12.Henderson R. The potential and limitations of neutrons, electrons and X-rays for atomic resolution microscopy of unstained biological molecules. Q Rev Biophys. 1995;28:171–193. doi: 10.1017/s003358350000305x. [DOI] [PubMed] [Google Scholar]
- 13.Wu S, et al. Fabs enable single particle cryoEM studies of small proteins. Structure. 2012;20:582–592. doi: 10.1016/j.str.2012.02.017. [DOI] [PMC free article] [PubMed] [Google Scholar]
- 14.Paduch M, et al. Generating conformation-specific synthetic antibodies to trap proteins in selected functional states. Methods. 2013;60:3–14. doi: 10.1016/j.ymeth.2012.12.010. [DOI] [PMC free article] [PubMed] [Google Scholar]
- 15.Kim J, Stroud RM, Craik CS. Rapid identification of recombinant Fabs that bind to membrane proteins. Methods. 2011;55:303–309. doi: 10.1016/j.ymeth.2011.09.012. [DOI] [PMC free article] [PubMed] [Google Scholar]
- 16.Li X, et al. Electron counting and beam-induced motion correction enable near-atomic-resolution single-particle cryo-EM. Nature Methods. 2013;10:584–590. doi: 10.1038/nmeth.2472. [DOI] [PMC free article] [PubMed] [Google Scholar]
- 17.Scheres SH, Chen S. Prevention of overfitting in cryo-EM structure determination. Nat Methods. 2012;9:853–854. doi: 10.1038/nmeth.2115. [DOI] [PMC free article] [PubMed] [Google Scholar]
- 18.Kucukelbir A, Sigworth FJ, Tagare HD. Quantifying the local resolution of cryo-EM density maps. Nat Methods. 2014;11:63–65. doi: 10.1038/nmeth.2727. [DOI] [PMC free article] [PubMed] [Google Scholar]
- 19.Trabuco LG, Villa E, Mitra K, Frank J, Schulten K. Flexible fitting of atomic structures into electron microscopy maps using molecular dynamics. Structure. 2008;16:673–683. doi: 10.1016/j.str.2008.03.005. [DOI] [PMC free article] [PubMed] [Google Scholar]
- 20.Lee JY, Yang JG, Zhitnitsky D, Lewinson O, Rees DC. Structural basis for heavy metal detoxification by an Atm1-type ABC exporter. Science. 2014;343:1133–1136. doi: 10.1126/science.1246489. [DOI] [PMC free article] [PubMed] [Google Scholar]
- 21.Srinivasan V, Pierik AJ, Lill R. Crystal structures of nucleotide-free and glutathione-bound mitochondrial ABC transporter Atm1. Science. 2014;343:1137–1140. doi: 10.1126/science.1246729. [DOI] [PubMed] [Google Scholar]
- 22.Ward A, Reyes CL, Yu J, Roth CB, Chang G. Flexibility in the ABC transporter MsbA: Alternating access with a twist. Proceedings of the National Academy of Sciences of the United States of America. 2007;104:19005–19010. doi: 10.1073/pnas.0709388104. [DOI] [PMC free article] [PubMed] [Google Scholar]
- 23.Kodan A, et al. Structural basis for gating mechanisms of a eukaryotic P-glycoprotein homolog. Proceedings of the National Academy of Sciences of the United States of America. 2014;111:4049–4054. doi: 10.1073/pnas.1321562111. [DOI] [PMC free article] [PubMed] [Google Scholar]
- 24.Aller SG, et al. Structure of P-glycoprotein reveals a molecular basis for poly-specific drug binding. Science. 2009;323:1718–1722. doi: 10.1126/science.1168750. [DOI] [PMC free article] [PubMed] [Google Scholar]
- 25.Jin MS, Oldham ML, Zhang Q, Chen J. Crystal structure of the multidrug transporter P-glycoprotein from Caenorhabditis elegans. Nature. 2012;490:566–569. doi: 10.1038/nature11448. [DOI] [PMC free article] [PubMed] [Google Scholar]
- 26.Dawson RJ, Locher KP. Structure of a bacterial multidrug ABC transporter. Nature. 2006;443:180–185. doi: 10.1038/nature05155. [DOI] [PubMed] [Google Scholar]
- 27.Pinkett HW, Lee AT, Lum P, Locher KP, Rees DC. An inward-facing conformation of a putative metal-chelate-type ABC transporter. Science. 2007;315:373–377. doi: 10.1126/science.1133488. [DOI] [PubMed] [Google Scholar]
- 28.Scheres SH. RELION: implementation of a Bayesian approach to cryo-EM structure determination. J Struct Biol. 2012;180:519–530. doi: 10.1016/j.jsb.2012.09.006. [DOI] [PMC free article] [PubMed] [Google Scholar]
- 29.Hohl M, et al. Structural basis for allosteric cross-talk between the asymmetric nucleotide binding sites of a heterodimeric ABC exporter. Proceedings of the National Academy of Sciences of the United States of America. 2014;111:11025–11030. doi: 10.1073/pnas.1400485111. [DOI] [PMC free article] [PubMed] [Google Scholar]
- 30.Booth DS, Avila-Sakar A, Cheng Y. Visualizing proteins and macromolecular complexes by negative stain EM: from grid preparation to image acquisition. Journal of visualized experiments : JoVE. 2011 doi: 10.3791/3227. [DOI] [PMC free article] [PubMed] [Google Scholar]
- 31.Frank J, et al. SPIDER and WEB: processing and visualization of images in 3D electron microscopy and related fields. J Struct Biol. 1996;116:190–199. doi: 10.1006/jsbi.1996.0030. [DOI] [PubMed] [Google Scholar]
- 32.Mindell JA, Grigorieff N. Accurate determination of local defocus and specimen tilt in electron microscopy. J Struct Biol. 2003;142:334–347. doi: 10.1016/s1047-8477(03)00069-8. [DOI] [PubMed] [Google Scholar]
- 33.Cao E, Liao M, Cheng Y, Julius D. TRPV1 structures in distinct conformations reveal activation mechanisms. Nature. 2013;504:113–118. doi: 10.1038/nature12823. [DOI] [PMC free article] [PubMed] [Google Scholar]
- 34.Shaikh TR, et al. SPIDER image processing for single-particle reconstruction of biological macromolecules from electron micrographs. Nature protocols. 2008;3:1941–1974. doi: 10.1038/nprot.2008.156. [DOI] [PMC free article] [PubMed] [Google Scholar]
- 35.Rosenthal PB, Henderson R. Optimal determination of particle orientation, absolute hand, and contrast loss in single-particle electron cryomicroscopy. Journal of molecular biology. 2003;333:721–745. doi: 10.1016/j.jmb.2003.07.013. [DOI] [PubMed] [Google Scholar]
- 36.Scheres SH, Nunez-Ramirez R, Sorzano CO, Carazo JM, Marabini R. Image processing for electron microscopy single-particle analysis using XMIPP. Nature protocols. 2008;3:977–990. doi: 10.1038/nprot.2008.62. [DOI] [PMC free article] [PubMed] [Google Scholar]
- 37.Arnold K, Bordoli L, Kopp J, Schwede T. The SWISS-MODEL workspace: a web-based environment for protein structure homology modelling. Bioinformatics. 2006;22:195–201. doi: 10.1093/bioinformatics/bti770. [DOI] [PubMed] [Google Scholar]
- 38.Pettersen EF, et al. UCSF Chimera--a visualization system for exploratory research and analysis. J Comput Chem. 2004;25:1605–1612. doi: 10.1002/jcc.20084. [DOI] [PubMed] [Google Scholar]
- 39.Biegert A, Mayer C, Remmert M, Soding J, Lupas AN. The MPI Bioinformatics Toolkit for protein sequence analysis. Nucleic acids research. 2006;34:W335–339. doi: 10.1093/nar/gkl217. [DOI] [PMC free article] [PubMed] [Google Scholar]
- 40.Voss NR, Gerstein M. 3V: cavity, channel and cleft volume calculator and extractor. Nucleic acids research. 2010;38:W555–562. doi: 10.1093/nar/gkq395. [DOI] [PMC free article] [PubMed] [Google Scholar]
Associated Data
This section collects any data citations, data availability statements, or supplementary materials included in this article.
Supplementary Materials
Movie S1: 3D reconstruction of TmrAB-AH5 complex at a resolution of 8.2Å.
Movie S2: Slicing through TMDs of TmrAB, showing micelle density and the separation of TM helices.
Movie S3: Morph movie shows a conformational change from apo (TmrAB) through TM287/288 to Sav1866. In this orientation, closing of the lateral gate is shown.
Movie S4: Morph movie shows the same conformational change from an orientation different than Movie S3. Transition from inward-facing to outward-facing conformations is shown.