Abstract
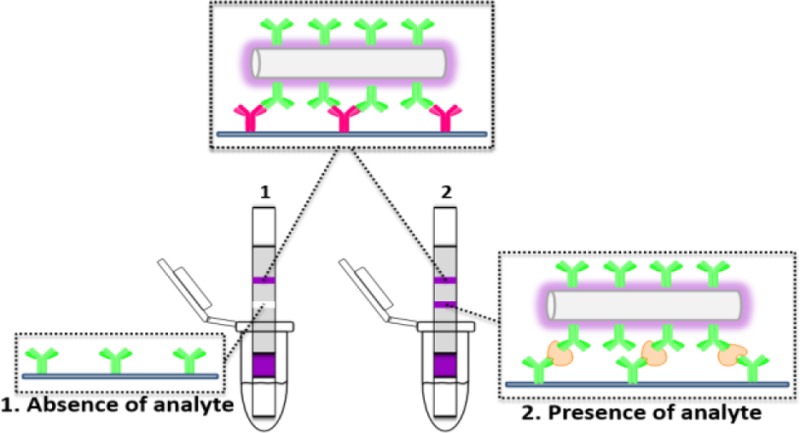
We report a rapid and highly sensitive approach based on gold-nanoparticle-decorated silica nanorods (GNP-SiNRs) label and lateral-flow strip biosensor (LFSB) for visually detecting proteins. Owing to its biocompatibility and convenient surface modification, SiNRs were used as carriers to load numerous GNPs, and the GNP-SiNRs were used as labels for the lateral-flow assay. The LFSB detection limit was lowered 50 times compared to the traditional GNP-based lateral-flow assay. Rabbit IgG was used as a model target to demonstrate the proof-of-concept. Sandwich-type immunoreactions were performed on the immunochromatographic strips, and the accumulation of GNP-SiNRs on the test zone produced the characteristic colored bands, enabling visual detection of proteins without instrumentation. The quantitative detection was performed by reading the intensities of the colored bands with a portable strip reader. The response of the optimized device was highly linear for the range of 0.05–2 ng mL–1, and the detection limit was estimated to be 0.01 ng mL–1. The GNP-SiNR-based LFSB, thus, offered an ultrasensitive method for rapidly detecting trace amounts of proteins. This method has a potential application with point-of-care screening for clinical diagnostics and biomedical research.
Sensitive detection of proteins is of tremendous interest for a broad range of applications, such as clinical diagnosis, food safety, and environmental analysis.1−5 A variety of strategies and techniques has been developed to detect proteins, including enzyme-linked immunosorbent assay (ELISA), Western blot, agarose and polyacrylamide gel electrophoresis, and immunosensors in connection with various transducers.6−14 The assay sensitivities were further enhanced by using nanomaterials (nanoparticles, nanowires, and nanotubes)15−18 and novel signal-amplification approaches.19−22 However, most nanomaterial-based signal-amplification methods generally involved a time-consuming detection process or advanced laboratory equipment. Lateral-flow immunoassay (LFI), also called immunochromatographic assay, has been studied extensively for different applications, such as pregnancy tests as well as detecting cancer biomarkers, infectious agents, and biowarfare agents.23,24 In a typical LFI, the antibody-modified marco-nano-particles move along the strip with the analytes driven by capillary force and are eventually captured by the preimmobilized antibodies in the test zone. The captured marco-nano-particles, which are proportional to the target concentrations, can be determined by observing the color changes for the test band or by recording the fluorescence, electrical, or magnetic signals with appropriate transducers.25,26 Gold nanoparticles (GNPs),27−29 carbon nanoparticles,30 quantum dots,31−33 Fe3O4 nanoparticles,34 etc. have been used as labels to develop LFIs. Although the fluorescent, magnetic, and electrical LFIs offered high sensitivity, the requirements for instrumentation and skilled personnel limit their point-of-care or in-field applications. Among the aforementioned colored particles used for LFI, GNPs are the most applicable materials due to their unique optical properties (plasma absorption), remarkable chemical stability, and easy surface modification. The GNP-based LFIs have been applied for the qualitative and semiquantitative/quantitative detection of proteins,35 metal ions,36 and natural toxins.37 Most reported LFIs for protein analysis were established with detection limits ranging from μg mL–1 (nanomolar) to ng mL–1 (picomolar).38−42 However, cancer protein biomarker detection and early diagnosis of disease often require a pg mL–1 (fetomolar) detection limit.43−45 Therefore, it is highly desirable to develop an ultrasensitive LFI for visually detecting proteins.
Recently, great efforts have been made to improve the sensitivity of the GNP-based LFIs by using a dual-labeling method. Choi et al. reported a dual-GNP conjugate-based lateral-flow assay method to analyze Troponin I.46 The first GNP conjugate was prepared with an antibody against Troponin I. The second GNP conjugate was designed to bind with the first GNP conjugate and thus resulted in a larger size to improve the detection limit. The detection sensitivity increased about 100-fold compared to the conventional LFI. Mei et al. reported a sensitivity-enhanced LFI based on the same concept using different-sized GNPs for the visual detection of bisphenol A.47 The LFI detection limit was 10 times lower compared to the traditional GNP-based assay. He et al. reported an ultrasensitive lateral-flow strip biosensor (LFSB) based on horseradish peroxidase (HRP)-GNP dual labels.48 Deposition of an insoluble, enzymatic catalytic product (red-colored chromogen) on the captured GNPs at the LFSB test zone offered a dramatic visual enhancement. Combining enzyme catalytic amplification with the unique optical properties of GNPs, the LFSB was capable of detecting 0.01 pM of target DNA without instrumentation. Tang et al. found that using magnetic GNP labels lowered the detection limit 3-fold for aflatoxin B2 compared to a conventional immunodipstick test using GNPs as colored reagents.49
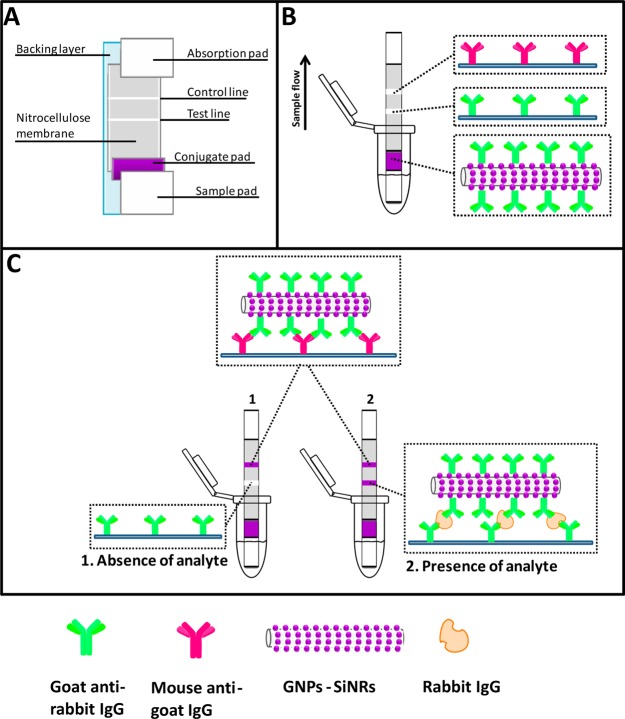
Inspired by the signal amplification methods, the composite nanomaterial, formed by numerous GNPs evenly coated on a single substrate, would be an ideal colored reagent to enhance the LFSB sensitivity. Several materials, including carbon nanotubes and polymers,50−53 were used as substrates to prepare the composite nanomaterials. However, most of the composite nanomaterials involved complicated or strict synthetic procedures. Silica-based nanomaterials (nanoparticles, nanowires, and nanorods) have attracted considerable interest in biomedical research because of their unique properties, such as inertness, high payload capacity, biocompatibility, and great surface modification.54 The silica-based nanomaterials have been utilized to develop highly sensitive biosensors and bioassays.55−58 In this paper, we report an ultrasensitive protein assay using a gold-nanoparticle-decorated silica nanorod (GNP-SiNR) label and a LFSB. Silica nanorod was chosen as a matrix to make the GNP-SiNR hybrid. A large number of GNPs on a single SiNR provided a purple color that was much darker than the pure GNP solution. The nanohybrid, instead of GNP, was used as a colored reagent in LFSB. Rabbit IgG was used as a model target to demonstrate the proof-of-concept. A pair of antibodies capable of specifically recognizing rabbit IgG was used to prepare the LFSB (Figure 1). Capture antibody was immobilized on the test zone of the LFSB, and report antibody was conjugated with GNP-SiNR hybrid (Ab-GNP-SiNR). Rabbit IgG interacted with Ab-GNP-SiNR to form rabbit IgG-Ab-GNP-SiNR complex and continued to move along the strip. Accumulation of GNP-SiNR on the test zone produced a visible dark-purple band, which could be used for either qualitative or quantitative detection of rabbit IgG by a portable strip reader. Under the optimal conditions, a detection limit of 0.01 ng mL–1 (10 pg mL–1) was obtained. The promising properties of the GNP-SiNR-based LFSB are reported in the following sections.
Figure 1.
(A) Schematic representation for the configuration of the lateral-flow strip biosensor, (B) reagents on the lateral-flow strip biosensor, and (C) measurement principle of the lateral-flow strip biosensor in the absence and presence of rabbit IgG.
Experimental Section
Apparatus
A Hitachi SU8010 field scanning-electron microscope (SEM; Tokyo, Japan) was used to take images of the developed nanocomposites. The elemental analysis was obtained by performing energy-dispersive X-ray spectroscopic (EDS) measurements (Oxford X-Max; Concord, MA, USA), and the spectrometer was attached to a Hitachi SU8010 field-emission SEM. A Shimadzu UV–vis spectrometer (Columbia, MD, USA) was used to obtain the absorption spectra of the nanomaterials. An Airjet AJQ 3000 dispenser, Biojet BJQ 3000 dispenser, Clamshell Laminator, and the Guillotine cutting-module CM 4000 purchased from Biodot LTD (Irvine, CA, USA) were used to prepare lateral-flow strips. A portable strip reader DT1030 (Shanghai Goldbio Tech. Co.; Shanghai, China) was used for signal recording.
Materials
Tetraethylorthosilicate (TEOS, 98%) was purchased from Acros Organics (NJ, USA). Sodium citrate (Na3Ct), gold(III) chloride trihydrate (HAuCl4·3H2O, 99.9+%), hydroxylamine hydrochloride (98%, ACS grade), sodium borohydride (NaBH4, >98%), Na3PO4·12H2O, sucrose, Tween 20, Triton X-100, phosphate buffer saline (PBS, pH 7.4, 0.01 M), phosphate buffer saline with 0.05% Tween 20 (PBST), and bovine serum albumin (BSA) were purchased from Sigma-Aldrich, Inc. (St. Louis, MO, USA). Ammonium hydroxide (NH4OH, 28.0%–30.0%), potassium carbonate (K2CO3·1.5 H2O, ACS grade), and ethanol (95%) were obtained from Fisher Scientific Co. (Pittsburgh, PA, USA). Polyvinylpyrrolidone molecule (PVP; average molecular weight Mn = 40 000) and 1-pentanol (99+%, ACS grade) were purchased from Alfa Aesar (Ward Hill, MA, USA). Rabbit IgG, goat antirabbit IgG (Ab1), and mouse antigoat IgG (Ab2) were obtained from Thermo Scientific (Rockford, IL, USA). Glass fibers (GFCP000800), cellulose-fiber sample pads (CFSP001700), laminated cards (HF000MC100), and nitrocellulose membranes (HFB18004) were provided by Millipore (Billerica, MA, USA). All chemicals were analytical reagent grade unless specified. All buffer solutions were prepared using ultrapure water (>18 MΩ cm) from a Millipore Milli-Q water purification system.
Preparation of Silica Nanorods (SiNRs)
A one-step synthetic method was used to prepare SiNRs. In a typical synthetic procedure, a total of 3.00 g of PVP was added to 30.00 mL of 1-pentanol. The mixture was sonicated for 30 min to obtain a well-mixed PVP/pentanol solution. Then, 3.00 mL of 95% ethanol, 0.84 mL of H2O, and 0.20 mL of 0.17 M Na3Ct were added to the PVP/pentanol mixture, followed by hand-shaking for a few seconds. After the addition of 0.30 mL of TEOS and 0.50 mL of NH4OH, the reaction was allowed to proceed overnight at room temperature. The SiNRs were collected by centrifuging at 11 000 rpm for 30 min and removing the supernatant. The collected SiNRs were washed 3 times with ethanol and dried in the oven at 100 °C.
Preparation of Gold Seeds
Typically, 4.00 mL of 1% HAuCl4 solution was added to 100.00 mL of H2O in an ice bath, followed by the addition of 0.50 mL of 0.20 M K2CO3 to reduce Au(III) to Au(I). The solution is then stirred for 10 min until its color changes from yellow to light yellow or colorless. Then, 1.00 mL of freshly prepared NaBH4 (0.50 mg/mL) was slowly added. The formation of a reddish solution indicated the successful synthesis of gold seeds.
Preparation of Gold-Nanoparticle-Decorated Silica Nanorods (GNP-SiNRs)
The GNP-SiNRs were prepared according to the reported methods with slight modifications.59 An aliquot with 1.00 mL of 10.00 mg/mL SiNR solution was added to a 40.00 mL gold-seed solution, and the mixture was stirred vigorously for 20 min. Surplus gold seeds were removed by centrifugation at a speed of 6500 rpm for 15 min. The obtained reddish precipitate was gold-seed-decorated SiNRs and was redispersed in 10.00 mL of water for the gold-shell growth process. In the gold-shell growth process, 4.00 mL of 1% HAuCl4 solution and 0.025 g of K2CO3 were added to 90.00 mL of water. The mixture was stirred until it turned to light yellow or colorless. Then, 10.00 mL of a gold-seed-decorated SiNR solution, 1.00 mL of 0.5 M hydroxylamine hydrochloride, and 1.00 g of PVP were sequentially added to the growth solution. After overnight reaction, the solution was centrifuged at a speed of 6500 rpm for 15 min and was washed 3 times with water. Finally, the obtained GNP-SiNRs were suspended into 10 mL of water and stored at 4 °C for use in the future. The size of the GNPs that decorated the SiNR’s surface can be adjusted by adding different amounts of 1% HAuCl4 (0, 2, 4, or 6 mL).
Preparation of GNP-SiNR-Ab1 and GNP-Ab1 Conjugates
GNP-SiNR-Ab1 and GNP-Ab1 conjugates were prepared according to the reported methods with slight modifications.60 (Please see the preparation details in the Supporting Information.)
Analytical Procedure
Lateral-flow strip biosensors (LFSB) were prepared according to the reported procedure with minor modifications.60 (Please see the preparation details in the Supporting Information.) The assay was performed by dipping the LFSB in a 1.50 mL microcentrifuge tube containing the desired concentration of rabbit IgG in 0.10 mL of running buffer (PBST with 1% BSA). The test and control zones could be evaluated visually within 20 min. The intensities of the test line and the control line were measured using a strip reader, and the results were further analyzed using the GoldBio strip-reader software.
Results and Discussion
GNP-Decorated SiNRs as Colored Reagents in the LFSB
Silica-based nanomaterials (nanoparticles, nanorods, and nanowires) have shown great promise in various fields due to the nanomaterials’ unique physical and chemical stability as well as their well-established surface modification.61,62 In the current study, silica nanowires (SiNWs) and nanorods were used as substrates to coat GNPs due to the larger surface area per rod or wire compared to that per nanoparticle. The synthesized GNP-SiNWs and GNP-SiNRs were used as labels for the lateral-flow assays. The mobility of GNP-SiNWs was much slower than that of GNP-SiNRs on the nitrocellulose membrane due to the large size of the SiNWs. (The length of SiNWs is up to tens of micrometers; results not shown.) Therefore, we chose GNP-SiNRs, which have a dark purple color and better mobility, as the colored reagents.
Preparation and Characteristics of GNP-Decorated SiNRs (GNP-SiNRs)
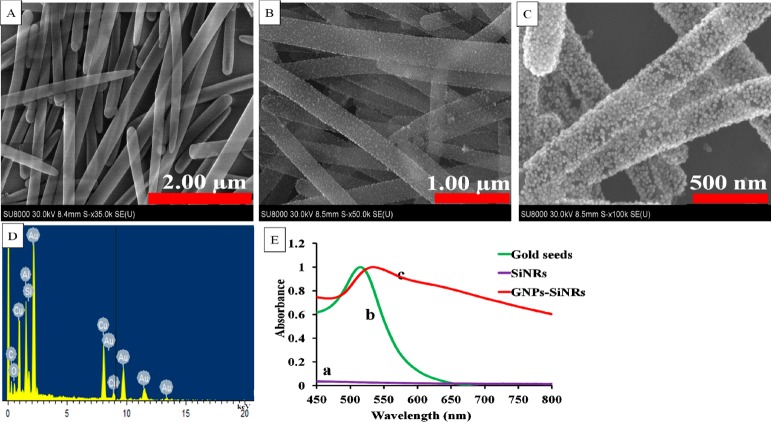
A two-step deposition process involving gold-seed deposition and seed growth was used to prepare the GNP-SiNRs. SiNRs with a length varying from 3.4 to 7.0 μm (Figure 2A) were used as the substrate to load numerous GNPs. Gold seeds were deposited on the SiNR surface by simply mixing GNP and SiNR solutions for 20 min. Figure 2B presents the typical SEM image of the gold-seed-loaded SiNRs. One can see that the gold seeds with a diameter of 9.7 ± 1.6 nm are monodispersed on the SiNR surface. The gold-seed-decorated SiNRs were then added to a gold growth solution to form a uniform GNP layer. Figure 2C shows the SEM image of GNP-decorated SiNRs after the GNP growth process. A layer of GNPs was coated on the SiNR surface, and the density of GNPs was much higher than the gold-seed-decorated SiNRs. To further identify the formation of the GNP layer on the SiNR surface, element analysis was performed by the EDS technique. A strong peak for the gold signal was observed in the EDS spectra of GNP-SiNRs, indicating that GNPs were successfully loaded on the SiNRs (Figure 2D). Figure 2E presents the UV–vis absorption spectra of the GNP-SiNR suspension, gold-seed solution, and SiNR suspension. No UV–vis absorption (Figure 2E, a) was observed for the SiNR solution while a typical surface plasmon resonance (SPR) absorption peak at around 514 nm of gold-seed solution was observed (Figure 2E, b). However, GNP-SiNRs showed a red-shifted SPR band in the near-infrared region compared to that of the gold seeds (Figure 2E, c).
Figure 2.
SEM images of (A) SiNRs, (B) gold-seed-decorated SiNRs, and (C) the formation of the GNP layer on the SiNR surface, (D) a representative EDS spectra of GNP-SiNRs, and (E) UV–vis spectra of SiNRs (a), gold seeds (b), and GNP-SiNRs (c).
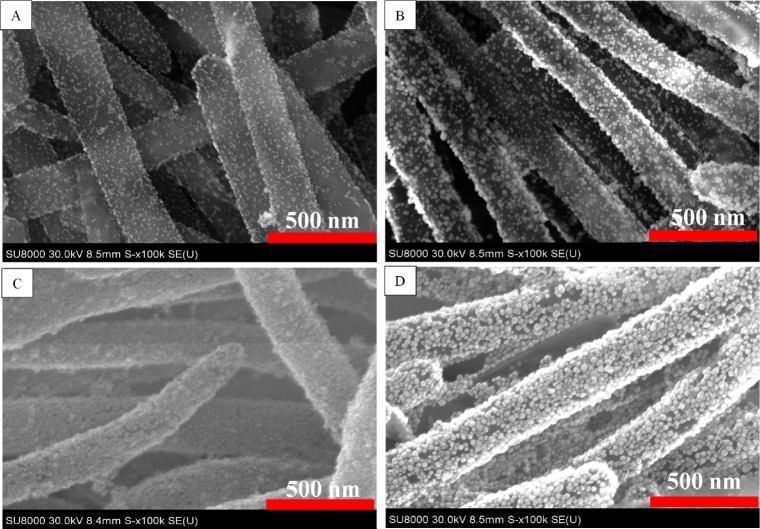
We studied the effect of the HAuCl4 concentration in the seed growth solution on the GNP size and coverage on the SiNR surface (Figure 3). Without the addition of a gold precursor (HAuCl4) in the growth solution, the GNP size (9.7 ± 1.6 nm) did not change, and GNPs were evenly positioned on the SiNR surface (Figure 3A). By adding 2 mL of 1% HAuCl4, gold seeds grew to bigger GNPs with a size of 16.7 ± 2.4 nm (Figure 3B). In the case of 4 and 6 mL of 1% HAuCl4 addition to the growth solution, the SiNR surface was covered with a layer of GNPs (Figure 3C–D). However, a large number of free GNPs was synthesized when 6 mL of 1% HAuCl4 solution was added. Therefore, in the following lateral-flow immunoassay application, GNP-SiNR synthesized from the addition of 4 mL of 1% HAuCl4 in the growth solution was used as the colored reagent. On the basis of the surface area of a SiNR (diameter: 200 nm; length: 3.4 μm) and cross section area of a GNP (diameter: 16.7 nm), it was estimated that there were around 10 000 GNPs coated on a single silica nanorod.
Figure 3.
SEM images of GNP-SiNRs by adding (A) 0, (B) 2, (C) 4, and (D) 6 mL of 1% HAuCl4 in the gold growth solution.
GNP-SiNR-Label-Based LFSB
The GNP-SiNRs were, thus, used as labels to fabricate the LFSB. Rabbit IgG was used as model target to demonstrate the proof-of-concept. Figure 1 schematically illustrates the LFSB’s configuration and measuring principle. The LFSB consisted of a sample pad, a conjugate pad, an absorption pad, and a nitrocellulose membrane (test line and control line; Figure 1A). All the components were assembled on a common-adhesive backing layer. Goat antirabbit IgG Ab1 was conjugated with GNP-SiNRs, and the Ab1-GNP-SiNR conjugates were dispensed on the conjugate pad. Goat antirabbit IgG Ab1 was also used as the capture antibody and was dispensed on the test zone of the nitrocellulose membrane. Mouse antigoat IgG Ab2 was used as the secondary antibody and was immobilized on the control zone of the nitrocellulose membrane, which was 2 mm behind the test zone (Figure 1B). During the assay, the LFSB was dipped into a test tube, and the sample solution moved up by capillary force. The Ab1-GNP-SiNRs conjugates were rehydrated and released from the conjugate pad. The binding between Ab1 in Ab1-GNP-SiNR conjugates and rabbit IgG (target) occurred, and the formed complexes (IgG-Ab1-GNPs-SiNRs) continued to migrate along the membrane. When reaching the test zone, the complexes were captured by the antibody on the test zone via the second immunoreaction, resulting in the accumulation of GNP-SiNRs on the test zone. A dark-purple band was observed, and the color intensity of the test band was directly proportional to the amount of analyte (IgG) in the sample solution. The solution continued to flow until it passed through the control zone where the excess Ab1-GNP-SiNRs conjugates were captured by the secondary antibody (antigoat IgG Ab2) to produce a second dark-purple band (Figure 1C, right). In the absence of the target, only the band on the control zone was observed, and no band was observed in the test zone. In this case, the band in the control zone (control line) showed that the LFSB was working properly (Figure 1C, left). Quantitative analysis was achieved by reading the test-line intensities with a portable strip reader. The more analytes are present in the sample, the more conjugates would be captured on the test zone, leading to the increased signal.
To confirm the signal amplification of the GNP-SiNRs, the responses of the sample solutions at three concentration levels (0, 1.0, and 5.0 ng mL–1 IgG) on the GNP-SiNR-based LFSB were compared with the GNP-based LFSB. Figure 4 presents the photo images of the LFSBs after the assays were complete. When rabbit IgG was absent in the sample solutions, neither of the two LFSBs showed a response on the test zones (Figure 4A). No test line could be observed from the GNP-based LFSB in the presence of 1.0 ng mL–1 rabbit IgG (Figure 4B, left) while there was a visible test line on the GNP-SiNR-based LFSB (Figure 4B, right). As shown in Figure 4C, the intensity of the test line on the GNP-SiNR-based LFSB in the presence of 5.0 ng mL–1 rabbit IgG was significantly higher than that of the GNP-based LFSB which exhibited a very weak response. Such dramatic signal enhancement on the GNP-SiNR-based LFSB is mostly due to the large surface area of the SiNRs where numerous GNPs were loaded. The number of the captured GNPs per antibody–antigen binding on the GNP-SiNR-based LFSB would be much higher than that of the GNP-based LFSB. In addition, the antibody density on the Ab1-GNP-SiNR conjugates would be higher than that of the Ab1-GNP conjugates. The immunoreaction efficiency on the GNP-SiNR-based LFSB was, thus, higher than that for the GNP-based LFSB with a short assay time.
Figure 4.
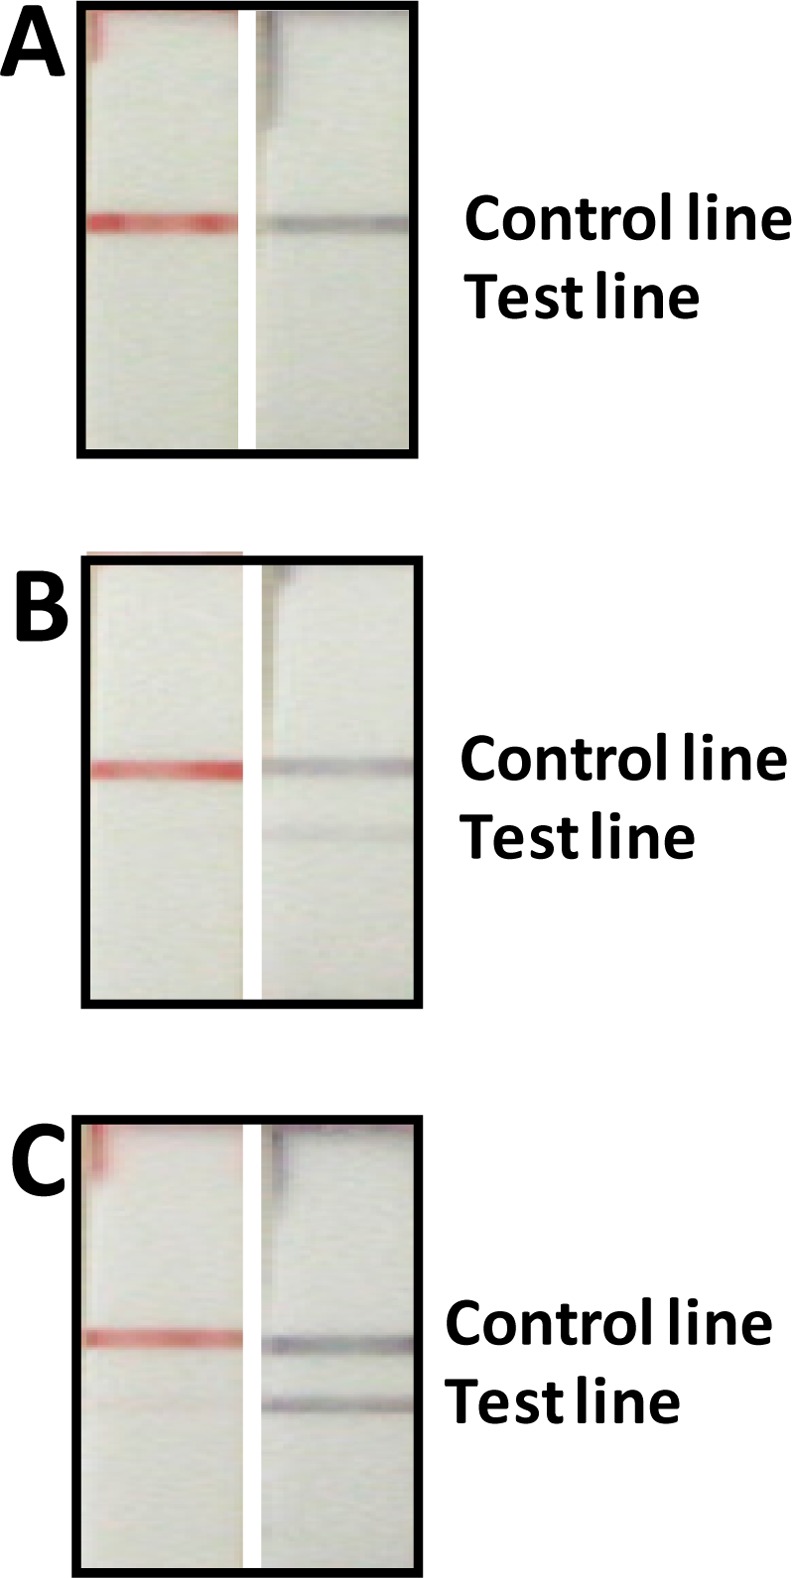
Photo images of the GNP-based LFSBs (left) and the GNP-SiNR-based LFSBs (right) in the presence of different concentrations of rabbit IgG: (A) 0 ng mL–1, (B) 1.0 ng mL–1, and (C) 5.0 ng mL–1.
Optimization of Experimental Parameters
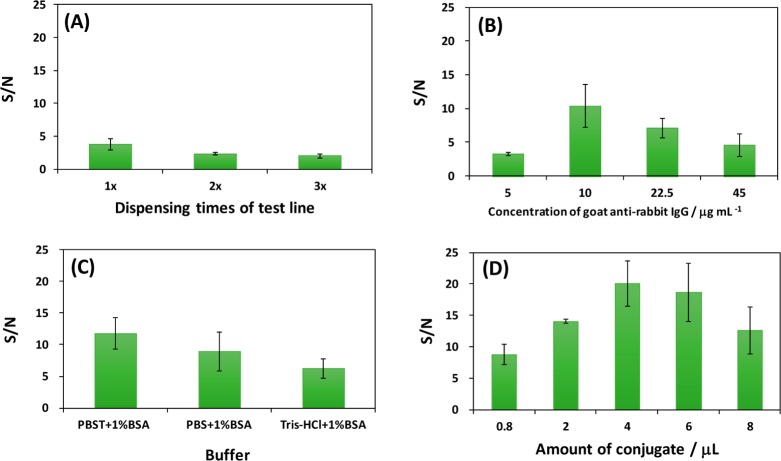
The amount of capture Ab1 on the LFSB test zone affects the LFSB response. Figure 5A presents the effect for the capture Ab1 amount on the signal-to-noise (S/N) ratio of the LFSB. The amount of Ab1 on the test zone was determined by the dispensing cycles of the Ab1. The S/N ratio was the highest for one dispensing cycle of 1.2 mg mL–1 (8 × 10⁻⁶ mol L–1) Ab1 on the test zone. The decreased S/N with more dispensing cycles resulted from the higher background signal. Therefore, one dispensing cycle (around 0.3 μL of solution) was used as the optimal condition in the following experiments.
Figure 5.
(A) Effect of dispensing cycles of Ab1 on the LFSB’s S/N ratio. Loading volume of Ab1-GNP-SiNR conjugates: 2 μL; Ab1 concentration in the conjugate: 5 μg mL–1; running buffer: PBST (1% BSA). (B) Effect of Ab1 concentration in the conjugate solution on the LFSB’s S/N ratio. Dispensing cycle of Ab1: 1 cycle; loading volume of Ab1-GNP-SiNR conjugates: 2 μL; running buffer: PBST (1% BSA). (C) Effect of running buffer components on the LFSB’s S/N ratio. Dispensing cycle of Ab1: 1 cycle; loading volume of Ab1-GNP-SiNR conjugates: 2 μL; Ab1 concentration in the conjugate: 10 μg mL–1. (D) Effect for the loading volume of Ab1-GNP-SiNR conjugates on the LFSB’s S/N ratio. Dispensing cycle of Ab1: 1 cycle; Ab1 concentration in the conjugate: 10 μg mL–1; running buffer: PBST (1% BSA). Rabbit IgG concentration: 1.0 ng mL–1.
The amount of Ab1 on the GNP-SiNRs surface affects the LFSB’s immunoreaction efficiency and sensitivity. We optimized the Ab1 concentration in the conjugation solution. The LFSB’s S/N ratio increased up to 10 μg mL–1 (∼6.7 × 10⁻⁸ mol L–1) Ab1 in the conjugation solution; a further concentration increase caused a decreased S/N ratio (Figure 5B). The decrease of S/N ratio was due to the decreased immunoreaction efficiency when a higher amount of antibody was conjugated on the SiNRs. On the basis of the optimal concentration of Ab1 antibodies for preparing the conjugate, there were approximately 11 000 antibodies absorbed on a single silica nanorod. Concentrations exceeding the optimal condition may cause the steric hindrance of the antibodies absorbed on the surface and consequently result in the decreased antibody–antigen binding efficiency. Since the antibodies are polyclonal antibodies, which could recognize multiple epitopes on one antigen, the molar ratio of antibody–antigen is at least 1:1. As a result, 10 μg mL–1 Ab1 antibodies was employed to prepare the Ab1-GNP-SiNR conjugates in the following experiments.
The running buffer’s composition is one of the main factors in developing a biosensor because it has a significant impact on the efficiency of antibody–antigen binding and the elimination of nonspecific adsorption. Several buffers, including PBS (1% BSA), PBST (1% BSA), and Tris-HCl (1% BSA), were tested, and the results are shown in Figure 5C. The highest S/N ratio was obtained with the PBST (1% BSA) buffer. Therefore, a PBST (1% BSA) buffer was selected for the experiments.
The band intensities depended on the Ab1-GNP-SiNR conjugates captured on the test and control zones which, in turn, corresponded to the amount of conjugates on the conjugate pad. To obtain a maximum response using a minimal amount of Ab1-GNP-SiNR conjugates, the Ab1-GNP-SiNRs on the conjugate pad were optimized by increasing the volume of the Ab1-GNP-SiNR conjugates loaded on the conjugate pad. Figure 5D displays the histogram for the LFSB’s S/N ratio with an increasing volume of conjugate solution (0.8 to 8 μL). It can be seen that the S/N ratio increased up to 4 μL; a further volume increase caused a decreased S/N ratio. The S/N ratio loss at a high volume may be attributed to the saturation of signal intensity and an increased nonspecific adsorption. Therefore, 4 μL of Ab1-GNP-SiNR conjugate was employed as the optimal volume for the entire study.
Analytical Performance
Under optimal experimental conditions, we examined the performance of the GNP-SiNR-based LFSB with different concentrations of rabbit IgG. Figure 6 presents the typical photo images (right) and the corresponding optical response recorded with a portable strip reader in the presence of different concentrations of rabbit IgG (0 to 2.0 ng mL–1). There was no test line observed on the LFSB test zone in the absence of rabbit IgG (control), indicating negligible nonspecific adsorption under the optimized experimental condition. The test line was quite visible, even at 0.05 ng mL–1 rabbit IgG which can be used as the threshold for the visual determination (yes/no) of rabbit IgG without instrumentation. In addition, quantitative detection was performed by recording the peak areas of the test bands with the aid of a portable strip reader (Figure 7). It was observed that the peak area increased with an increase in the rabbit IgG concentration until reaching a plateau at 100 ng mL–1. The saturation of the calibration curve was caused by the physical size of the surface area of the test line limiting the number of GNP-SiND that could bind. On the basis of the response of 100 ng mL–1 (∼6.7 × 10⁻¹⁰ mol L–1) of rabbit IgG, the molar ratio of capture antibody (test line)/rabbit IgG (target)/report antibody (GNP-SiNR-Ab) was estimated to be 10:1:4. The peak area had a linear correlation with the rabbit IgG concentration in the lower concentration range (0.05–2.0 ng mL–1) as shown in the inset of Figure 7. The calibration equation was determined to be peak value A = 188.76C + 61.908 with a correlation coefficient of 0.9941, where A and C represent the peak area and the concentration of rabbit IgG, respectively. The detection limit was estimated to be 0.01 ng mL–1 (∼6.7 × 10⁻¹⁴ mol L–1) from 3 times the standard deviation corresponding to the blank sample detection (S/N = 3). Compared to other labels for visual detection, the detection limit of GNP-SiNR-based LFSB is comparable with that of the fluorescent microspheres,63 almost 50-fold lower than the GNP-based LFSB,64 1000-fold lower than the blue-colored latex particle-based LFSB,65 and 5 orders of magnitude improved in comparison with a competitive liposome-based LFSB.66
Figure 6.
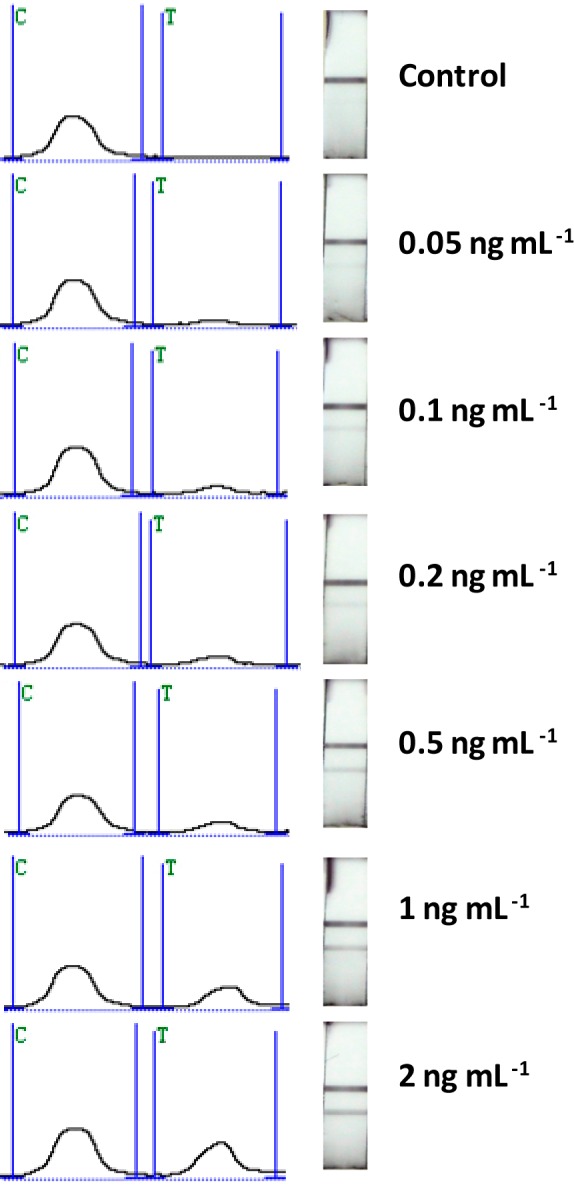
Typical response curves and photo images for the LFSB with an increasing rabbit IgG concentration (0.05 to 2.0 ng mL–1).
Figure 7.
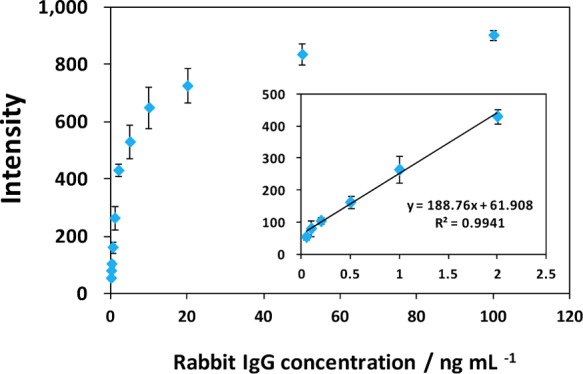
Calibration curve of the LFSB. The inset shows the linear response for rabbit IgG. Each data point represents the average value obtained from three different measurements.
Selectivity and Reproducibility
Selectivity and reproducibility are two important parameters to evaluate a biosensor’s performance. The selectivity of the GNP-SiNR-based LFSB was assessed by testing the responses of other proteins (thrombin, CEA, human IgG, and PDGF-BB) at 100 ng mL–1, as well as the mixtures of rabbit IgG (1 ng mL–1) and the nontarget protein (100 ng mL–1). The histogram of the responses and the corresponding photo images are shown in Figure S1 (Supporting Information). Excellent selectivity for rabbit IgG, over other proteins, was achieved. The sensitive and specific response was coupled with high reproducibility. The reproducibility of the GNP-SiNR-based LFSB was studied by testing the sample solutions at different concentration levels (0, 0.5, 5, and 50 ng mL–1 rabbit IgG). Samples from the same batch preparation and at the same concentration level were tested 6 times with 6 different LFSBs. Similar responses were obtained at the same concentration level. (See the histogram of the responses in Figure S2, Supporting Information.) The relative standard deviations for the signals were 1.80%, 6.63%, 3.93%, and 5.49% for 50, 5, 0.5, and 0 ng mL–1 rabbit IgG, respectively, indicating an excellent reproducibility.
Conclusions
We have developed a highly sensitive lateral-flow strip biosensor (LFSB) using GNP-SiNRs as labels. The LFSB detection limit was lowered 50 times compared to the traditional GNP-based lateral-flow assay. As demonstrated here, the significance of this work is to introduce a new type of nanolabel for signal enhancement on the lateral-flow immunoassay. In addition, the GNP-SiNRs can be used as nanolabels for nucleic acid and other biological molecular detection with high sensitivity. Future work will aim to detect cancer biomarkers (proteins and nucleic acids) in human blood or serum.
Acknowledgments
This research was supported by the National Cancer Institute (Grant number: R21CA137703) and the National Institute of General Medicine (NIGMS; Grant number: 5P30 GM103332). Its contents are solely the responsibility of the authors and do not necessarily represent the official views of the NIH. G. Liu acknowledges the financial support from the Open Foundation of National Engineering Research Center of JUNCAO Technology, China (No. JCJJ13016). J.X. Zhao acknowledges financial support from the National Science Foundation (Grant numbers: CHE 0911472 and CHE 0947043).
Supporting Information Available
Additional information as noted in text. This material is available free of charge via the Internet at http://pubs.acs.org/.
Author Contributions
∥ H. Xu and J. Chen contributed equally to this work.
The authors declare no competing financial interest.
Funding Statement
National Institutes of Health, United States
Supplementary Material
References
- Torres-Chavolla E.; Alocilja E. C. Biosens. Bioelectron. 2009, 24, 3175–3182. [DOI] [PMC free article] [PubMed] [Google Scholar]
- Nam J.-M.; Thaxton C. S.; Mirkin C. A. Science 2003, 301, 1884–1886. [DOI] [PubMed] [Google Scholar]
- Wang J.; Cao Y.; Xu Y.; Li G. Biosens. Bioelectron. 2009, 25, 532–536. [DOI] [PubMed] [Google Scholar]
- Zhou W.-H.; Zhu C.-L.; Lu C.-H.; Guo X.; Chen F.; Yang H.-H.; Wang X. Chem. Commun. 2009, 6845–6847. [DOI] [PubMed] [Google Scholar]
- Wang H.; Wu Z.; Tang L.; Yu R.; Jiang J. Nucleic Acids Res. 2011, 39, e122. [DOI] [PMC free article] [PubMed] [Google Scholar]
- Akter R.; Kyun Rhee C.; Aminur Rahman M. Biosens. Bioelectron. 2014, 54, 351–357. [DOI] [PubMed] [Google Scholar]
- Du S.; Guo Z.; Chen B.; Sha Y.; Jiang X.; Li X.; Gan N.; Wang S. Biosens. Bioelectron. 2014, 53, 135–141. [DOI] [PubMed] [Google Scholar]
- Yu Q.; Zhan X.; Liu K.; Lv H.; Duan Y. Anal. Chem. 2013, 85, 4578–4585. [DOI] [PubMed] [Google Scholar]
- Xia H.; Mathew B.; John T.; Hegab H.; Feng J. Biomed. Microdevices 2013, 15, 519–530. [DOI] [PubMed] [Google Scholar]
- Armani A. M.; Kulkarni R. P.; Fraser S. E.; Flagan R. C.; Vahala K. J. Science 2007, 317, 783–787. [DOI] [PubMed] [Google Scholar]
- Nie S.; Emory S. R. Science 1997, 27553031102–1106. [DOI] [PubMed] [Google Scholar]
- Pang Y.; Gordon R. Nano Lett. 2011, 121402–406. [DOI] [PubMed] [Google Scholar]
- Sorgenfrei S.; Chiu C.-Y.; Gonzalez R. L.; Yu Y.-J.; Kim P.; Nuckolls C.; Shepard K. L. Nat. Nanotechnol. 2011, 6, 126–132. [DOI] [PMC free article] [PubMed] [Google Scholar]
- Srinivas R. L.; Chapin S. C.; Doyle P. S. Anal. Chem. 2011, 83, 9138–9145. [DOI] [PMC free article] [PubMed] [Google Scholar]
- Akter R.; Rahman M. A.; Rhee C. K. Anal. Chem. 2012, 84, 6407–6415. [DOI] [PubMed] [Google Scholar]
- Lin D.; Wu J.; Ju H.; Yan F. Biosens. Bioelectron. 2013, 45, 195–200. [DOI] [PubMed] [Google Scholar]
- Shiddiky M. J. A.; Kithva P. H.; Rauf S.; Trau M. Chem. Commun. 2012, 48, 6411–6413. [DOI] [PubMed] [Google Scholar]
- Wang J.; Han H.; Jiang X.; Huang L.; Chen L.; Li N. Anal. Chem. 2012, 84, 4893–4899. [DOI] [PubMed] [Google Scholar]
- Zhang J.; Yuan Z.-F.; Wang Y.; Chen W.-H.; Luo G.-F.; Cheng S.-X.; Zhuo R.-X.; Zhang X.-Z. J. Am. Chem. Soc. 2013, 135, 5068–5073. [DOI] [PubMed] [Google Scholar]
- Qiu L.-P.; Wu Z.-S.; Shen G.-L.; Yu R.-Q. Anal. Chem. 2011, 83, 3050–3057. [DOI] [PubMed] [Google Scholar]
- Lu L.; Liu B.; Zhao Z.; Ma C.; Luo P.; Liu C.; Xie G. Biosens. Bioelectron. 2012, 33, 216–221. [DOI] [PubMed] [Google Scholar]
- Zhang Z.-Z.; Zhang C.-Y. Anal. Chem. 2012, 84, 1623–1629. [DOI] [PubMed] [Google Scholar]
- Posthuma-Trumpie G.; Korf J.; Amerongen A. Anal. Bioanal. Chem. 2009, 393, 569–582. [DOI] [PubMed] [Google Scholar]
- Wang Y.-K.; Yan Y.-X.; Ji W.-H.; Wang H.-A.; Li S.-Q.; Zou Q.; Sun J.-H. J. Agric. Food Chem. 2013, 61, 5031–5036. [DOI] [PubMed] [Google Scholar]
- Parolo C.; Medina-Sanchez M.; de la Escosura-Muniz A.; Merkoci A. Lab Chip 2013, 13, 386–390. [DOI] [PubMed] [Google Scholar]
- Hou S.-Y.; Hsiao Y.-L.; Lin M.-S.; Yen C.-C.; Chang C.-S. Talanta 2012, 99, 375–379. [DOI] [PubMed] [Google Scholar]
- Mao X.; Ma Y.; Zhang A.; Zhang L.; Zeng L.; Liu G. Anal. Chem. 2009, 81, 1660–1668. [DOI] [PubMed] [Google Scholar]
- Shyu R.-H.; Shyu H.-F.; Liu H.-W.; Tang S.-S. Toxicon 2002, 40, 255–258. [DOI] [PubMed] [Google Scholar]
- López-Marzo A. M.; Pons J.; Blake D. A.; Merkoçi A. Biosens. Bioelectron. 2013, 47, 190–198. [DOI] [PubMed] [Google Scholar]
- Suárez-Pantaleón C.; Wichers J.; Abad-Somovilla A.; van Amerongen A.; Abad-Fuentes A. Biosens. Bioelectron. 2013, 42, 170–176. [DOI] [PubMed] [Google Scholar]
- Li Z.; Wang Y.; Wang J.; Tang Z.; Pounds J. G.; Lin Y. Anal. Chem. 2010, 82, 7008–7014. [DOI] [PubMed] [Google Scholar]
- Zou Z.; Du D.; Wang J.; Smith J. N.; Timchalk C.; Li Y.; Lin Y. Anal. Chem. 2010, 82, 5125–5133. [DOI] [PubMed] [Google Scholar]
- Li X.; Lu D.; Sheng Z.; Chen K.; Guo X.; Jin M.; Han H. Talanta 2012, 100, 1–6. [DOI] [PubMed] [Google Scholar]
- Liu C.; Jia Q.; Yang C.; Qiao R.; Jing L.; Wang L.; Xu C.; Gao M. Anal. Chem. 2011, 83, 6778–6784. [DOI] [PubMed] [Google Scholar]
- Fang Z.; Ge C.; Zhang W.; Lie P.; Zeng L. Biosens. Bioelectron. 2011, 27, 192–196. [DOI] [PubMed] [Google Scholar]
- Chao C.-H.; Wu C.-S.; Huang C.-C.; Liang J.-C.; Wang H.-T.; Tang P.-T.; Lin L.-Y.; Ko F.-H. Microelectron. Eng. 2012, 97, 294–296. [Google Scholar]
- Anfossi L.; Baggiani C.; Giovannoli C.; D’Arco G.; Giraudi G. Anal. Bioanal. Chem. 2013, 405, 467–480. [DOI] [PubMed] [Google Scholar]
- Chou S. Analyst 2013, 138, 2620–2623. [DOI] [PubMed] [Google Scholar]
- Zeng Q.; Mao X.; Xu H.; Wang S. Am. J. Biomed. Sci. 2009, 1170–79. [Google Scholar]
- Madersbacher S.; Mian C.; Maier U.; Simak R. Eur. Urol. 1996, 30, 446–450. [DOI] [PubMed] [Google Scholar]
- Fernández-Sánchez C.; McNeil C. J.; Rawson K.; Nilsson O.; Leung H. Y.; Gnanapragasam V. J. Immunol Methods 2005, 307, 1–12. [DOI] [PubMed] [Google Scholar]
- Lee E. Y.; Kang J. H.; Kim K. A.; Chung T. W.; Kim H. J.; Yoon D. Y.; Lee H. G.; Kwon D. H.; Kim J. W.; Kim C. H.; Song E. Y. J. Immunol. Methods 2006, 308, 116–123. [DOI] [PubMed] [Google Scholar]
- Adams J.; Carder P. J.; Downey S.; Forbes M. A.; MacLennan K.; Allgar V.; Kaufman S.; Hallam S.; Bicknell R.; Walker J. J.; Cairnduff F.; Selby P. J.; Perren T. J.; Lansdown M.; Banks R. E. Cancer Res. 2000, 60, 2898–2905. [PubMed] [Google Scholar]
- Riedel F.; Zaiss I.; Herzog D.; Götte K.; Naim R.; Hörman K. Anticancer Res. 2005, 25, 2761–2766. [PubMed] [Google Scholar]
- Kapaki E.; Kilidireas K.; Paraskevas G. P.; Michalopoulou M.; Patsouris E. Neurol. Neurosurg. Psychiatry 2001, 71, 401–403. [DOI] [PMC free article] [PubMed] [Google Scholar]
- Choi D. H.; Lee S. K.; Oh Y. K.; Bae B. W.; Lee S. D.; Kim S.; Shin Y.-B.; Kim M.-G. Biosens. Bioelectron. 2010, 25, 1999–2002. [DOI] [PubMed] [Google Scholar]
- Mei Z.; Qu W.; Deng Y.; Chu H.; Cao J.; Xue F.; Zheng L.; El-Nezamic H. S.; Wu Y.; Chen W. Biosens. Bioelectron. 2013, 49, 457–461. [DOI] [PubMed] [Google Scholar]
- He Y.; Zhang S.; Zhang X.; Baloda M.; Gurung A. S.; Xu H.; Zhang X.; Liu G. Biosens. Bioelectron. 2011, 26, 2018–2024. [DOI] [PubMed] [Google Scholar]
- Tang D.; Sauceda J. C.; Lin Z.; Ott S.; Basova E.; Goryacheva I.; Biselli S.; Lin J.; Niessner R.; Knopp D. Biosens. Bioelectron. 2009, 25, 514–518. [DOI] [PubMed] [Google Scholar]
- Tanaka H.; Mitsuishi M.; Miyashita T. Langmuir 2003, 19, 3103–3105. [DOI] [PubMed] [Google Scholar]
- Tseng R. J.; Huang J.; Ouyang J.; Kaner R. B.; Yang Y. Nano Lett. 2005, 5, 1077–1080. [DOI] [PubMed] [Google Scholar]
- Chu H.; Wang J.; Ding L.; Yuan D.; Zhang Y.; Liu J.; Li Y. J. Am. Chem. Soc. 2009, 131, 14310–14316. [DOI] [PubMed] [Google Scholar]
- Minati L.; Antonini V.; Dalla Serra M.; Speranza G. Langmuir 2012, 28, 15900–15906. [DOI] [PubMed] [Google Scholar]
- Vallet-Regi M.; Balas F.; Arcos D. Angew. Chem., Int. Ed. 2007, 46, 7548–7558. [DOI] [PubMed] [Google Scholar]
- Bae S. W.; Tan W.; Hong J.-I. Chem. Commun. 2012, 48, 2270–2282. [DOI] [PubMed] [Google Scholar]
- Fan H.; Jiao F.; Chen H.; Zhang F.; Wang Q.; He P.; Fang Y. Biosens. Bioelectron. 2013, 47, 373–378. [DOI] [PubMed] [Google Scholar]
- Qi W.; Wu D.; Zhao J.; Liu Z.; Zhang W.; Zhang L.; Xu G. Anal. Chem. 2013, 85, 3207–3212. [DOI] [PubMed] [Google Scholar]
- Zhang Y.; Yuan Q.; Chen T.; Zhang X.; Chen Y.; Tan W. Anal. Chem. 2012, 84, 1956–1962. [DOI] [PMC free article] [PubMed] [Google Scholar]
- Xu S.; Hartvickson S.; Zhao J. X. Langmuir 2008, 24, 7492–7499. [DOI] [PubMed] [Google Scholar]
- Xu H.; Mao X.; Zeng Q.; Wang S.; Kawde A.-N.; Liu G. Anal. Chem. 2009, 81, 669–675. [DOI] [PubMed] [Google Scholar]
- Lin W.; Huang Y.-W.; Zhou X.-D.; Ma Y. Toxicol. Appl. Pharmacol. 2006, 217, 252–259. [DOI] [PubMed] [Google Scholar]
- Jin Y.; Kannan S.; Wu M.; Zhao J. X. Chem. Res. Toxicol. 2007, 20, 1126–1133. [DOI] [PubMed] [Google Scholar]
- Worsley G. L.; Attree S. L.; Noble J. E.; Horgan A. M. Biosens. Bioelectron. 2012, 34, 215–220. [DOI] [PubMed] [Google Scholar]
- Kawde A.; Mao X.; Xu H.; Zeng Q.; He Y.; Liu G. Am. J. Biomed. Sci. 2010, 2, 23–32. [Google Scholar]
- Birnbaum S. Anal. Biochem. 1992, 206, 168–171. [DOI] [PubMed] [Google Scholar]
- Wen H.; Borejsza-Wysocki W.; DeCory T. R.; Durst R. A. Anal. Bioanal. Chem. 2005, 382, 1217–1226. [DOI] [PubMed] [Google Scholar]
Associated Data
This section collects any data citations, data availability statements, or supplementary materials included in this article.


