

Abstract
Canonical isoforms in different databases have been defined as the most prevalent, most conserved, most expressed, longest, or the one with the clearest description of domains or post-translational modifications. In this article, we revisit these definitions of canonical isoforms based on functional genomics and proteomics evidence, focusing on mouse data. We report a novel functional relationship network-based approach for identifying the Highest Connected Isoforms (HCIs). We show that 46% of these HCIs are not the longest transcripts. In addition, this approach revealed many genes that have more than one highly connected isoforms. Averaged across 175 RNA-seq datasets covering diverse tissues and conditions, 65% of the HCIs show higher expression levels than non-highest connected isoforms (NCIs) at the transcript level. At the protein level, these HCIs highly overlap with the expressed splice variants, based on proteomic data from eight different normal tissues. These results suggest that a more confident definition of canonical isoforms can be made through integration of multiple lines of evidence, including highest connected isoforms defined by biological processes and pathways, expression prevalence at the transcript level, and relative or absolute abundance at the protein level. This integrative proteogenomics approach can successfully identify principal isoforms that are responsible for the canonical functions of genes.
Keywords: alternative splicing, major transcripts, canonical isoforms, highest connected isoforms, integrative proteogenomics
1 Introduction
In mammalian systems, more than 90% of the multi-exon genes are capable of producing multiple transcripts by alternative splicing (AS) [1, 2], which may carry out similar, different or even opposite biological functions [1–14]. The resulting splice variants greatly increase the repertoire of gene products and therefore their functional complexity. To interrogate the main functions of these gene products, significant efforts have been devoted to identifying the canonical, major or principal isoform of each gene [15–19]. However, the definition of canonical isoforms is complex and different in different databases. For example, UniProt defines the canonical isoforms as the most prevalent, most conserved, longest, or the one with clear description of domains or post-translational modifications [16]. UCSC designates the longest splice variant of a gene as the canonical isoform [20]. Rodriguez et al. defined the principal or canonical isoforms as the most conserved transcripts across related species and the ones that specify functional units in their sequences [17]. Finally, the ‘major’ transcripts have been defined by their relatively high expression level in multiple studies [18, 19]: despite the complex regulation of alternative splicing [10, 21, 22], most genes express one major transcript based on genome-scale expression data in human and mouse [15, 17–19]. Taneri et al. observed that there is a single dominant isoform per gene for 80% of genes based on full-length transcript or EST (expression sequence tag) data [15]. The ENCODE project [23] found that most genes express a major transcript at a relatively high level, even when several alternative splicing isoforms tend to be expressed simultaneously [18]. Similarly, Gonzàlez-Porta et al. revealed one dominant transcript per gene through transcriptome analysis of human tissues and cell lines and hypothesized that, although some minor transcripts may play a functional role in specific tissues, the major ones are likely to be the main contributors to the proteome [19]. One interesting finding in these studies [15, 17, 19] is that the expression-based or conservation-based principal isoforms share only a limited percentage of sequence (50~75%) with the longest isoforms, showing an inconsistency between these definitions.
The above disparate definitions of canonical isoforms (summarized in Supplementary Table S1) call for an approach that integrates multiple lines of evidence to refine the identification of canonical isoforms, which more reliably reflect the main functions of the genes. Recent developments in proteogenomics approaches allow us to harness the wealth of information available at the proteome level and apply it to the available genomic and transcriptomic information [24]. Such a proteogenomics approach has been successfully used in annotating EST databases [25], predicting novel genes [26–28], and correcting existing gene models [26]. Most relevant to this study, a proteogenomics approach can be used to correct or identify novel splice isoforms [24].
To address the challenge of identifying canonical isoforms, we report here a proteogenomics approach that integrates multiple levels of evidence, including functional relationship networks based on genomic data, transcriptomic RNA-seq data and proteomic data. At the functional relationship network level, the highest connected isoforms (HCIs) are identified based on co-functional connections with many other genes in the same biological pathways or processes. This network was built by integrating heterogeneous functional genomic data from RNA-seq, exon array, protein docking, and pseudo-amino acid composition [29]. We performed a genome-scale analysis of the local isoform-level networks for 3427 validated multi-isoform mouse genes (based on RefSeq database v37.2), and identified the HCIs for each multi-isoform gene. At the transcript expression level, we found a high level of overlap between the HCIs and the relatively highly expressed splice variants. At the protein level, we identified the expressed isoforms to validate the canonical isoforms that were identified based on functional relationship networks and the transcriptomic data. We found significant overlap across the canonical isoforms identified through these three levels of analysis.
2 Materials and methods
2.1 The functional network approach for identifying canonical isoforms
Functional approaches have been shown to be promising in understanding e.g. gene functions, networks and gene-disease relationships [30–34]. In this work, functional networks will be used to help identify canonical isoforms. The rationale in identifying canonical isoforms that are representative of their major gene functions is that they should be supported by multiple levels of functional genomics and proteomics evidence. The network-based approach anticipates that these isoforms participate in important biological pathways and processes, and therefore are expected to have more functional relationships with other transcripts/proteins. To analyze such functional relationships, we utilized the genome-wide functional relationship network at the isoform level for the mouse, which was generated through Bayesian network-based multiple instance learning [29, 35–39]. This network integrates heterogeneous genomic data at the isoform level, encompassing 11 RNA-seq datasets (146 samples), 52 exon array datasets (1273 samples), 1 protein docking dataset and 1 amino acid composition dataset. For each RNA-seq or exon array dataset, the correlation between isoforms was calculated to be used as an isoform-pair feature; each score in the protein docking data represents how likely two protein isoforms are to bind each other; and the pseudo-amino acid composition data reflect how similar two proteins are in terms of both percent composition and physiochemical properties of amino acids [29]. The algorithm is an iterative method, in which we used a Bayesian classifier. Briefly, Each isoform pair can be represented by an n-dimensional feature vector (E1,E2…En). With the Bayesian classifier, the probability that an isoform pair belonging to the positive class can be calculated using the following formula:
| (1) |
where P(y=1) is the prior probability for a sample (isoform pair) to be positive, P(Ei|y = 1), i = 1,2,…,n, is the probability of the ith feature given the observed value, conditioned that the isoform pair is functionally related and C is a constant normalization factor. The functionally related isoform pairs are identified and used in the next iteration to train the model until convergence. In this network, each node represents an isoform, and the connection between two isoforms (of different genes) represents the probability ranging from 0 to 1 that two isoforms work in the same biological process/pathway.
To quantify the likelihood that each isoform is functionally related to other isoforms through participating the same biological process/pathway, we defined an average functional relationship (AFR) score, which is calculated as the average of the functional relationships between the isoform and its top connected neighbors (Figure 1A). The AFR score in this work is calculated using a local network containing the top 25 functionally related neighbors, thereby avoiding weak and noisy functional connections. The probabilistic AFR score ranges from 0 to 1. Then, within each multi-isoform gene in the mouse (3427 validated in the RefSeq database, version 37.2), we calculated an AFR score for each of its isoforms and defined the one with the highest AFR score as the highest connected isoform (HCI) of this gene. The remaining isoforms are treated as non-highest connected isoforms (NCIs).
Figure 1.

Illustration of how to identify highly connected isoforms (HCI) based on the functional relationship network, using the Aanat gene as an example. A. In the functional relationship network, a single node represents an isoform and the connection between two isoforms represents the probability that they work in the same biological process or pathway. The edge width represents the functional relationship probability between two isoforms. The average functional relationship (AFR) score is calculated as the average connection of the top interactions for each isoform. The AFR of the two isoforms NM_009591.3 and NR_033223.1 of Aanat are 0.955 and 0.078, respectively. Therefore, NM_009591.3 was selected as the HCI of Aanat. The ratio of the maximal AFR score to the minimal AFR score of each gene was calculated. B. Protein domain information based on Pfam for NM_009591.3 and NR_033223.1. NM_009551.3, the shorter transcript, has an active acetyltransferase domain, while the longer transcript NR_033223.1 has no domain identified.
We expected that the AFR scores (representing how ‘highly connected’ the isoforms are) would be quite different between HCI and corresponding NCIs for some genes, while for other genes these values are similar. To quantify such difference between isoforms of a multi-isoform gene, we calculated the ratio of the maximal to minimal AFR score of isoforms using the following formula:
| (2) |
In the above equation, a higher ratio r represents more difference between the ‘highly functionally connected’ isoform and the relatively less functionally connected isoforms and vice versa.
2.2 Processing heterogeneous RNA-seq data
117 mouse RNA-seq datasets (containing 811 experiments) from the Sequence Read Archive (SRA) database were initially downloaded on May 1, 2012. These data cover a wide range of experimental conditions and different tissues. For each experiment, TopHat (v2.0.051) [40, 41] was used to align the reads against the mouse reference genome (NCBI gene build, version 37.2). The expression levels of transcripts in terms of FPKM (Fragments Per Kilobase of exon per Million fragments) were estimated using Cufflinks (v2.0.0) [40]. For quality control, experiments with fewer than 10 million reads or covering less than 50% of the genes were removed. We finally obtained 41 datasets with 321 experiments with each dataset containing at least 4 experiments. Within each dataset, transcripts with missing values occurring in more than 50% experiments were removed for ensuring accurate expression value estimation. Of the 41, 11 RNA-seq datasets were used to build the functional relationship network at the splice isoform level for the mouse in our previous study [29]. The remaining 30 datasets were used as an independent test set for analyzing the expression behaviors of HCIs and NCIs in this study (Supplementary File S1 for the full description of the RNA-seq datasets used, Supplementary Figure S1 for the number of expressed transcripts).
2.3 Proteomic data from eight normal tissues of mouse
The proteins expressed in eight normal mouse tissues were generated from publicly available data. Mass-spectrometric mzXML files for breast (PAe000416), liver (PAe000297), and brain (PAe000359, PAe000370, PAe000373 and PAe000380) were downloaded from PeptideAtlas [42]. The mzXML files for the normal samples from these datasets were searched against our custom built ECgene database using X!Tandem software [43]; the search parameters used were the same as those of the original studies. The custom ECgene database was constructed by combining Ensembl and ECgene databases, as described previously [44]. Peptides identified with FDR < 1% were used to identify the proteins. The splice variant protein identifications were generated according to our published peptide to protein integration method [44]. The steps involved in the integration algorithm are as follows:
Peptides (FDR <1%) are ordered by the number of spectra matching each peptide.
The peptide with the largest number of matching spectra is selected.
Proteins containing this peptide were ranked by decreasing number of total distinct peptides identified, decreasing number of total spectra, increasing expect value, and then increasing protein length.
The highest ranking protein was selected to be included in the final integrated protein list; if a tie exists, preference was given to an Ensembl protein over an ECgene protein.
All other peptides contained within this protein were removed from the peptide list.
Steps 3–5 were repeated until no peptides remain in the peptide list.
Only the splice variant proteins identified from the normal tissue samples were used for this study.
Breast
Whiteaker et al. [45] performed LC-MS/MS of tumor and normal mammary tissues from a conditional HER2/neu-driven mouse model of breast cancer. The original study reported that cancerous and normal tissues were harvested from 5 doxycycline-inducible, MMTV-rtTA/TetO-NeuNT mice and 5 normal mice, respectively, and processed separately into tissue lysates. Two pools were prepared, containing equal mass of protein, and digested by trypsin for mass spectrometric analysis. This dataset was utilized by Menon and Omenn [46] in our early studies of differential expression of splice isoforms in specific pathways in HER2/neu-driven breast cancers..
Liver
Shi et al. [47] reported a large-scale analysis of mouse liver tissue comprising a novel fractionation approach and high-accuracy mass spectrometry techniques. Fractions enriched for soluble and membrane proteins from frozen tissue were separated by one-dimensional electrophoresis followed by LC-MS/MS on the hybrid linear ion trap (LTQ)-Orbitrap mass spectrometer.
Brain
The original study was conducted on mitochondrial, microsomal, cytoplasmic and nuclear brain fractions using LCQ Deca XP mass-spectrometry (PAe000359, PAe000370, PAe000373 and PAe000380 at http://www.peptideatlas.org/repository/). A single list of distinct splice variants expressed in the brain was generated from the proteins identified from the mass-spectrometric data analyses of all four brain fractions.
The splice variant proteins expressed in adrenal, colon, eye, heart and spleen were extracted from the protein list provided in the supplementary material of a published study [48]. The original study used SILAC-labeled mice that were grown for more than two generations on a diet containing heavy lysine (Lys6-13C6) as their sole source of this amino acid, leading to complete labeling of their proteome [48]. Protein extracts from all SILAC-labeled tissues were combined to create a heavy spike-in protein standard; this standard was mixed with each of the unlabeled tissues in equal amounts [48]. LC-MS/MS measurements were performed on an Easy-nano-LC coupled to an LTQ Orbitrap XL mass spectrometer. The SILAC labeled to unlabeled ratio values were used for relative comparison of the protein expression across the different tissues [48]. We extracted the proteins identified for adrenal, colon, eye, heart and spleen tissues when the labeled to unlabeled ratio was more than zero; these five tissues were chosen among the 28 tissues investigated in the study, as there were at least three genes with more than one isoform expressed. The numbers of identified protein isoforms in the 8 tissues were shown in Supplementary Figure S1. For this study, we considered only the proteins whose parent genes are known to have multiple isoforms according to the NCBI validated isoform annotations.
3 Results
3.1 Identify the highest connected isoforms in the mouse based on functional relationships
In the functional relationship network, a node represents an isoform, and the edge between nodes represents the probability (ranging from 0 to 1) that two isoforms work in the same biological process or pathway based on integrating heterogeneous experimental evidence. For each individual isoform of a multi-isoform gene, all of its functional connections are sorted in decreasing order first. Then, we calculated an average functional relationship (AFR) score as the average of the functional connection between the isoform and its top connected neighbors (Figure 1A). The reason that we chose only the top connected isoforms is to avoid noisy connections and to enable easy network visualization. AFR is used to describe the likelihood that an isoform would be functionally related to others. Taking the Arylalkylamine N-acetyltransferase gene Aanat as an example, the AFR score of its isoform NM_009591.3 is 0.955. The functional connections of this isoform are much stronger than those of the other isoform NR_033223.1 (AFR=0.078). NM_009591.3 is therefore selected as the Highest Connected Isoform of Aanat (Figure 1A). Consistent with the predictions, NM_009591.3 is a protein-coding transcript containing a functional acetyltransferase domain (Figure 1B), whereas NR_033223.1 is a non-coding transcript containing a 5′-most translational start codon, which renders it a candidate target for the nonsense-mediated decay (NMD) pathway based on the NCBI gene database, directly supporting the prediction that NM_009591.3 cannot be functionally highly connected to other proteins.
We identified the functionally highest connected isoforms for the 3427 multi-isoform genes based on the RefSeq gene annotation of mouse, resulting in 3427 HCIs and 5334 NCIs (Supplementary File S2). So far, the functions of the splice isoforms are mainly inferred through computational prediction [37], instead of experimental validation. To our knowledge, isoform-specific functions are known only for a limited number of genes, which can be found in a recent review [39]. Among the 3427 HCIs, 165 are non-coding RNAs, of which most are from validated or predicted non-coding genes except for 6 genes (Wac, Rai12, Zfp672, Ng23, 4930583H14RIK and Prr18), which is consistent with our expectation that most coding gene functions are carried out by protein-coding transcripts and non-coding gene functions by non-coding transcripts.
There are cases in which the AFR scores of NCIs of genes are very close to that of the HCI; such NCIs could also be considered as highly connected isoforms. To cover such isoforms, we included them as HCI candidates if their AFR scores were 80% or more than that of the HCI (Supplementary File S3), which gives in total 2104 HCI candidates. When this threshold was set to 85% and 95%, the numbers of HCI candidates were 1394 and 942, respectively. As an example, the isoform NM_013472.4 (AFR=0.484) of Anxa6 gene is the HCI, and the isoform NM_001110211.1 (AFR=0.426) is its HCI candidate.
We further calculated the ratio of AFR values of the most ‘functionally connected’ isoform to the least ‘functionally connected’ one, using formula (2), for each multi-isoform gene to see how different the functional relationship between isoforms can be. The distribution of the fold change values is shown in Figure 2; 1829 of the 3427 genes (53.4%) have a value > 1.500, implying a high diversity of functional relationship for many of the multi-isoform genes under study. The rest of the genes (46.6%) have an r ratio less than 1.500, likely implying that all isoforms of the gene carry out important functions and caution should be taken to assign canonical functional isoforms for these genes. For those genes having three or more isoforms, we also calculated the ratio of its highest AFR score to the second highest score to see how close the AFR scores of top connected isoforms can be. The distribution of this ratio (ranging from 1.000 to 9.656) is shown in Supplementary Figure S2. Of the 1092 genes coding at least 3 isoforms, we found that about 1/3 of them show quite different AFR scores between their highest and second-highest connected isoforms (ratio > 1.500).
Figure 2.
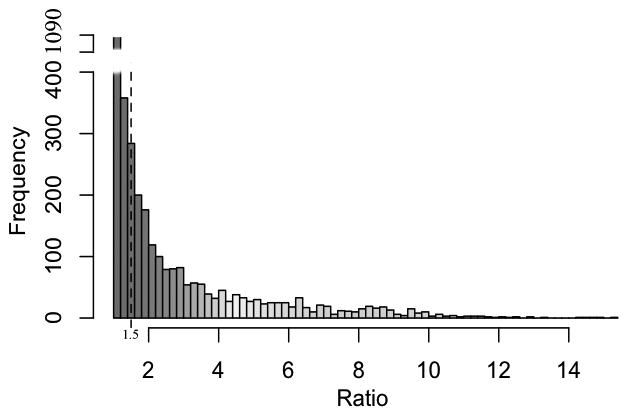
The distribution of the ratio of AFR scores between the most ‘functional’ isoform and the least ‘functional’ one (calculated using Formula 2) of all the 3427 multi-isoform genes of the mouse; 1829 of the 3427 genes have a ratio > 1.5, implying the diversity of functional relationship between isoforms of the same gene. The ratio values range from 1.000 to 15.226.
3.2 Comparison between the functionally highest connected isoforms, the longest isoforms, and the most conserved isoforms
Within the 3427 multi-isoform genes, we compared the HCIs to the longest transcript or protein, if translated. We found that 1833 HCIs (53.5%) are also the longest isoforms (Table 1). Although the overlap is significant compared to the number by chance (p =1.55×10⁻¹⁶), there is often a large discrepancy between the HCIs and the longest isoforms (46.5% are inconsistent), indicating that the canonical isoforms defined by sequence length alone may not correctly reflect the ones with most functional connections (for full list of comparison between functionally highly connected isoforms and the longest isoforms, see Supplementary File S4). The likely reason for this difference between HCIs and the longest isoforms is that the HCIs are identified by functional data whereas the longest isoforms are selected purely by sequence. The HCI of Aanat is NM_009591.3 (1370bp), which is shorter than NR_033223.1 (1472bp), providing an example in which the HCI is not the longest (Figure 1B).
Table 1.
The number of highest connected isoforms shared with canonical isoforms (defined as the longest transcripts) and the principal isoforms in the APPRIS database (defined by sequence and conservation), respectively.
| Canonical isoforms | APPRIS principal isoforms | ||
|---|---|---|---|
| shared | by chance | Shared* | by chance |
| 1833 (53.5%, p =1.55×10− 16) | 1495±23 (43.6%±0.6%) | 1402(75.7%, p =1.32×10− 30) | 1074±25 (58.0%±1.3%) |
Of the 3427 multi-isoform genes, 1853 genes have annotated APPRIS principal isoforms.
We further compared the HCIs to the isoforms in the APPRIS database [17], which are mainly based on sequence conservation as well as protein structures. While 1853 of the 3427 multi-isoform genes have annotated APPRIS principal isoforms, 1402 are in common (75.7%, p =1.32×10⁻³⁰) (Table 1, Supplementary File S5). This fraction of overlapping is much higher than the overlap between the HCIs and the longest isoforms. This result is consistent with previous observations at the gene level that the highest functionally connected genes or genes with more interaction partners tend to be more likely to be conserved in sequence [49], presumably due to higher evolutionary pressure imposed on genes with more interactions [50].
3.3 The highest connected isoforms show consistently higher expression than other isoforms at the transcript level
We investigated the expression signature of the highest connected isoforms at the transcript level. We compared the expression level between HCIs and NCIs based on 175 RNA-seq samples (from Sequence Read Archive, see dataset list in Supplementary File S1). At the threshold log2(FPKM)>-5, the averaged number of expressed genes of these samples are 16744. These 175 samples were not used in predicting the isoform networks of the mouse [29] and therefore served as independent evidence. They cover a variety of cell types and tissues, including but not limited to embryonic stem cells, muscle, kidney, liver, and brain. For each RNA-seq sample, we calculated the average and the distribution of expression levels of the HCIs and NCIs, respectively. The mean of expression values of HCIs and NCIs in each sample is shown in Figure 3A. Strikingly, we found that, regardless of different tissues/cell lines and experimental conditions, on average HCIs consistently show higher expression levels than NCIs (see Supplementary File S6) across all the samples (Figure 3), except for the 10 samples of one RNA-seq dataset, SRP008508. A 3′-end sequencing technique was used for studying transcript expression in this atypical dataset, which was not able to differentiate alternatively spliced isoforms. We further computed the expression distributions of HCIs and NCIs by combining all the experiments (Figure 3B). Although there is overlap between the expression levels of HCIs and NCIs, we found that the expression levels of HCIs are significantly higher than the NCIs (p < 1×10⁻²⁰, two-sample t-test). These results indicate a strong correlation between the HCIs defined by pathways/biological processes and the major transcripts defined as the relatively highly expressed copy [18].
Figure 3.
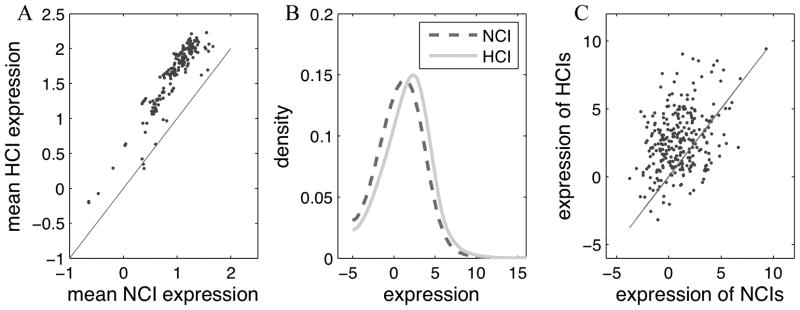
Comparison of expression levels between highly connected isoforms (HCIs) and non-highly connected isoforms (NCIs). A. For each of the 175 RNA-seq samples we collected from SRA, the mean expression was calculated for all HCIs and NCIs, respectively. Each dot represents the mean expression level of HCIs vs. NCIs in one RNA-seq sample. B. The distributions of expression levels of HCIs and NCIs calculated by combining all the 175 RNA-seq samples. C. The expression values of HCIs against NCIs, averaged over the 175 RNA-seq samples, of which 206 genes have both transcript and protein level expression. Each dot represents a HCI-NCI pair within a gene (in total 277 pairs).
3.4 Refining canonical isoform identification using proteomic datasets from diverse tissues
To investigate the expression patterns of HCIs at the protein level, we collected 8 sets of proteomic data covering liver, breast, brain, adrenal, colon, eye, heart and spleen in the mouse. We identified highly confident isoforms expressed in each tissue by their unique peptide sequences according to the protocol we previously described in [43–45, 47, 48]. For multi-isoform genes, we then compared the expressed isoform in each tissue to the predicted HCIs. In total, we observed 323 genes which have protein isoforms expressed. Of them, we found that the HCIs of 206 genes overlap with the expressed protein isoform in at least one tissue, which is significantly higher (p < 10×10−6) than the number by chance (166±10) cases. These results suggest the overall consistency between HCIs identified by pathways and biological processes and the major expressed isoforms at the proteomic level of different tissues. For these 206 genes, the average expression at the transcript level of HCIs is higher than that of NCIs (Figure 3C), which is expected based on the findings in Section 3.3. This implies that HCI is a good indicator of expressed proteins at both the transcript and the protein level, although the correlation between transcript and protein expression has been shown to be usually from 0.4 to 0.6 in previous studies [51, 52]. For these 206 genes, the network-based, transcript expression-based and proteomic data all identified the same isoform to be the canonical isoform, making them strong cases where multiple lines of evidence support the identification of canonical isoforms.
For the other 117 (323–206) genes, their HCIs do not overlap with the expressed protein isoforms. Further, for these 117 genes, the average expression of HCIs at the transcript level is much higher than for NCIs (p < 5.9×10⁻²⁰, Supplementary Figure S3). There are at least three reasons for this observation. First, for some genes, the AFR scores of their isoforms (such as the HCI candidate discussed in Section 3.1) are very close to that of HCI, indicating that these isoforms may actually be equally functional. Thus, it would be difficult to distinguish which isoform is the principal one. For example, the AFR scores of the two isoforms NM_009295.2 and NM_001113569.1 of the Stxbp1 gene are 0.980 and 0.973, respectively. The protein isoform identified at the protein level was not the HCI (NM_009295.2) but the other isoform (NM_001113569.1). Another example is the Ptbp1 gene whose two isoforms have similar scores, but its isoform with the lower AFR score (NM_001077363.1) instead of the HCI NM_008956.2, was also found in our proteomic data (described in Section 2.3). Second, compared to transcriptomic data, the number of proteins and protein isoforms that can be confidently identified in a proteomic experiment is smaller than for transcripts, with a lot of protein isoforms undetected. Third, we studied only eight tissues and the expression of certain isoforms can be tissue-specific [53]. We listed 114 genes whose expressed proteins overlap with their HCIs and meanwhile have a ratio > 1.500 between the maximum and minimum AFR values (see Formula 2). Table 2 presents a list of isoforms with high confidence to be the canonical ones. This list represents the canonical isoforms supported by both participation in biological pathways and protein-level expression. We observed that, for 35 of the 114 genes, their HCIs are expressed at the protein level in at least 4 tissues. For example, the HCIs of Prosc (proline synthetase co-transcribed) and Tardbp (TAR DNA binding protein) were observed in all the 8 tissues under study, which indicates that the biological role of these two proteins is carried out in diverse tissues by a single ‘functional’ isoform. Other isoforms are only identified in some or one of the samples. These isoforms are either tissue-specific in expression or their expression was not identified due to the limited coverage of proteomic sequences. An example of the former is Syn3 (Synapsin III), which encodes a neuronal phosphoprotein and is brain-specific (according to its GeneCards expression profile): its HCI NM_013722.3 was found only in brain in our proteomic sample collection (Table 2).
Table 2.
Highly connected isoforms of 114 genes validated at the protein level using 8 normal tissues of mouse *.
| Gene | HCI | Tissue |
|---|---|---|
| Aanat | NM_009591.3 | LV |
| Cyp3a25 | NM_019792.2 | LV |
| Mpp6 | NM_019939.2 | AR,CL,EY,HT,SL |
| Psmd2 | NM_134101.2 | LV,BN,AR,CL,EY,HT,SL |
| Mrpl15 | NM_001177658.1 | LV |
| Tsr2 | NM_001164578.1 | AR,CL,HT |
| Cstf3 | NM_145529.3 | LV |
| Adhfe1 | NM_175236.4 | LV |
| Abca6 | NM_147218.2 | LV |
| Ndufs6 | NM_010888.2 | LV |
| Hspa13 | NM_030201.3 | LV |
| Pex16 | NM_145122.2 | LV |
| Mrpl48 | NM_198831.2 | LV,AR,CL,EY,HT |
| Wdr13 | NM_026137.4 | AR |
| Prpsap2 | NM_001164242.1 | AR,CL,EY,HT,SL |
| Aspn | NM_025711.3 | AR,CL,EY,HT,SL |
| Adarb1 | NM_130895.3 | BN |
| Prosc | NM_054057.4 | LV,BT,BN,AR,CL,EY,HT,SL |
| Wtap | NM_001113533.1 | CL |
| Ociad1 | NM_023429.4 | LV |
| Dars | NM_177445.5 | LV,BN |
| Triobp | NM_001024716.1 | AR,CL,EY,HT,SL |
| Dab1 | NM_177259.3 | LV |
| Lrp4 | NM_172668.3 | LV |
| Gatad2a | NM_145596.3 | AR,CL |
| Ripk3 | NM_019955.2 | CL,SL |
| Fbrsl1 | NM_001142642.1 | LV |
| Dlgap4 | NM_001042487.1 | AR,CL,EY,HT,SL |
| Brdt | NM_054054.2 | LV |
| Tsc22d1 | NM_207652.2 | AR,CL,EY,HT,SL |
| Nagk | NM_019542.2 | AR,CL,EY,HT,SL |
| Jak2 | NM_008413.2 | CL |
| Mkl2 | NM_001122667.2 | AR,CL,SL |
| Atp2a2 | NM_001110140.3 | LV |
| Abhd11 | NM_145215.2 | LV |
| Hgd | NM_013547.3 | LV |
| Pex5l | NM_021483.3 | AR,EY |
| Nags | NM_145829.1 | LV |
| Syn3 | NM_013722.3 | BN |
| Ndrg2 | NM_001145959.1 | BN |
| Copg | NM_017477.2 | LV |
| Dazap1 | NM_001122605.1 | AR,CL,EY,SL |
| Golph3l | NM_146133.3 | AR,CL,EY,HT,SL |
| Rlbp1 | NM_020599.2 | EY |
| Grk4 | NM_019497.2 | LV |
| Brd2 | NM_010238.3 | AR,EY |
| Slc25a21 | NM_172577.3 | LV |
| Bcap29 | NM_001164090.1 | AR |
| Glrx2 | NM_001038592.1 | LV |
| Tardbp | NM_145556.4 | LV,BT,BN,AR,CL,EY,HT,SL |
| Rps24 | NM_207634.1 | LV |
| Golga2 | NM_133852.2 | AR,CL,EY,HT,SL |
| Tnpo2 | NM_145390.4 | AR,CL,EY,HT,SL |
| Acss3 | NM_001142804.1 | LV |
| Chchd6 | NM_001167736.1 | AR,CL,EY,HT |
| 2310035c23rik | NM_173187.3 | AR,CL,EY,HT,SL |
| Stk32c | NM_021302.3 | BN |
| Snx7 | NM_029655.3 | AR,CL,SL |
| Sbsn | NM_172205.3 | AR,CL,EY,HT,SL |
| Wdr33 | NM_028866.3 | BN |
| Mrps33 | NM_010270.2 | LV,AR |
| Ahnak | NM_009643.1 | LV,BT,AR,CL,EY,HT,SL |
| Lig1 | NM_010715.2 | AR,SL |
| Sorbs1 | NM_001034964.1 | BN |
| Asb7 | NM_080443.2 | LV |
| Pacsin3 | NM_028733.3 | AR,EY,HT |
| Plin1 | NM_175640.2 | BT |
| Inadl | NM_172696.2 | LV,CL,SL |
| Kctd14 | NM_001012434.3 | CL |
| Cyp2c50 | NM_134144.2 | LV |
| Tmsb10 | NM_025284.4 | AR,CL,EY,SL |
| Pick1 | NM_008837.2 | AR,CL |
| Hagh | NM_024284.2 | AR,CL,EY,HT,SL |
| Copg2 | NM_017478.2-2 | LV |
| Syt7 | NM_173068.2 | AR,CL |
| Fam134c | NM_026501.2 | LV |
| Ikzf1 | NM_001025597.1 | SL |
| Inpp4a | NM_030266.3 | CL |
| Setdb1 | NM_001163641.1 | SL |
| Aspscr1 | NM_026877.2 | LV |
| Rab11fip1 | NM_001080813.2 | CL,SL |
| Aamp | NM_146110.3 | CL |
| Wdr61 | NM_001025375.1 | AR,CL,EY,HT,SL |
| Wasl | NM_028459.2 | LV,AR,CL,EY,SL |
| Ncam1 | NM_001081445.1 | BN |
| Brd4 | NM_198094.2 | LV |
| Hnrnpa1 | NM_001039129.3 | AR,CL,EY,HT,SL |
| Egfr | NM_207655.2 | LV |
| Ppih | NM_028677.4 | AR,CL,EY,HT,SL |
| Dpp4 | NM_010074.3 | LV |
| Thnsl1 | NM_177588.2 | AR,CL,EY,HT |
| Tufm | NM_172745.3 | BT |
| Dnajc6 | NM_001164583.1 | LV |
| Pacsin2 | NM_011862.3 | AR,CL,EY,HT,SL |
| Zfml | NM_008717.3 | BN,CL,SL |
| Acbd6 | NM_028250.3 | LV |
| Bc030307 | NM_001003910.2 | LV |
| Nfasc | NM_182716.4 | BN |
| Rrbp1 | NM_024281.2 | LV,BN |
| Cd97 | NM_011925.2 | AR,CL,HT |
| Epb4.1l1 | NM_001003815.2 | AR,CL,EY,SL |
| Gngt2 | NM_001038664.2 | EY,SL |
| Pabpc4 | NM_130881.2 | AR,CL,EY,HT,SL |
| Gimap4 | NM_174990.3 | AR,CL,EY,HT,SL |
| Eif2ak4 | NM_013719.3 | CL,SL |
| Pram1 | NM_001002842.2 | LV |
| Pacsin1 | NM_011861.2 | AR,CL,EY,HT,SL |
| Erc1 | NM_053204.2 | LV,AR,CL,EY,HT,SL |
| Lmna | NM_001111102.1 | AR,CL,EY,HT,SL |
| Rdx | NM_009041.3 | AR,CL,EY,HT,SL |
| Ace2 | NM_001130513.1 | AR |
| Acp1 | NM_021330.4 | AR,CL,HT,SL |
| Pnkd | NM_025580.2 | LV |
| Eif4a2 | NM_001123037.1 | LV |
tissue abbreviation: LV, liver; BT, breast; BN, brain; AR, adrenal; CL, colon; EY, eye; HT, heart; SL, spleen. Only genes with the ratio of maximum to minimum AFR scores > 1.5 are listed here.
4 Discussion
Alternative splicing results in isoforms that greatly increase the repertoire of gene products and thus their functional complexity. To interrogate the main functions of these gene products, many studies have been devoted to identifying the canonical or principal isoforms. Previous criteria on the selection of such canonical isoforms are highly heterogeneous, based on sequence, conservation, expression and existence of functional domains [15, 17–19, 54]. However, they rarely consider whether the identified isoforms are indeed representative of the major function of the genes through analyzing their involvement in pathways and with proteomic evidence.
In this work, we used multiple lines of evidence integrating both functional genomic data and proteomic data to refine the identification of canonical isoforms. One important line of evidence we used was based on a functional relationship network, under the critical assumption that the functionally highest connected isoforms are more likely to represent the main functional gene product. We found that a large proportion of the HCIs are not the canonical isoforms as defined by the length of the transcripts. However, they do show strong overlap with the most conserved transcripts, the relatively highly expressed copies at the RNA level, and the identified splice copies at the protein level. These findings support the prediction for canonical isoforms by this integrative proteogenomic approach. On the other hand, our current findings may be limited by factors such as limited functional annotation data of splice isoforms, protein expression data used in our study and the small number of proteomic experiments. Also, expression of transcripts and proteins are highly dynamic at different developmental stages of tissues or cell lines, which might add further complexity to the process of identifying canonical isoforms. It is expected that more reliable results would be obtained if more systematically processed proteomic data are available. Overall, the identified HCIs for the mouse provide an abundant source for investigating main functional products of 3427 multi-isoform genes; 206 of them are also further confirmed at the protein expression level. Our study adds a new aspect to the current knowledge on principal isoforms mainly based on sequence or conservation. We are building an analogous functional relationship network with human datasets.
Supplementary Material
Acknowledgments
This work is supported by NIH grants 1R21NS082212-01 (YG) and RM08029 and U54ES017885 (GSO).
Footnotes
Conflict of interest statement
The authors have declared no conflict of interest.
References
- 1.Pan Q, Shai O, Misquitta C, Zhang W, et al. Revealing global regulatory features of mammalian alternative splicing using a quantitative microarray platform. Mol Cell. 2004;16:929–941. doi: 10.1016/j.molcel.2004.12.004. [DOI] [PubMed] [Google Scholar]
- 2.Pan Q, Shai O, Lee LJ, Frey BJ, Blencowe BJ. Deep surveying of alternative splicing complexity in the human transcriptome by high-throughput sequencing. Nat Genet. 2008;40:1413–1415. doi: 10.1038/ng.259. [DOI] [PubMed] [Google Scholar]
- 3.Matlin AJ, Clark F, Smith CWJ. Understanding alternative splicing: towards a cellular code. Nat Rev Mol Cell Biol. 2005;6:386–398. doi: 10.1038/nrm1645. [DOI] [PubMed] [Google Scholar]
- 4.Gooding C, Smith C. Tropomyosin exons as models for alternative splicing. Adv Exp Med Biol. 2008;644:27–42. doi: 10.1007/978-0-387-85766-4_3. [DOI] [PubMed] [Google Scholar]
- 5.Calarco JA, Saltzman AL, Ip JY, Blencowe BJ. Technologies for the global discovery and analysis of alternative splicing. Adv Exp Med Biol. 2007;623:64–84. doi: 10.1007/978-0-387-77374-2_5. [DOI] [PubMed] [Google Scholar]
- 6.Mittendorf KF, Deatherage CL, Ohi MD, Sanders CR. Tailoring of Membrane Proteins by Alternative Splicing of Pre-mRNA. Biochemistry. 2012;51:5541–5556. doi: 10.1021/bi3007065. [DOI] [PMC free article] [PubMed] [Google Scholar]
- 7.Menon R, Omenn GS. Proteomic characterization of novel alternative splice variant proteins in human epidermal growth factor receptor 2/neu-induced breast cancers. Cancer Res. 2010;70:3440–3449. doi: 10.1158/0008-5472.CAN-09-2631. [DOI] [PMC free article] [PubMed] [Google Scholar]
- 8.Black DL. Mechanisms of alternative pre-messenger RNA splicing. Annu Rev Biochem. 2007;72:291–336. doi: 10.1146/annurev.biochem.72.121801.161720. [DOI] [PubMed] [Google Scholar]
- 9.Wan J, Masuda T, Hackler L, Torres KM, et al. Dynamic usage of alternative splicing exons during mouse retina development. Nucleic Acids Res. 2011;39:7920–7930. doi: 10.1093/nar/gkr545. [DOI] [PMC free article] [PubMed] [Google Scholar]
- 10.Barash Y, Calarco JA, Gao W, Pan Q, et al. Deciphering the splicing code. Nature. 2010;465:53–59. doi: 10.1038/nature09000. [DOI] [PubMed] [Google Scholar]
- 11.Tazi J, Bakkour N, Stamm S. Alternative splicing and disease. Biochim Biophys Acta. 2009;1792:14–26. doi: 10.1016/j.bbadis.2008.09.017. [DOI] [PMC free article] [PubMed] [Google Scholar]
- 12.Omenn GS, Yocum AK, Menon R. Alternative splice variants, a new class of protein cancer biomarker candidates: findings in pancreatic cancer and breast cancer with systems biology implications. Dis Markers. 2010;28:241–251. doi: 10.3233/DMA-2010-0702. [DOI] [PMC free article] [PubMed] [Google Scholar]
- 13.Griffith M, Griffith OL, Mwenifumbo J, Goya R, et al. Alternative expression analysis by RNA sequencing. Nat Methods. 2010;7:843–847. doi: 10.1038/nmeth.1503. [DOI] [PubMed] [Google Scholar]
- 14.Emig D, Salomonis N, Baumbach J, Lengauer T, et al. AltAnalyze and DomainGraph: analyzing and visualizing exon expression data. Nucleic Acids Res. 2010;38:W755–762. doi: 10.1093/nar/gkq405. [DOI] [PMC free article] [PubMed] [Google Scholar]
- 15.Bahar T, Ben S, Terry G. Distribution of alternatively spliced transcript isoforms within human and mouse transcriptomes. J Omics Res. 2011;1:1–5. [Google Scholar]
- 16.http://www.uniprot.org/faq/30
- 17.Rodriguez JM, Maietta P, Ezkurdia I, Pietrelli A, et al. APPRIS: annotation of principal and alternative splice isoforms. Nucleic Acids Res. 2013;41:D110–D117. doi: 10.1093/nar/gks1058. [DOI] [PMC free article] [PubMed] [Google Scholar]
- 18.Djebali S, Davis CA, Merkel A, Dobin A, et al. Landscape of transcription in human cells. Nature. 2012;489:101–108. doi: 10.1038/nature11233. [DOI] [PMC free article] [PubMed] [Google Scholar]
- 19.Gonzàlez-Porta M, Frankish A, Rung J, Harrow J, Brazma A. Transcriptome analysis of human tissues and cell lines reveals one dominant transcript per gene. Genome Biol. 2013;14:R70. doi: 10.1186/gb-2013-14-7-r70. [DOI] [PMC free article] [PubMed] [Google Scholar]
- 20.http://genome.ucsc.edu/cgi-bin/hgTrackUi?db=hg19&g=knownGene
- 21.Skotheim RI, Nees M. Alternative splicing in cancer: Noise, functional, or systematic? Int J Biochem Cell Biol. 2007;39:1432–1449. doi: 10.1016/j.biocel.2007.02.016. [DOI] [PubMed] [Google Scholar]
- 22.de Souza JES, Ramalho RF, Galante PAF, Meyer D, de Souza SJ. Alternative splicing and genetic diversity: silencers are more frequently modified by SNVs associated with alternative exon/intron borders. Nucleic Acids Res. 2011;39:4942–4948. doi: 10.1093/nar/gkr081. [DOI] [PMC free article] [PubMed] [Google Scholar]
- 23.Dunham I, Kundaje A, Aldred SF, Collins PJ, et al. An integrated encyclopedia of DNA elements in the human genome. Nature. 2012;489:57–74. doi: 10.1038/nature11247. [DOI] [PMC free article] [PubMed] [Google Scholar]
- 24.Renuse S, Chaerkady R, Pandey A. Proteogenomics. Proteomics. 2011;11:620–630. doi: 10.1002/pmic.201000615. [DOI] [PubMed] [Google Scholar]
- 25.Pandey A, Lewitter F. Nucleotide sequence databases: a gold mine for biologists. Trends Biochem Sci. 1999;24:276–280. doi: 10.1016/s0968-0004(99)01400-0. [DOI] [PubMed] [Google Scholar]
- 26.Kalume D, Peri S, Reddy R, Zhong J, et al. Genome annotation of Anopheles gambiae using mass spectrometry-derived data. BMC Genomics. 2005;6:128. doi: 10.1186/1471-2164-6-128. [DOI] [PMC free article] [PubMed] [Google Scholar]
- 27.Xia D, Sanderson S, Jones A, Prieto J, et al. The proteome of Toxoplasma gondii: integration with the genome provides novel insights into gene expression and annotation. Genome Biol. 2008;9:R116. doi: 10.1186/gb-2008-9-7-r116. [DOI] [PMC free article] [PubMed] [Google Scholar]
- 28.Castellana NE, Payne SH, Shen Z, Stanke M, et al. Discovery and revision of Arabidopsis genes by proteogenomics. Proc Natl Acad Sci USA. 2008;105:21034–21038. doi: 10.1073/pnas.0811066106. [DOI] [PMC free article] [PubMed] [Google Scholar]
- 29.Li H-D, Menon R, Eksi R, Guerler A, et al. Modeling the functional relationship network at the splice isoform level through heterogeneous data integration. bioRxiv. 2013 doi: 10.1101/001719. [DOI] [Google Scholar]
- 30.Park CY, Wong AK, Greene CS, Rowland J, et al. Functional Knowledge Transfer for High-accuracy Prediction of Under-studied Biological Processes. PLoS Comput Biol. 2013;9:e1002957. doi: 10.1371/journal.pcbi.1002957. [DOI] [PMC free article] [PubMed] [Google Scholar]
- 31.Guan Y, Ackert-Bicknell CL, Kell B, Troyanskaya OG, Hibbs MA. Functional genomics complements quantitative genetics in identifying disease-gene associations. PLoS Comput Biol. 2010;6:e1000991. doi: 10.1371/journal.pcbi.1000991. [DOI] [PMC free article] [PubMed] [Google Scholar]
- 32.Guan Y, Myers CL, Lu R, Lemischka IR, et al. A genomewide functional network for the laboratory mouse. PLoS Comput Biol. 2008;4:e1000165. doi: 10.1371/journal.pcbi.1000165. [DOI] [PMC free article] [PubMed] [Google Scholar]
- 33.Wong AK, Park CY, Greene CS, Bongo LA, et al. IMP: a multi-species functional genomics portal for integration, visualization and prediction of protein functions and networks. Nucleic Acids Res. 2012;40:W484–W490. doi: 10.1093/nar/gks458. [DOI] [PMC free article] [PubMed] [Google Scholar]
- 34.Guan Y, Gorenshteyn D, Schimenti JC, Handel MA, et al. Tissue-specific functional networks for prioritizing phenotypes and disease genes. PLoS Comput Biol. 2012;8:e1002694. doi: 10.1371/journal.pcbi.1002694. [DOI] [PMC free article] [PubMed] [Google Scholar]
- 35.Andrews S, Tsochantaridis I, Hofmann T. Support vector machines for multiple-instance learning. Advances NIPS. 2003;15 [Google Scholar]
- 36.Maron O, Lozano-Perez T. Advances in Neural Information Processing Systems. 1998;10:570–576. [Google Scholar]
- 37.Eksi R, Li HD, Menon R, Wen Y, et al. Systematically differentiating functions for alternatively spliced isoforms through integrating RNA-seq data. PloS Comput Biol. 2013;9:e1003314. doi: 10.1371/journal.pcbi.1003314. [DOI] [PMC free article] [PubMed] [Google Scholar]
- 38.Li HD, Menon R, Omenn G, Guan Y. The emerging era of genomic data integration for analyzing splice isoform functions. Trends Genet. 2014;30:340–347. doi: 10.1016/j.tig.2014.05.005. [DOI] [PMC free article] [PubMed] [Google Scholar]
- 39.Omenn GS, Guan Y, Menon R. A new class of protein cancer biomarker candidates: Differentially expressed splice variants of ERBB2 (HER2/neu) and ERBB1 (EGFR) in breast cancer cell lines. Proteomics. 2014:S1874–3919. doi: 10.1016/j.jprot.2014.04.012. 00179-00171. [DOI] [PMC free article] [PubMed] [Google Scholar]
- 40.Trapnell C, Roberts A, Goff L, Pertea G, et al. Differential gene and transcript expression analysis of RNA-seq experiments with TopHat and Cufflinks. Nat Prot. 2012;7:562–578. doi: 10.1038/nprot.2012.016. [DOI] [PMC free article] [PubMed] [Google Scholar]
- 41.Trapnell C, Pachter L, Salzberg SL. TopHat: discovering splice junctions with RNA-Seq. Bioinformatics. 2009;25:1105–1111. doi: 10.1093/bioinformatics/btp120. [DOI] [PMC free article] [PubMed] [Google Scholar]
- 42.Desiere F, Deutsch EW, King NL, Nesvizhskii AI, et al. The PeptideAtlas project. Nucleic Acid Res. 2006;34:D655–D658. doi: 10.1093/nar/gkj040. [DOI] [PMC free article] [PubMed] [Google Scholar]
- 43.Craig R, Beavis RC. TANDEM: matching proteins with tandem mass spectra. Bioinformatics. 2004;20:1466–1467. doi: 10.1093/bioinformatics/bth092. [DOI] [PubMed] [Google Scholar]
- 44.Menon R, Zhang Q, Zhang Y, Fermin D, et al. Identification of novel alternative splice isoforms of circulating proteins in a mouse model of human pancreatic cancer. Cancer Res. 2009;69:300–309. doi: 10.1158/0008-5472.CAN-08-2145. [DOI] [PMC free article] [PubMed] [Google Scholar]
- 45.Whiteaker JR, Zhang H, Zhao L, Wang P, et al. Integrated pipeline for mass spectrometry-based discovery and confirmation of biomarkers demonstrated in a mouse model of breast cancer. J Proteome Res. 2007;6:3962–3975. doi: 10.1021/pr070202v. [DOI] [PubMed] [Google Scholar]
- 46.Menon R, Roy A, Mukherjee S, Belkin S, et al. Functional implications of structural predictions for alternative splice proteins expressed in Her2/neu-induced breast cancers. J Proteome Res. 2011;10:5503–5511. doi: 10.1021/pr200772w. [DOI] [PMC free article] [PubMed] [Google Scholar]
- 47.Shi R, Kumar C, Zougman A, Zhang Y, et al. Analysis of the mouse liver proteome using advanced mass spectrometry. J Proteome Res. 2007;6:2963–2972. doi: 10.1021/pr0605668. [DOI] [PubMed] [Google Scholar]
- 48.Geiger T, Velic A, Macek B, Lundberg E, et al. Initial quantitative proteomic map of 28 mouse tissues using the SILAC mouse. Mol Cell Proteomics. 2013;12:1709–1722. doi: 10.1074/mcp.M112.024919. [DOI] [PMC free article] [PubMed] [Google Scholar]
- 49.Mackay TFC. Epistasis and quantitative traits: using model organisms to study gene-gene interactions. Nat Rev Genet. 2014;15:22–33. doi: 10.1038/nrg3627. [DOI] [PMC free article] [PubMed] [Google Scholar]
- 50.Park S, Lehner B. Epigenetic epistatic interactions constrain the evolution of gene expression. Mol Syst Biol. 2013;9:645. doi: 10.1038/msb.2013.2. [DOI] [PMC free article] [PubMed] [Google Scholar]
- 51.Guo Y, Xiao P, Lei S, Deng F, et al. How is mRNA expression predictive for protein expression? A correlation study on human circulating monocytes. Acta Bioch Bioph Sin. 2008;40:426–436. doi: 10.1111/j.1745-7270.2008.00418.x. [DOI] [PubMed] [Google Scholar]
- 52.Gry M, Rimini R, Stromberg S, Asplund A, et al. Correlations between RNA and protein expression profiles in 23 human cell lines. BMC Genomics. 2009;10:365. doi: 10.1186/1471-2164-10-365. [DOI] [PMC free article] [PubMed] [Google Scholar]
- 53.Ellis Jonathan D, Barrios-Rodiles M, Çolak R, Irimia M, et al. Mol cell. 2012;46:884–892. doi: 10.1016/j.molcel.2012.05.037. [DOI] [PubMed] [Google Scholar]
- 54.Tress ML, Wesselink JJ, Frankish A, López G, et al. Determination and validation of principal gene products. Bioinformatics. 2008;24:11–17. doi: 10.1093/bioinformatics/btm547. [DOI] [PMC free article] [PubMed] [Google Scholar]
Associated Data
This section collects any data citations, data availability statements, or supplementary materials included in this article.