

Abstract
Objectives
Mast cells may contribute to the pathogenesis of eosinophilic esophagitis (EoE), but their role in diagnosis is unknown. Our aim was to determine whether tryptase staining of esophageal mast cells differentiates EoE from GERD and has utility for diagnosis of EoE.
Methods
We performed a case-control study comparing patients with EoE, defined by consensus guidelines, to GERD patients with eosinophils on esophageal biopsy. Immunohistochemistry was performed with mast cell tryptase. The density (mast cells/mm2) and intensity (0–4 scale) of mast cell staining was compared between groups after masking the diagnosis. Receiver operating characteristic (ROC) curves were constructed, and the area under the curve (AUC) calculated to assess mast cell staining as both a stand-alone diagnostic test and an adjunctive assay with eosinophil counts.
Results
Fifty-four EoE (mean age: 24; 69% male; mean 146 eos/hpf) and 55 GERD (mean age 34; 60% male; mean 20 eos/hpf) patients were analyzed. The maximum epithelial tryptase density was higher in EoE than in GERD (162 ± 87 mast cells/mm2 vs 67 ± 54; p<0.001). Mast cells were diffusely distributed throughout the biopsy in more EoE than GERD patients (41% vs 7%; p<0.001). Tryptase density and eosinophil count were only weakly correlated (R2=0.09; p=0.002). The AUC was 0.84 for tryptase staining alone, and 0.96 for the combination of mast cells and eosinophils.
Conclusions
Patients with EoE have higher levels of tryptase positive mast cells compared to GERD patients, improving the diagnostic value of biopsies beyond eosinophil counts alone. Mast cell tryptase may have utility as a diagnostic assay for EoE.
Keywords: eosinophilic esophagitis, gastroesophageal reflux disease, mast cells, tryptase, diagnosis
Introduction
Eosinophilic esophagitis (EoE) is an increasingly recognized clinicopathologic condition defined in recent guidelines as esophageal dysfunction and esophageal eosinophilia in the absence of other potential causes including gastroesophageal reflux disease (GERD) (1). In practice, however, it can be challenging to differentiate these two conditions because the clinical and histopathologic features of eosinophilic esophagitis and GERD overlap substantially. For example, symptoms of EoE include dysphagia, food impaction, and heartburn, complaints commonly found in GERD populations (1–7). The histologic hallmark of EoE is esophageal eosinophilia, but this is also not specific and high numbers of eosinophils can be seen in GERD as well (8–10).
Mast cells have been implicated in EoE pathogenesis in several studies, and could hold promise as a specific tissue marker of EoE. Increased staining for mast cells has been demonstrated in patients with EoE compared to those with GERD and to normal controls (11–18). Mast cell-associated genes are upregulated in EoE (13, 18), and mast cells produce IL-13 and TGF-β, which have been implicated in eosinophil migration and fibrosis, respectively (19–23), However, the potential role of mast cells in diagnosing EoE is unknown.
The aim of this study was to determine whether the presence of tryptase-positive mast cells in the esophageal epithelium could differentiate EoE from GERD and, if so, to determine the utility of the assay for diagnosis of EoE. We hypothesized that patients with EoE would have a greater number of esophageal mast cells than GERD patients, and that increasing numbers of mast cells would predict EoE case status.
Methods
Study design and patients
This was a case-control study of patients from the UNC EoE Clinicopathologic database from 2000–2007. Details of the development of this database and patient characteristics have been previously reported (7).
Cases were patients of any age who had newly diagnosed EoE as defined by recent consensus guidelines (1). These cases had at least one typical symptom of esophageal dysfunction (for example dysphagia, food impaction, heartburn, or feeding intolerance); at least 15 eosinophils per high-power field (eos/hpf) on esophageal biopsy; and had other causes of esophageal eosinophilia, including reflux disease, excluded. GERD was excluded in EoE cases by documenting persistent esophageal eosinophilia despite acid suppression at the time of biopsy (n = 32), by documenting persistent esophageal eosinophilia despite prior symptoms refractory to high-dose acid-suppression (n = 18), or with negative pH monitoring (n = 4). Of note, these cases had previously been extensively characterized with confirmation of the diagnosis of EoE (7).
Controls were GERD patients who underwent esophagogastroduodenoscopy (EGD) and biopsy during the same time frame as the cases. GERD patients were defined by at least one typical symptom, including heartburn, regurgitation, pain, or, in children, failure to thrive, which was the primary indication for the procedure, and which responded to anti-secretory therapy with either a proton pump inhibitor (PPI) or a H2 receptor blocker. In addition, inflammation, including at least 1 eos/hpf, was required on biopsy, and other potential or competing causes of the presentation were excluded by the clinical evaluation. We required some degree of eosinophilia in our GERD control population to generate a clinically ambiguous group in whom EoE might be misdiagnosed, and where the diagnostic challenge to the clinician was greatest. Such a group would presumably benefit from an assay to differentiate GERD from EoE.
Data sources and histology review
Clinical data were extracted from electronic medical records and endoscopy reports. Covariates assessed included: demographics (age at diagnosis, gender, race); symptom complex; co-existing atopic disease (allergic rhinitis or sinusitis, documented food allergy (demonstrated by either symptomatic evidence of allergy with reintroduction of a food or by testing directed by an Allergist), or asthma); and endoscopic findings (rings, strictures, a narrow-caliber esophagus, linear furrows, white plaques or exudates, erosions, decreased vascularity, erosive esophagitis, ulceration, and hiatal hernia).
Archived pathology slides were re-reviewed by the study pathologists to determine eosinophil counts according to our validated protocol (24). In brief, slides were masked as to case and control status and the maximum eosinophil density (eosinophils/mm2) was determined after examination of five microscopy fields. For purposes of comparison to previous studies, eosinophil density was then converted to eos/hpf for an assumed hpf size of 0.24 mm2, the size of an average field as reported in the literature (5).
Immunohistochemistry and mast cell counts
Formalin-fixed paraffin-embedded tissue blocks were masked to case and control status, sectioned (5 microns thick), and randomly sorted. Immunohistochemistry (IHC) was performed using a high volume automated system (Dako Autostainer; Dako, Carpinteria, CA) according to standard protocol. Slides were deparaffinized with xylene, steam-treated for antigen retrieval (Target Retrieval Solution; Dako), incubated with a mouse anti-human mast cell tryptase primary antibody (Clone AA1; 1:500 dilution; Dako), incubated with a peroxidase-labelled anti-mouse polymer secondary antibody (Envision; Dako), stained with a diaminobenzidine chromogen (DAB; Innovex Biosciences, Richmond, CA), and then counterstained with hematoxylin.
In a protocol identical to that for eosinophil counts, the IHC glass slides were scanned and converted to digital slides, and viewed with Aperio ImageScope (Aperio Technologies, Vista, CA) (24). The maximum density of tryptase-positive cells in the esophageal epithelial layer, measured in mast cells/mm2, was then determined after examination of five microscopy fields. This quantitative measure of tryptase-positive mast cell density was the primary predictor variable for the study. In addition, we assessed the mucosal and biopsy distribution of mast cells, and made an assessment of staining intensity, which ranged from grade 0, or no staining, to grade 4, or diffuse staining (Figure 1). These are presented to provide examples of the overall range of possible staining results.
Figure 1.
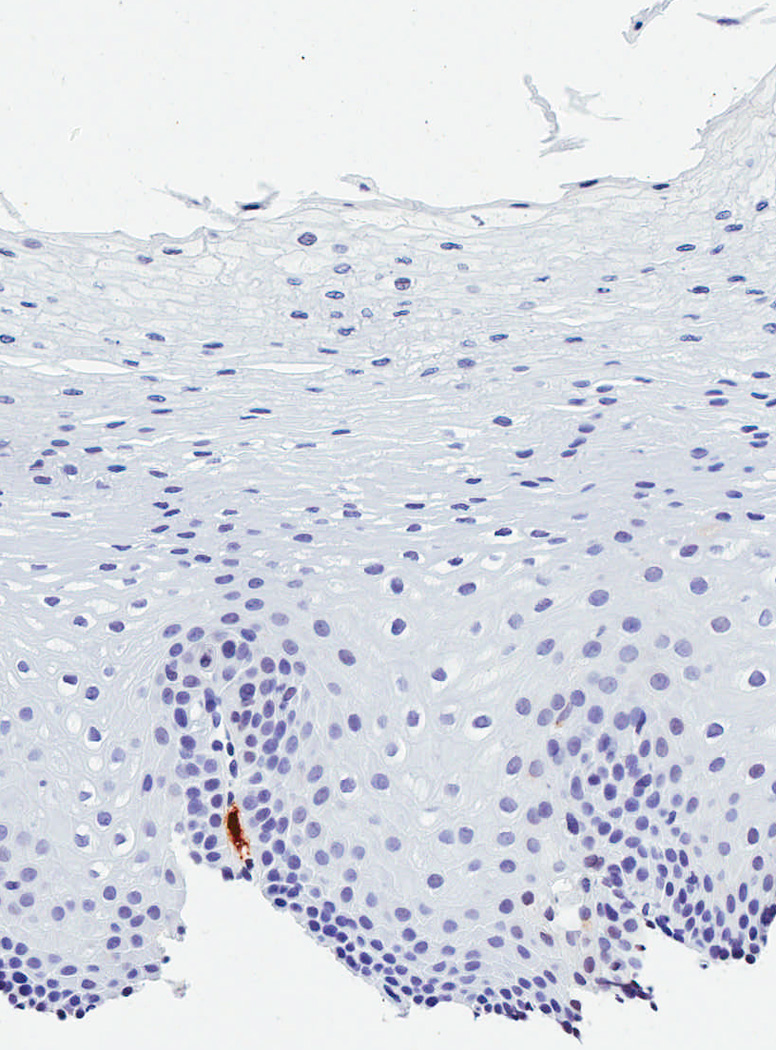

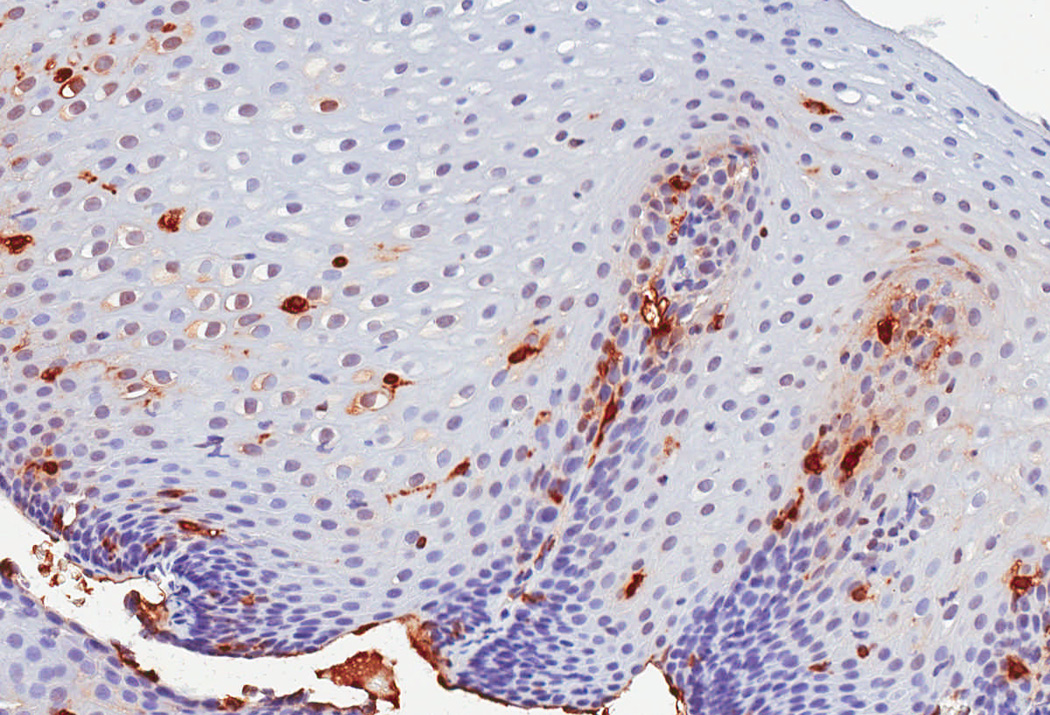
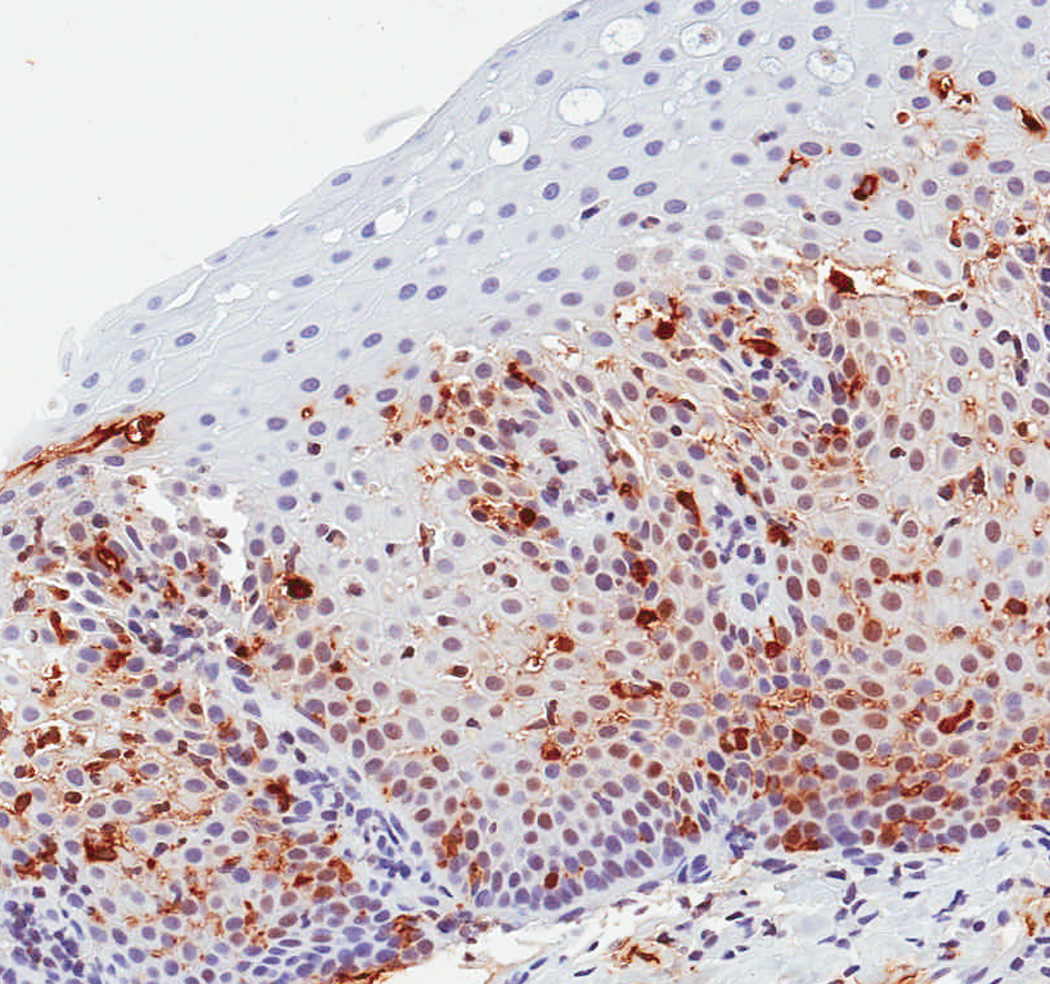
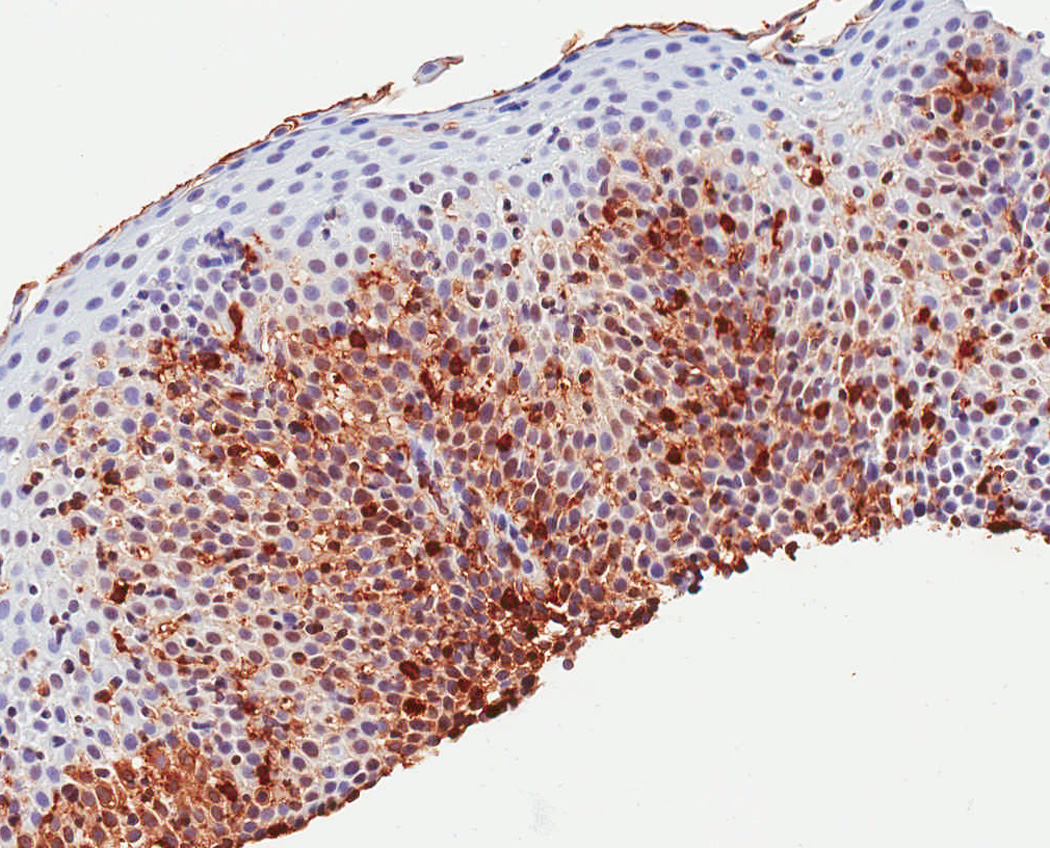
Observed range of staining of tryptase-positive mast cells in the esophageal epithelium. (A) Grade 0 – no staining. (B) Grade 1 – minimal staining in the basal zone. (C) Grade 2 – moderate staining, but still patchy. (D) Grade 3 – more prominent staining spread throughout the epithelium. (E) Grade 4 – marked and diffuse staining.
Statistical analysis
Statistical analysis was performed using Stata version 9 (Statacorp, College Station, TX). Descriptive statistics were used to summarize characteristics of the cases and controls. Bivariate analysis was performed with Chi-square for categorical variables, and t-tests or Wilcoxon-Rank-sum tests for continuous variables as appropriate. Correlation between mast cell and eosinophil counts was calculated by Pearson’s Rho (R). To assess the effect of potential confounding factors, we performed two additional post-hoc analyses. First, we limited the control group to only those patients with erosive esophagitis, assuming that this was a set of patients with definitive GERD. Second, we performed logistic regression controlling for clinical, endoscopic, and histologic factors to explore whether there was an additional benefit of tryptase staining.
Receiver operating characteristic (ROC) curves were constructed using EoE case status as defined by the consensus diagnostic guidelines as the gold standard (1). The area under the curve (AUC) was calculated and compared for three different models predicting EoE case status: mast cell density alone; eosinophil count alone; and both mast cell and eosinophil levels. To contextualize the AUC, we calculated sensitivity, specificity, and positive and negative likelihood ratios (LR) under five conditions: for mast cell density alone, using a cut-point that maximized sensitivity and specificity in this dataset; for eosinophil count alone, first using a cut-point that maximized sensitivity and specificity in this dataset, and then using a cut-point of 15 eos/hpf, as per current diagnostic guidelines (1); and for both mast cell and eosinophil levels, first using the cut-point for each that maximized sensitivity and specificity in this dataset, and then using a cut-point of 15 eos/hpf, as per diagnostic current guidelines.
This study was approved by the UNC Institutional Review Board.
Results
Study subject characteristics
A total of 54 EoE cases and 55 GERD controls were identified for this study (Table 1). In comparison to the GERD controls, cases of EoE were younger at diagnosis (24 vs 34 years; p = 0.02), and had more dysphagia (70% vs 31%; p < 0.001) and food impaction (28% vs 2%; p = 0.001). The EoE cases also had more atopic diseases and food allergies. On endoscopy, EoE patients were more frequently found to have rings, esophageal narrowing, linear furrows, white plaques, and decreased vascularity. The GERD patients more commonly had a hiatal hernia.
Table 1.
Clinical, endoscopic, and histologic characteristics*
| EoE cases (n = 54) |
GERD controls (n = 55) |
p value† | |
|---|---|---|---|
| Clinical characteristics | |||
| Mean age at biopsy (± SD) | 24.4 ± 18.0 | 34.0 ± 22.1 | 0.02 |
| Male subjects (n, %) | 37 (69) | 33 (60) | 0.35 |
| Caucasian subjects (n, %) | 44 (81) | 49 (91) | 0.34 |
| Symptoms (n, %)‡ | |||
| Dysphagia | 37 (70) | 15 (31) | < 0.001 |
| Food impaction | 13 (28) | 1 (2) | 0.001 |
| Heartburn | 18 (38) | 28 (56) | 0.07 |
| Chest pain | 3 (6) | 7 (15) | 0.17 |
| Abdominal pain | 13 (28) | 21 (45) | 0.09 |
| Nausea | 11 (24) | 16 (35) | 0.25 |
| Vomiting | 18 (38) | 17 (36) | 0.83 |
| Failure to thrive | 8 (18) | 5 (11) | 0.35 |
| Atopic disease (n, %) | |||
| Allergic rhinitis/dermatitis | 16 (35) | 5 (11) | 0.005 |
| Food allergy | 6 (18) | 1 (2) | 0.02 |
| Asthma | 12 (26) | 3 (6) | 0.01 |
| Endoscopic findings (n, %)‡ | |||
| Normal | 9 (18) | 17 (31) | 0.11 |
| Rings | 17 (33) | 4 (7) | 0.001 |
| Stricture | 6 (12) | 2 (4) | 0.11 |
| Narrowed esophagus | 8 (16) | 1 (2) | 0.01 |
| Linear furrows | 13 (25) | 0 (0) | < 0.001 |
| White plaques | 7 (14) | 0 (0) | 0.004 |
| Erosions | 2 (4) | 1 (2) | 0.51 |
| Decreased vascularity | 4 (8) | 0 (0) | 0.03 |
| Erosive esophagitis | 17 (33) | 17 (31) | 0.79 |
| Ulcerations | 1 (2) | 1 (2) | 0.96 |
| Hiatal hernia | 0 (0) | 19 (35) | < 0.001 |
| Histologic characteristics | |||
| Max eosinophil count# | |||
| Mean (eos/hpf ± SD) | 146 ± 122 | 20 ± 22 | < 0.001 |
| Histologic findings (n, %) | |||
| Degranulation present | 50 (94) | 23 (42) | < 0.001 |
| Microabscess present | 36 (68) | 6 (11) | < 0.001 |
| Eosinophil biopsy distribution | < 0.001 | ||
| Patchy | 17 (32) | 42 (88) | |
| Diffuse | 36 (68) | 6 (12) | |
| Spongiosis present | 49 (92) | 22 (40) | < 0.001 |
Missing data accounted for ≤ 14% of all observations with the following exceptions: failure to thrive (16%); the presence of allergic rhinitis or dermatitis (15%); and food allergy (27%). In all cases, missing data were non-differentially distributed between the EoE and GERD groups.
P values calculated with t-test for continuous variables and chi-square for categorical variables.
Patients may have had more than one symptom or endoscopic finding.
Determined from examination of 5 microscopy fields and calculated for a hpf area = 0.24 mm2.
On histologic examination, the maximum eosinophil count was higher in the EoE group compared to the GERD group (146 eos/hpf vs 20 eos/hpf; p < 0.001). EoE patients also had more eosinophil degranulation, microabscesses, and spongiosis (Table 1). As expected with the definition of the control group, esophageal eosinophilia was prominent in the GERD patients, mirroring the clinical situation in which EoE and GERD can confused.
Tryptase staining in cases and controls
There were significant differences in IHC staining between the case and control groups in both the quantitative and the qualitative measures (Table 2). The maximum density of tryptase positive mast cells was significantly higher in the EoE group as compared to the GERD group (162 vs 67; p < 0.001). Similarly, the qualitative staining intensity was significantly higher in the EoE group. While mast cells tended to have a basal location in both groups, they were more diffusely distributed throughout the entire biopsy specimen in the EoE group (41% vs 7%; p < 0.001). A graphic representation of the tryptase staining distributions (Figure 2) demonstrates that the groups have a substantially different distribution, with relatively little overlap. These results were unchanged even after restricting the control group to just those patients with erosive esophagitis found on upper endoscopy (data not shown).
Table 2.
Tryptase staining characteristics
| EoE cases (n = 54) |
GERD controls (n = 55) |
p value† | |
|---|---|---|---|
| Maximum tryptase density (masts/mm2)* | |||
| Mean (± SD, range) | 162 ± 87 (10–448) | 67 ± 54 (0–224) | < 0.001 |
| Median (IQR) | 152 (101–214) | 52 (31–86) | < 0.001 |
| Mean tryptase density* (masts/mm2) | |||
| Mean (± SD, range) | 106 ± 62 (7–267) | 39 ± 39 (0–182) | < 0.001 |
| Median (IQR) | 103 (63–141) | 26 (13–52) | < 0.001 |
| Qualitative staining (mean ± SD) | 2.0 ± 0.8 | 1.1 ± 0.6 | < 0.001 |
| Basal mast cell mucosal distribution (n, %) | 47 (87) | 50 (94) | 0.19 |
| Mast cell biopsy distribution | < 0.001 | ||
| Patchy | 32 (59) | 50 (93) | |
| Diffuse | 22 (41) | 4 (7) |
Tryptase density was determined from examination of 5 microscopy fields.
P values calculated with t-test or Wilcoxon rank-sum for continuous variables, and chi-square for categorical variables.
Figure 2.
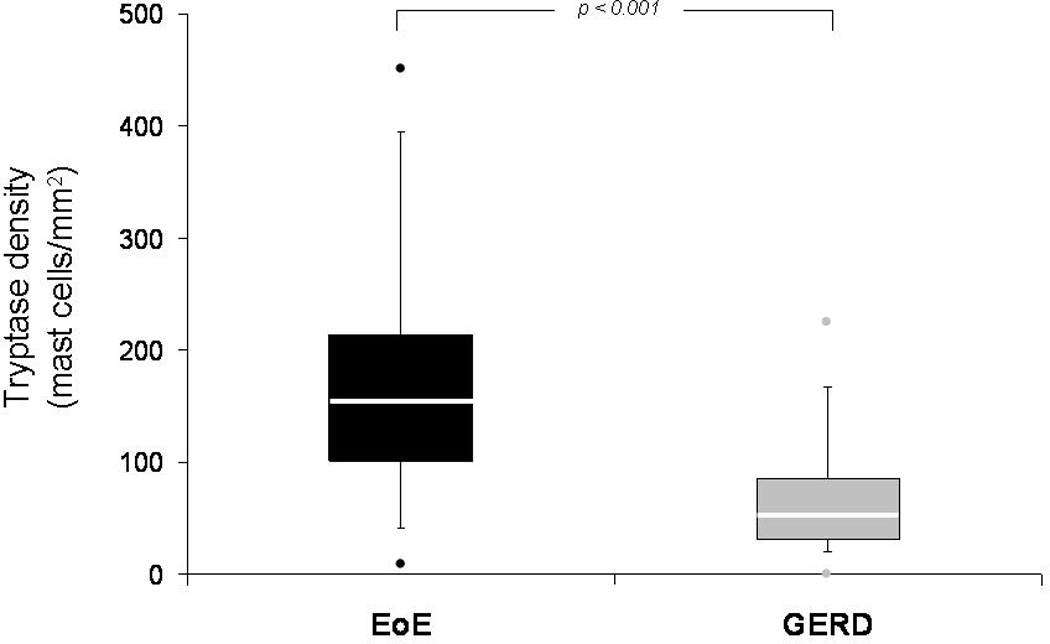
Box and whiskers plot of tryptase density (mast cells/mm2) in the EoE and GERD groups. The median value for each group is noted with the white line, the boxes represent the range of values from the 25th percentile to the 75th percentile, the ends of the whiskers represent the 10th and 90th percentile of values, and the dots are the maximum and minimum values. The Wilcoxon rank-sum test was used to compare medians, and there is a statistically significant difference between the groups (p < 0.001).
When the number of tryptase positive mast cells was compared with the tissue eosinophil density (Figure 3), there was only a weak (R2 = 0.09), though statistically significant, correlation.
Figure 3.
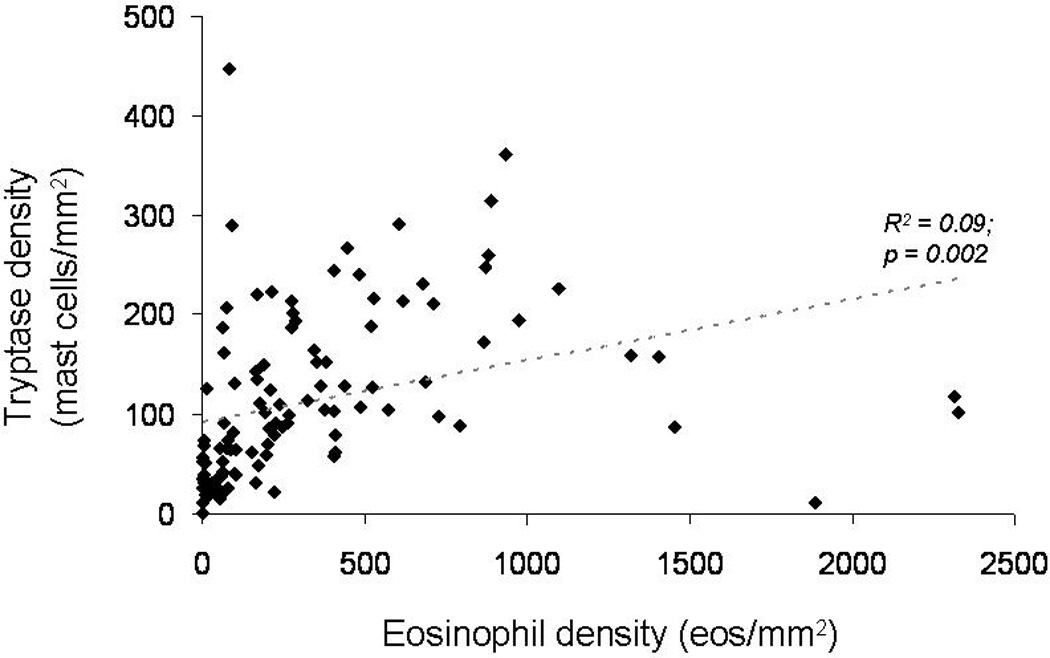
Relationship between tissue eosinophil density (eosinophils/mm2) and tryptase density (mast cells/mm2). There is only a weak correlation (R2 = 0.09) between the number of eosinophils and the number of mast cells
Tryptase staining for diagnosis of EoE
To determine the utility of tryptase staining for diagnosis of EoE, ROC curves were constructed (Figure 4). Using mast cell staining as the only parameter in the model yielded an AUC of 0.84 as compared to consensus diagnostic guidelines as the gold standard. The AUC for the combination of mast cell count and eosinophil count, but without any other clinical, endoscopic, or histologic features, was 0.96. The AUC for eosinophil count alone was 0.89. There was no difference between the AUC for mast cells alone and the AUC for eosinophils alone (p = 0.23), but there was a difference between the AUC for eosinophils and the AUC for the combination of mast cells and eosinophils (p = 0.004), as well as between the AUC for mast cells and the AUC for the combination of mast cells and eosinophils (p < 0.001). These results were unchanged even after restricting the control group to just those patients with erosive esophagitis (data not shown). When tryptase staining was added to a multivariable model containing additional predictive factors such as patient age, dysphagia, food allergy, the presence of rings, furrows, white plaques, or a hiatal hernia on endoscopy, the maximum eosinophil count, and degranulating eosinophils or eosinophilic microabscesses, the AUC also increased from 0.92 to 0.97, but this was not significant.
Figure 4.
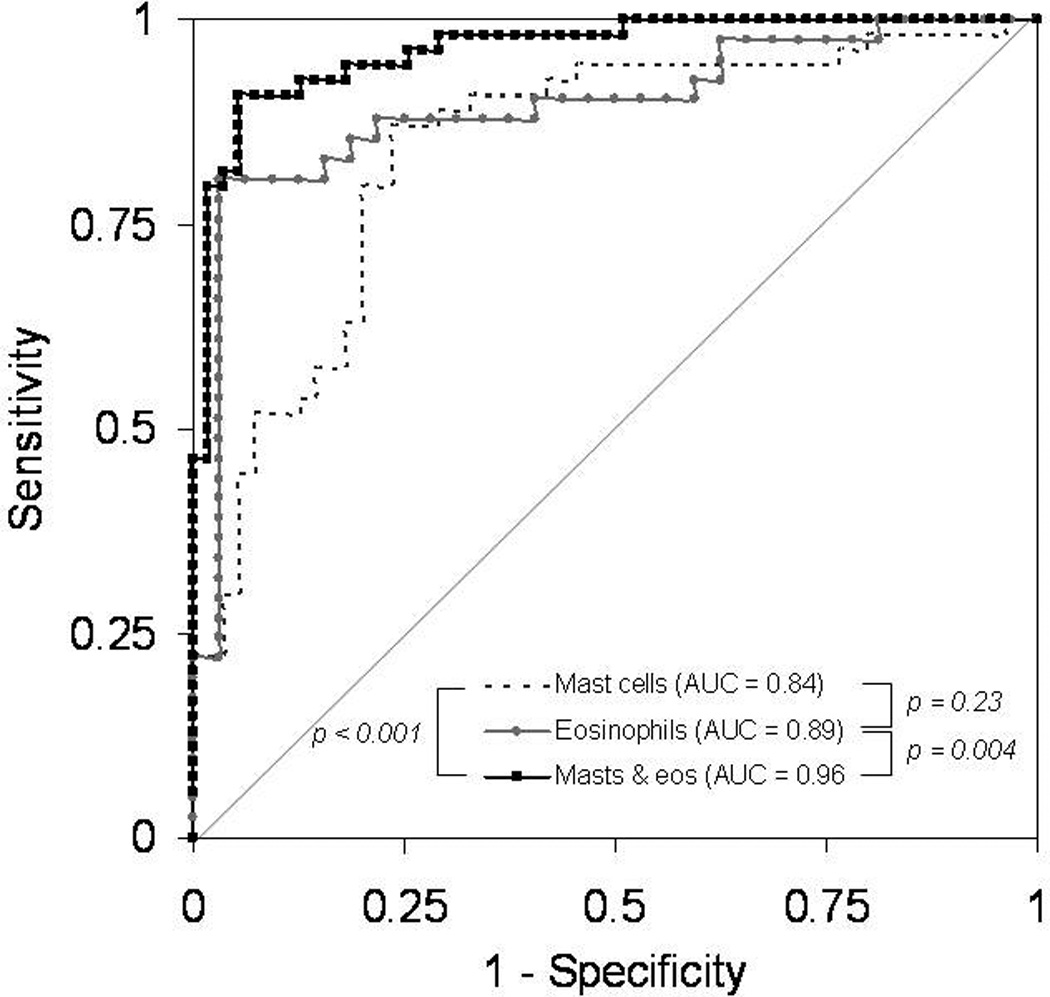
Receiver operating characteristic (ROC) curves for diagnosis of EoE using consensus guidelines as the gold standard.1 The area under the curve (AUC) for mast cell count alone (dotted black line) is 0.84. The AUC for eosinophil count alone (light grey line with circles) is 0.89. The AUC for the combination of mast cell count and eosinophil count (solid black line with squares), but without any other clinical, endoscopic, or histologic features, is 0.96. There was no difference between the AUC for mast cells alone and eosinophils alone (p = 0.23), but there was a difference between eosinophils and the combination of mast cells and eosinophils (p = 0.004), as well as between mast cells and the combination of mast cells and eosinophils (p < 0.001).
An analysis of the operating characteristics of tryptase staining and eosinophil counts can help to put the ROC analysis into a clinical context (Table 3). A cut-point of 96 mast cells/mm2 maximized the sensitivity (80%) and specificity (80%) of tryptase staining in this study population, with a corresponding positive and negative likelihood ratio of 4 and 0.25, respectively. For the eosinophil count that maximized these parameters, the results were similar, with a sensitivity of 80% and specificity of 84%. Sensitivity increased and specificity decreased if an eosinophil count of 15 eos/hpf was used for the cut-off. However, if mast cell density and eosinophil count were considered together, the sensitivity and specificity increased to 91% and 95%, respectively, with a positive and negative likelihood ratio of 18 and 0.09, respectively.
Table 3.
Operating characteristics of tryptase staining for diagnosis of EoE
| Tryptase density (96 mast cells/mm2)† |
Eosinophil count (50 eos/hpf)‡ |
Eosinophil count (15 eos/hpf)# |
Tryptase and eosinophils (96 cells/mm2; 50 eos/hpf) |
Tryptase and eosinophils (96 cells/mm2; 15 eos/hpf) |
|
|---|---|---|---|---|---|
| ROC AUC | 0.84 | 0.89 | 0.89 | 0.96 | 0.96 |
| Sensitivity (%) | 80 | 80 | 98 | 91 | 98 |
| Specificity (%) | 80 | 84 | 19 | 95 | 63 |
| Positive LR | 4 | 5 | 1.2 | 18 | 2.6 |
| Negative LR | 0.25 | 0.24 | 0.11 | 0.09 | 0.03 |
Abbreviations: ROC AUC = receiver operator characteristic area under the curve; LR = likelihood ratio; eos/hpf = eosinophils per high-power field.
Parameters were calculated for tryptase staining alone, eosinophil count alone, and tryptase staining with eosinophil count combined in comparison to consensus guidelines for diagnosis of EoE as the gold standard (1).
This is the tryptase density that maximizes sensitivity and specificity in this dataset.
This is the eosinophil count that maximizes sensitivity and specificity in this dataset. An eosinophil count of 50 eos/hpf equals an eosinophil density of 207 eos/mm2 assuming a hpf size of 0.24 mm2.
An eosinophil count of 15 eos/hpf equals an eosinophil density of 63 eos/mm2 assuming a hpf size of 0.24 mm2.
Discussion
The diagnosis of EoE is based on demonstrating the correct presentation of clinical, endoscopic, and histologic findings. Recent consensus guidelines have formalized the requirements for diagnosis, which were utilized as the gold standard in our study (1). In particular, competing causes of esophageal eosinophilia must be excluded. In many instances GERD is the most important differential diagnosis. The differentiation between GERD and EoE is one of the most challenging aspects of the diagnosis and management of EoE, because the clinical and pathologic findings of EoE are not specific and can overlap substantially with features of GERD (1–10).
In this study, we used a case-control design to compare staining for tryptase positive mast cells in a large group of EoE and GERD patients. The controls were specifically selected to have prominent inflammation, including eosinophilia, on their esophageal biopsies in order to mirror the clinical situation in which it can be difficult to distinguish EoE from GERD. There were several findings of note. First, the esophageal epithelial density of tryptase-positive mast cells was significantly higher in EoE patients compared with GERD patients. While this result was also true for the qualitative staining intensity, we feel that the utility of the tryptase staining technique will be in its quantitative application as this approach is likely less subjective. Second, there was only weak correlation between esophageal eosinophil and mast cell levels. This weak correlation is highly desirable in an additional test for EoE, since it suggests that analysis of mast cells could add diagnostic information not gained from simple eosinophil counts. Third, the presence of elevated numbers of mast cells in the esophageal epithelium was predictive of EoE case status without considering any additional clinical, endoscopic, or histologic information, and the combination of mast cell and eosinophil counts almost perfectly differentiated EoE from GERD.
How can these results be interpreted in the context of what is known about mast cells in the pathogenesis of EoE? EoE is felt to be related to an allergen exposure triggering a TH2 response in which IL-13 stimulates esophageal epithelial cells to produce eotaxin-3, which subsequently recruits eosinophils to the esophagus (25). When eosinophils are activated by IL-5 and eotaxin-3, they release major basic protein, which in turn activates mast cells (25–26). Once activated, mast cells produce IL-13, which can propagate esophageal eosinophilia and eosinophil activation. Mast cells also produce TGF-β, which has been implicated in esophageal fibrosis related to EoE (19–23). Blanchard and colleagues performed EoE transcriptome analysis demonstrating that mast cell-associated genes, including carboxypeptidase A3, the high-affinity IgE receptor, and mast cell tryptase-α, were upregulated in EoE, but similar to our finding, they showed only weak correlation (R2 = 0.18) between the eosinophil and mast cell counts (13). One could hypothesize that the eosinophil and mast cell counts need not be correlated, because a relatively small number of activated eosinophils could recruit a large number of mast cells. The same group has recently reported a more detailed analysis of the mast cell transcriptome, which in a small sample of patients, differentiated EoE patients from controls, and carboxypeptidase A3 was again implicated as a key gene (18).
Several other authors have demonstrated increased staining for mast cells in patients with EoE compared to those with GERD or normal controls. Straumann and colleagues first observed increased numbers of mast cells in 8 adult EoE patients compared to 3 normal controls (11), and Gupta and colleagues reported similar results in a small number of children (12). Kirch and colleagues examined 25 EoE patients, 22 GERD patients, and 22 healthy controls, all in a pediatric population (14), They found a count of 26 mast cells/hpf in the EoE group and 8 in the GERD group. Though they did not report the size of the microscope hpf, if we assume it to be 0.24 mm2, the density of tryptase positive cells would be 108 masts/mm2 in the EoE group and 33 in the GERD group, similar in magnitude to the results we report. Two additional studies in adults with EoE yielded comparable results (15–16). Despite this previous work, none of the prior investigations assessed the utility of tryptase staining for diagnosis of EoE. Given the crucial need for an easily performed assay to help differentiate EoE from GERD with mucosal eosinophilia, mast cell staining is attractive for its simplicity, excellent performance characteristics, and nominal correlation with eosinophil counts.
This study featured large numbers of well-characterized patients, quantitative analysis of IHC slides, and was focused on a highly relevant clinical question - the diagnostic utility of mast cell staining in a difficult to diagnose population. The study also has some limitations. First, there could be misclassification of cases and controls. Because we studied EoE patients that were previously extensively characterized and felt to be definitive cases (7), we feel that disease misclassification of EoE patients was minimal. Regardless, even if contamination occurred between the groups (GERD patients in the EoE group and vice versa), results should be biased towards the null, and the reported association between mast cell density and EoE diagnosis actually underestimated. The choice of this control group is also supported by the fact that our results were unchanged even when we limited the controls to those with definitive GERD as defined by the presence of erosive esophagitis on upper endoscopy. Second, because the study is from a single center, the findings may not be generalizable. While it is reassuring that features of this EoE population are quite similar to those reported from other centers (27–31), a case-control study design may provide an optimistic assessment of test accuracy and the use of tryptase staining for EoE will need to be validated in other populations before it can be adopted for routine use, and efforts to do so are underway. In addition, the use of a specific cut-point for tryptase density was for illustrative purposes to calculate sensitivity, specificity, and likelihood ratios in order to contextualize our results; we do not feel that this value should be adopted in clinical practice until further studies validate our findings. Third, there has been recent controversy concerning several possible relationships between GERD and EoE, whether it is appropriate to require exclusion of reflux to diagnose EoE, and possible anti-inflammatory effects of PPIs in patients with EoE (2, 32–33). Our single time point of analysis, as well as the poorly-understood nature of any common pathogenic factors in EoE and GERD, limits any conclusions about the utility of tryptase staining in subjects with hybrid conditions. Finally, our study design did not address the functional role of the mast cell, be it active or passive, in the pathogenesis of EoE. While the potential role of mast cells in the early pathogenesis of EoE is important and incompletely described, it can have utility as a biomarker for EoE whether it is an active player in pathogenesis or merely a passive bystander.
In conclusion, patients with EoE have substantially higher levels of tryptase positive mast cells in the esophageal epithelium compared to GERD patients with esophageal eosinophilia. Staining for mast cell tryptase may provide added diagnostic value because it is complementary to the eosinophil count and has utility for differentiating EoE from GERD. Therefore, should further work validate these results, adding mast cell tryptase to the diagnostic algorithm may improve upon the current diagnostic standards for EoE.
Study highlights.
What is current knowledge?
It can be challenging to differentiate eosinophilic esophagitis (EoE) and gastroesophageal reflux disease (GERD) on a clinical basis.
Mast cells have been implicated in EoE pathogenesis, and hold promise as a specific tissue marker of EoE.
What is new here?
Patients with EoE have higher levels of tryptase positive mast cells compared to GERD patients.
Mast cell tryptase may have utility as a diagnostic assay for EoE.
Acknowledgments
Financial support:
This work is funded, in part, by NIH award number KL2RR025746 from the National Center for Research Resources and a Junior Faculty Development Award from the American College of Gastroenterology.
The study sponsors had no role in the study design, collection, analysis, or interpretation of the data.
Abbreviations
- AUC
area under the curve
- EGD
esophagogastroduodenoscopy
- EoE
eosinophilic esophagitis
- eos/hpf
eosinophils per high-powered field
- GERD
gastroesophageal reflux disease
- HPF
high-powered field
- IHC
immunohistochemistry
- mm2
square millimeters
- LR
likelihood ratio
- PPI
proton-pump inhibitor
- ROC
receiver operator characteristic
- UNC
University of North Carolina
Footnotes
Data from this paper were presented during DDW 2010.
Guarantor of the article: Evan Dellon
Specific author contributions (all authors approved the final draft):
Dellon: study concept and design; data acquisition; analysis; interpretation; manuscript drafting/revision;
Chen: immunohistochemistry optimization and supervision; critical revision
Miller: immunohistochemistry optimization and supervision; critical revision
Fritchie: performed all eosinophil recounts; critical revision
Rubinas: performed all eosinophil recounts; critical revision
Woosley: performed all eosinophil recounts; critical revision
Shaheen: study concept and design; supervision; interpretation; critical revision
Potential competing interests:
None for any of the authors
References
- 1.Furuta GT, Liacouras CA, Collins MH, et al. Eosinophilic esophagitis in children and adults: a systematic review and consensus recommendations for diagnosis and treatment. Gastroenterology. 2007;133:1342–1363. doi: 10.1053/j.gastro.2007.08.017. [DOI] [PubMed] [Google Scholar]
- 2.Spechler SJ, Genta RM, Souza RF. Thoughts on the complex relationship between gastroesophageal reflux disease and eosinophilic esophagitis. Am J Gastroenterol. 2007;102:1301–1306. doi: 10.1111/j.1572-0241.2007.01179.x. [DOI] [PubMed] [Google Scholar]
- 3.Noel RJ, Tipnis NA. Eosinophilic esophagitis -- a mimic of GERD. Int J Pediatr Otorhinolaryngol. 2006;70:1147–1153. doi: 10.1016/j.ijporl.2006.01.012. [DOI] [PubMed] [Google Scholar]
- 4.Sgouros SN, Bergele C, Mantides A. Eosinophilic esophagitis in adults: a systematic review. Eur J Gastroenterol Hepatol. 2006;18:211–217. doi: 10.1097/00042737-200602000-00015. [DOI] [PubMed] [Google Scholar]
- 5.Dellon ES, Aderoju A, Woosley JT, et al. Variability in diagnostic criteria for eosinophilic esophagitis: A systematic review. Am J Gastro. 2007;102:2300–2313. doi: 10.1111/j.1572-0241.2007.01396.x. [DOI] [PubMed] [Google Scholar]
- 6.Molina-Infante J, Ferrando-Lamana L, Mateos-Rodriguez JM, et al. Overlap of reflux and eosinophilic esophagitis in two patients requiring different therapies: A review of the literature. World J Gastroenterol. 2008;14:1463–1466. doi: 10.3748/wjg.14.1463. [DOI] [PMC free article] [PubMed] [Google Scholar]
- 7.Dellon ES, Gibbs WB, Fritchie KJ, et al. Clinical, endoscopic, and histologic findings distinguish eosinophilic esophagitis from gastroesophageal reflux disease. Clin Gastroenterol Hepatol. 2009;104:2695–2703. doi: 10.1016/j.cgh.2009.08.030. [DOI] [PMC free article] [PubMed] [Google Scholar]
- 8.Ngo P, Furuta GT, Antonioli DA, et al. Eosinophils in the esophagus--peptic or allergic eosinophilic esophagitis? Case series of three patients with esophageal eosinophilia. Am J Gastroenterol. 2006;101:1666–1070. doi: 10.1111/j.1572-0241.2006.00562.x. [DOI] [PubMed] [Google Scholar]
- 9.Rodrigo S, Abboud G, Oh D, et al. High intraepithelial eosinophil counts in esophageal squamous epithelium are not specific for eosinophilic esophagitis in adults. Am J Gastroenterol. 2008;103:435–442. doi: 10.1111/j.1572-0241.2007.01594.x. [DOI] [PubMed] [Google Scholar]
- 10.Dellon ES, Farrell TM, Bozymski EM, et al. Diagnosis of eosinophilic esophagitis after fundoplication for 'refractory reflux': implications for preoperative evaluation. Dis Esophagus. 2009 Oct 26; doi: 10.1111/j.1442-2050.2009.01019.x. [Epub ahead of print] [DOI] [PubMed] [Google Scholar]
- 11.Straumann A, Bauer M, Fischer B, et al. Idiopathic eosinophilic esophagitis is associated with a T(H)2-type allergic inflammatory response. J Allergy Clin Immunol. 2001;108:954–961. doi: 10.1067/mai.2001.119917. [DOI] [PubMed] [Google Scholar]
- 12.Gupta SK, Fitzgerald JF, Kondratyuk T, et al. Cytokine expression in normal and inflamed esophageal mucosa: a study into the pathogenesis of allergic eosinophilic esophagitis. J Pediatr Gastroenterol Nutr. 2006;42:22–26. doi: 10.1097/01.mpg.0000188740.38757.d2. [DOI] [PubMed] [Google Scholar]
- 13.Blanchard C, Wang N, Stringer KF, et al. Eotaxin-3 and a uniquely conserved gene-expression profile in eosinophilic esophagitis. J Clin Invest. 2006;116:536–547. doi: 10.1172/JCI26679. [DOI] [PMC free article] [PubMed] [Google Scholar]
- 14.Kirsch R, Bokhary R, Marcon MA, et al. Activated mucosal mast cells differentiate eosinophilic (allergic) esophagitis from gastroesophageal reflux disease. J Pediatr Gastroenterol Nutr. 2007;44:20–26. doi: 10.1097/MPG.0b013e31802c0d06. [DOI] [PubMed] [Google Scholar]
- 15.Lucendo AJ, Navarro M, Comas C, et al. Immunophenotypic characterization and quantification of the epithelial inflammatory infiltrate in eosinophilic esophagitis through stereology: an analysis of the cellular mechanisms of the disease and the immunologic capacity of the esophagus. Am J Surg Pathol. 2007;31:598–606. doi: 10.1097/01.pas.0000213392.49698.8c. [DOI] [PubMed] [Google Scholar]
- 16.Mueller S, Neureiter D, Aigner T, et al. Comparison of histological parameters for the diagnosis of eosinophilic oesophagitis versus gastro-oesophageal reflux disease on oesophageal biopsy material. Histopathology. 2008;53:676–684. doi: 10.1111/j.1365-2559.2008.03187.x. [DOI] [PubMed] [Google Scholar]
- 17.Chehade M, Sampson HA, Morotti RA, et al. Esophageal subepithelial fibrosis in children with eosinophilic esophagitis. J Pediatr Gastroenterol Nutr. 2007;45:319–328. doi: 10.1097/MPG.0b013e31806ab384. [DOI] [PubMed] [Google Scholar]
- 18.Abonia JP, Blanchard C, Butz BB, et al. Involvement of mast cells in eosinophilic esophagitis. J Allergy Clin Immunol. 2010 doi: 10.1016/j.jaci.2010.04.009. [DOI] [PMC free article] [PubMed] [Google Scholar]
- 19.Mishra A, Rothenberg ME. Intratracheal IL-13 induces eosinophilic esophagitis by an IL-5, eotaxin-1, and STAT6-dependent mechanism. Gastroenterology. 2003;125:1419–1427. doi: 10.1016/j.gastro.2003.07.007. [DOI] [PubMed] [Google Scholar]
- 20.Blanchard C, Mingler MK, Vicario M, et al. IL-13 involvement in eosinophilic esophagitis: transcriptome analysis and reversibility with glucocorticoids. J Allergy Clin Immunol. 2007;120:1292–1300. doi: 10.1016/j.jaci.2007.10.024. [DOI] [PubMed] [Google Scholar]
- 21.Aceves SS, Newbury RO, Dohil R, et al. Esophageal remodeling in pediatric eosinophilic esophagitis. J Allergy Clin Immunol. 2007;119:206–212. doi: 10.1016/j.jaci.2006.10.016. [DOI] [PubMed] [Google Scholar]
- 22.Lucendo AJ, Bellon T, Lucendo B. The role of mast cells in eosinophilic esophagitis. Pediatr Allergy Immunol. 2009;20:512–518. doi: 10.1111/j.1399-3038.2008.00798.x. [DOI] [PubMed] [Google Scholar]
- 23.Wershil BK. Exploring the role of mast cells in eosinophilic esophagitis. Immunol Allergy Clin North Am. 2009;29:189–195. doi: 10.1016/j.iac.2008.09.006. [DOI] [PubMed] [Google Scholar]
- 24.Dellon ES, Fritchie KJ, Rubinas TC, et al. Inter- and intra-observer reliability and validation of a new method for determination of eosinophil counts in patients with esophageal eosinophilia. Dig Dis Sci. 2009 Oct 15; doi: 10.1007/s10620-009-1005-z. [Epub ahead of print] [DOI] [PMC free article] [PubMed] [Google Scholar]
- 25.Rothenberg ME. Biology and treatment of eosinophilic esophagitis. Gastroenterology. 2009;137:1238–1249. doi: 10.1053/j.gastro.2009.07.007. [DOI] [PMC free article] [PubMed] [Google Scholar]
- 26.Rothenberg ME, Hogan SP. The eosinophil. Annu Rev Immunol. 2006;24:147–174. doi: 10.1146/annurev.immunol.24.021605.090720. [DOI] [PubMed] [Google Scholar]
- 27.Straumann A, Spichtin HP, Grize L, et al. Natural history of primary eosinophilic esophagitis: a follow-up of 30 adult patients for up to 11.5 years. Gastroenterology. 2003;125:1660–1669. doi: 10.1053/j.gastro.2003.09.024. [DOI] [PubMed] [Google Scholar]
- 28.Liacouras CA, Spergel JM, Ruchelli E, et al. Eosinophilic esophagitis: a 10-year experience in 381 children. Clin Gastroenterol Hepatol. 2005;3:1198–1206. doi: 10.1016/s1542-3565(05)00885-2. [DOI] [PubMed] [Google Scholar]
- 29.Gonsalves N, Policarpio-Nicolas M, Zhang Q, et al. Histopathologic variability and endoscopic correlates in adults with eosinophilic esophagitis. Gastrointest Endosc. 2006;64:313–319. doi: 10.1016/j.gie.2006.04.037. [DOI] [PubMed] [Google Scholar]
- 30.Prasad GA, Talley NJ, Romero Y, et al. Prevalence and Predictive Factors of Eosinophilic Esophagitis in Patients Presenting With Dysphagia: A Prospective Study. Am J Gastroenterol. 2007;102:2627–2632. doi: 10.1111/j.1572-0241.2007.01512.x. [DOI] [PubMed] [Google Scholar]
- 31.Veerappan GR, Perry JL, Duncan TJ, et al. Prevalence of Eosinophilic Esophagitis in an Adult Population Undergoing Upper Endoscopy: A Prospective Study. Clin Gastroenterol Hepatol. 2009;7:420–426. doi: 10.1016/j.cgh.2008.10.009. [DOI] [PubMed] [Google Scholar]
- 32.Merwat SN, Spechler SJ. Might the use of acid-suppressive medications predispose to the development of eosinophilic esophagitis? Am J Gastroenterol. 2009;104:1897–1902. doi: 10.1038/ajg.2009.87. [DOI] [PubMed] [Google Scholar]
- 33.Kedika RR, Souza RF, Spechler SJ. Potential anti-inflammatory effects of proton pump inhibitors: a review and discussion of the clinical implications. Dig Dis Sci. 2009;54:2312–2317. doi: 10.1007/s10620-009-0951-9. [DOI] [PMC free article] [PubMed] [Google Scholar]