

Abstract
The circadian rhythm of core body temperature is associated with widespread physiological effects. However, studies with other more practical temperature measures, such as wrist (WT) and proximal temperatures, are still scarce. The aim of this study was to investigate whether obesity is associated with differences in mean WT values or in its daily rhythmicity patterns. Daily patterns of cortisol, melatonin, and different metabolic syndrome (MetS) features were also analyzed in an attempt to clarify the potential association between chronodisruption and MetS. The study was conducted on 20 normal-weight women (age: 38 ± 11 yrs and BMI: 22 ± 2.6 kg/m2) and 50 obese women (age: 42 ± 10 yrs and BMI: 33.5 ± 3.2 kg/m2) (mean ± SEM). Skin temperature was measured over a 3-day period every 10 min with the “Thermochron iButton.” Rhythmic parameters were obtained using an integrated package for time-series analysis, “Circadianware.” Obese women displayed significantly lower mean WT (34.1°C ± 0.3°C) with a more flattened 24-h pattern, a lower-quality rhythm, and a higher intraday variability (IV). Particularly interesting were the marked differences between obese and normal-weight women in the secondary WT peak in the postprandial period (second-harmonic power [P2]), considered as a marker of chronodisruption and of metabolic alterations. WT rhythmicity characteristics were related to MetS features, obesity-related proteins, and circadian markers, such as melatonin. In summary, obese women displayed a lower-quality WT daily rhythm with a more flattened pattern (particularly in the postprandial period) and increased IV, which suggests a greater fragmentation of the rest/activity rhythm compared to normal-weight women. These 24-h changes were associated with higher MetS risk.
Keywords: Abdominal obesity, Circadian, Core temperature circadian rhythm, Cortisol, Melatonin, Metabolic Syndrome, Obesity, Skin temperature
INTRODUCTION
The daily life of any individual is characterized by a well-defined rhythm determined by the circadian system (Duguay & Cermakian, 2009; Moore-Ede & Sulzman, 1981). This ingrained rhythm facilitates the coordination of the biological processes with external time cues for proper interaction and synchronization with the external environment (Waterhouse & DeCousey, 2004). The current knowledge supports the hypothesis that disturbances of the circadian system may have significant biological consequences (Marcheva et al., 2009), most probably due to the desynchronization of different organ- or pathway-specific circadian rhythms (Garaulet & Madrid, 2010; Garaulet et al., 2010a).
Metabolic syndrome (MetS) identifies a cluster of health-risk factors resulting from the impairment of several metabolic pathways leading to a major increase in cardiovascular disease risk (Eckel et al., 2010). Behavioral factors associated with chronodisruption (i.e., shift-work, sleep deprivation, and exposure to bright light at night) are often described as contributors to MetS (Garaulet et al., 2010b). However, despite this knowledge, few studies have examined specifically the circadian rhythm in obese subjects and its implications for the development of MetS. The most commonly used circadian measures include salivary melatonin, cortisol, urinary 6-sulfatoximelatonin, actimetry, and body temperatures (Cornelissen et al., 1999; Focan, 1995; Halberg et al., 2006; Lewy & Sack, 1989). Specifically, the circadian rhythm of core temperature is associated with widespread physiological effects, including the regulation of sleep-wake cycles (Krauchi, 2002; Reilly et al., 1997), and it has been correlated with physical (Waterhouse et al., 2005) and mental (Dijk & Czeisler, 1995) performance. However, alternative evidence indicates that sleepiness may be more closely associated with increased peripheral skin temperature than with decreased core temperature (Campbell & Broughton, 1994; Krauchi, 2007; Zulley et al., 1981). Indeed, skin temperature affects sleep-regulating areas in the brain (Van Someren, 2000, 2006), and it could be used as a simple and reliable measurement to evaluate circadian rhythmicity (Sarabia et al., 2008). The aim of the current study was to define whether obese and non-obese women show significant differences in circadian patterns using peripheral skin temperature and to relate those differences to variability in cortisol, melatonin, and MetS features. This information could provide further understanding of the connections between chronodisruption, obesity, and associated pathologies.
METHODS
Subjects and Assessment of Their Clinical Characteristics
All research methods and procedures were performed in accordance with the Helsinki Declaration of Human Studies and the ethical standards of the Journal (Portaluppi et al., 2010). The study was approved by the Ethical Committee of the University of Murcia, and all participants signed an informed consent document. The evaluation of obesity was carried out according to the criteria proposed by the Spanish Society for the Study of Obesity in 2007 (Salas-Salvadó et al., 2007). All subjects came from the city of Murcia, located in the southeast of Spain on the coast of the Mediterranean Sea. Subjects on therapeutic diet, under treatment with blood pressure, glucose, or lipid-lowering medication, or who had a diagnosis of diabetes mellitus, chronic renal failure, or hepatic diseases were excluded. Body weight was determined in barefooted subjects wearing light clothes using a digital scale accurate to the nearest 0.1 kg. Height was measured using a Harpenden digital stadiometer (rank, 0.7–2.05). The subject was positioned upright, relaxed, and with the head in the Frankfurt plane. Height and weight measurements were obtained at the same time of day.
Total body fat was measured by bioelectrical impedance, using TANITA TBF-300 (Tanita Corporation of America, Arlington Heights, IL, USA) equipment. Subjects were requested not to drink liquids during the 2 h before the measurement. Body fat distribution was assessed by the measurement of several circumferences and skin folds in the upright position: waist circumference, at the level of the umbilicus, and hip circumference, and the widest circumference over the greater trochanters (Ferrario et al., 1995). Sagittal trunk diameter was determined, with the patient in a recumbent position, as the distance between the examination table and the highest point of the abdomen (Kahn & Williamson, 1993; Kvist et al., 1988; Risérus et al., 2004).
Physical Activity (PA) Questionnaire
To assess PA during the last 7 days, the International Physical Activity Questionnaire (IPAQ) was administered with the help of a dietician to ensure a proper and complete understanding by the participants. The IPAQ was developed for adults between 18 and 65 yrs of age, assessing the different domains of PA (work, transport, house/garden, and leisure time). It is known to be a valid and reliable instrument to measure PA at the population level (Craig et al., 2003). For each of the four domains, total METs (metabolic equivalents) per minute and week were computed for walking and for moderate and vigorous PA based on the guidelines for data processing and analyses of the IPAQ (http://www.ipaq.ki.se/ipaq.htm). Total activity was computed as the sum of the activities at different intensities for a 1-wk period.
Biochemical Analyses and Blood Pressure Measurements
Blood glucose concentration was determined at two time points for each patient. Subjects performed their own measurements. The first sample was obtained in the morning following an overnight fast, and the second sample was taken on another day, before dinner, after 8 h of fasting. Blood glucose test strips were assessed using Glucometer Elite. The linearity of this test ranges from 20 to 600 mg/100 mL (1.1 to 33.3 mmol/L). Other biochemical analyses were determined using venous blood obtained by venipuncture after an overnight fast. Plasma samples were stored at −80°C and analyzed as a single batch. Blood collection, plasma separation and processing, and biochemical analyses for plasma lipids (including triglycerides, total cholesterol, high-density lipoprotein [HDL] cholesterol, and low-density lipoprotein [LDL] cholesterol) were performed. Plasma adiponectin levels were measured using a radioimmunoassay (RIA) from Millipore Laboratory (Billerica, MA, USA) with a sensitivity of 2 ng/mL and intra-assay coefficient of variation (CV) of 6.6% at 3.0 μg/mL. Plasma leptin and ghrelin levels were measured using a RIA from Mediagnost Laboratory (Reutlinge, Germany) with a sensitivity of 0.1 ng/mL and intra-assay CV of 8.3% at 2 ng/mL and intra-assay CV of 4.0% at 1.2 μg/L, respectively. A gamma counter (DPC Gambyt) was used for the quantification of these hormones. Blood pressure measurements were performed before eating (14:00 h) and before dinner (21:00 h) for 1 wk on alternate days, using an Omron RX3 wrist blood pressure monitor (OMRON Electronics Iberia SA, Madrid, Spain).
Salivary Cortisol and Melatonin Measurements
Saliva for cortisol measurements was collected during the workweek using the Salivette system (Sarstedt, Barcelona, Spain) (Kirschbaum & Hellhammer, 1994). Samples were obtained in the morning (09:00 h), before lunch (14:00 h), and before bedtime (23:00 h). Cortisol was measured by radioimmunoassay (RIA) (IZASA, Barcelona, Spain) with a detection limit of 0.2 nmol/L. The intra- and interassay coefficient of variances was 4.0% for levels above and 10.0% for levels below 0.4 nmol/L.
Samples for the measurement of salivary melatonin were collected before lunch (14:00 h) and at midnight (00:00 h). All samples were maintained refrigerated at 4°C. Salivary melatonin levels were determined by radioimmunoassay (RIA) using a melatonin direct RIA kit purchased from IZASA, following manufacturer’s instructions. The intra- and interassay precision was 6.7% and 10.4%, respectively.
Temperature Measurement
Wrist temperature rhythm was assessed continuously for 3 days using a temperature sensor (Thermochron iButton DS1921H, Dallas, Maxim) with a sensitivity of 0.1°C and programmed to sample every 10 min. It was attached to a double-sided cotton sport wrist band, and the sensor surface was placed over the inside of the wrist on the radial artery of the nondominant hand, as previously described by Sarabia et al. (2008). The information stored in the iButton was transferred through an adapter (DS1402D-DR8; IDC, Spain) to a personal computer using iButton Viewer v. 3.22 (Dallas Semiconductor MAXIM software provided by the manufacturer). Given the very low subcutaneous fat present in the wrist area, no artifactual reading differences were expected between obese and normal-weight women. Data were recorded during the months of March to May and September to November, with ambient temperatures ranging between 9.5°C and 25°C, mean 17.2°C (data obtained from the Centre for Statistics of Murcia), to minimize the influence of extreme environmental temperatures on WT readings.
Daily Rhythm Analysis
Temperature data were first processed to eliminate erroneous measurements, such as those produced by temporarily removing the sensor. To facilitate this task, an automatic rejection procedure was applied, using the rate of change of all subsequent single-channel data points as the main criterion to detect and exclude extreme temperature fluctuations, as previously described (Van Marken et al., 2006).
Cosinor analysis (Díez Noguera, 1999) was used to characterize the WT rhythm, calculating its mesor (mean value of temperature rhythm fitted to a cosine function), amplitude (difference between the maximum [or minimum] value of the cosine function and mesor), acrophase (timing of the maximum value of the cosine fitted curve relative to local 00:00 h), maximum and minimum values of temperature, and Rayleigh test. This test provides an r vector with its origin at the center of a circumference of radius 1. The r vector (between 0 and 1) is proportional to the degree of phase homogeneity during the period analyzed and can be considered to be a measure of the rhythm’s phase stability during successive days.
WT rhythms were also analyzed by nonparametric analysis (Van Someren et al., 1998), including
-
(a)
Interdaily stability (IS): rhythm stability over different days; it varied between 0 for Gaussian noise to 1 for perfect stability, where the rhythm repeated itself exactly day after day.
-
(b)
Intradaily variability (IV): fragmentation of the rhythm; its values oscillated between 0 (when the wave was perfectly sinusoidal) and 2 (Gaussian noise).
-
(c)
5 h of maximum temperature: average of measurements made at 10-min intervals for the 5 h with the maximum temperature (M5) and its respective timing (TM5).
-
(d)
10 h of minimum temperature: average of measurements made at 10-min intervals for the 10 h with the minimum temperature (L10) and its respective timing (TL10).
-
(e)
Relative amplitude (RA): difference between M5 and L10 divided by the sum of M5 and L10, as previously published (Van Someren et al., 1999).
Other parameters used to characterize the WT rhythm included
-
(f)
Percentage of rhythmicity (PR): percentage of variance of data explained by the sinusoidal function.
-
(g)
First-harmonic power (P1): amplitude of the 24-h rhythm.
-
(h)
Second-harmonic power (P2): amplitude of the 12-h rhythm.
-
(i)
Ultradian rhythmicity: sum of the power content of the first 12 harmonics minus the power of the first harmonic (from P2 to P12).
-
(j)
Relationship between first harmonic and the accumulated power from P2 to P12 harmonics (P1/P2–P12): this index shows the relative importance of circadian over ultradian rhythmicity.
All of these rhythmic parameters were obtained using an integrated package for time-series analysis, “Circa-dianware” (Ortiz-Tudela et al., 2010). In addition, scores were correlated to parametric tests, such as the power content of the first harmonic and percentage of variance explained by the rhythm in Cosinor analysis, performed by the program El Temps (Díez Noguera, 1999).
Statistical Analysis
Factor Analysis
Factor analysis was applied to accomplish three goals: (1) to determine whether the large number of variables evaluated could be represented by a smaller number of underlying patterns or factors; (2) to determine the factors contributing to the observed variance; and (3) to reduce the variance in the population data matrix. A factor with a high eigen value accounts for a substantial amount of variance. Factor analysis identifies patterns, or factors, that have eigen values >1. An orthogonal rotation method was used for this analysis. Gamma was preassigned to 1 because varimax rotation was performed. Rotated factor loadings (patterns) indicate coefficients of the factor after rotation and show the degree to which a given variable is represented by a particular factor. The cutoff value used to assess relevance of loadings was 0.25. Factor analysis was applied in two different steps to avoid possible confusion that could arise from including too many variables at once. Step 1 introduced the WT variables and obesity and step 2 introduced the features associated with MetS (Alberti et al., 2007). Since all the variables analyzed were biologically based, a Gaussian distribution was assumed.
Correlation Analyses
As a second approach to minimize multiple comparisons, we selected only those temperature circadian variables that explained the highest variability. Specifically, we considered a subset of rhythmicity and amplitude variables (F1 column of Table 2) and also all of the variables related to obesity (P2, maximum value, and intra-daily variability) as presented in Table 2. Using Pearson correlation analysis, we evaluated the potential associations between these selected temperature variables and plasma obesity-related proteins, such as leptin, ghrelin, and adiponectin. Relationships with circadian markers, such as daily melatonin fluctuations, were also assessed.
TABLE 2.
Factor analysis incorporating obesity and rhythmic characteristics of wrist temperature
| F1 | F2 | F3 | F4 | |
|---|---|---|---|---|
| Percentage of rhythmicity (PR) | 0.861 | |||
| Amplitude | 0.855 | |||
| First-harmonic power (P1) | 0.823 | |||
| Relative amplitude (RA) | 0.728 | |||
| Interdaily stability (IS) | 0.690 | |||
| (P1/P2–P12) | 0.650 | |||
| Rayleigh | 0.566 | |||
| Mesor | −0.951 | |||
| L10 | −0.867 | |||
| M5 | −0.625 | |||
| Acrophase | 0.934 | |||
| Time L10 | 0.888 | |||
| Time M5 | 0.809 | |||
| Obesity | −0.870 | |||
| Second-harmonic power (P2) | 0.599 | |||
| Intradaily variability (IV) | −0.532 | |||
| Maximum value | 0.485 | |||
| % total variability | 29.0 | 20.8 | 20.3 | 10.9 |
Four factors explained 81% of the total variance. Factors with a % of total variability <5% are not shown. Factors loading <0.25 were not recorded.
(P1/P2–P12) = relation between first harmonic and the accumulated power from P2 to P12 harmonics.
Temperature Chronogram Analysis
In order to assess statistical differences between normal-weight and obese women in the temperature chronogram (Figure 1) a repeated-measures analysis of variance (ANOVA) was performed for the group of women (global ANOVA, p for obesity influence), the kinetics of the response (p for time), and the interaction of both factors (obesity × time). When statistical differences were found by the repeated-measures ANOVA, a multiple-comparison test, adjusted by the least significant difference, was applied to identify differences between the two groups of women for each timepoint of extraction.
FIGURE 1.
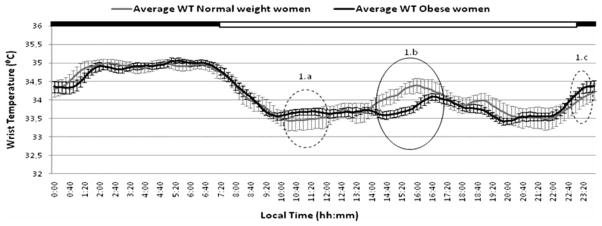
Daily variability in average wrist temperatures recorded over a 3-day period in obese and normal-weight subjects. The black bar at the top indicates the typical Spanish sleeping period (from 23:00 to 08:00 h). Those sections of the graph with significant differences (p < .05) between obese and normal-weight women are encircled with a solid line. Sections with differences that did not reach statistical significance are encircled with a dotted line.
RESULTS
The clinical features of the women studied are reported in Table 1. As expected, the anthropometric characteristics and plasma lipids differed significantly between the normal-weight and obese women, as did the total physical activity. Specifically, obese women performed less physical activity during leisure time and walked less during the week. Interestingly, the daily variability of both circadian markers of melatonin and cortisol was significantly higher in the normal-weight than in the obese women.
TABLE 1.
Clinical characteristics of the population studied
| Normal-weight women (N = 20) | Obese women (N = 50) | p values | |
|---|---|---|---|
| Age (yr) | 38 ± 11 | 42 ± 9 | 0.113 |
| Weight (kg) | 58.3 ± 8.8 | 85.6 ± 10.8 | < 0.001 |
| Height (cm) | 162 ± 0.08 | 160 ± 0.06 | 0.135 |
| BMI (kg/m2) | 21.9 ± 2.60 | 33.5 ± 3.20 | < 0.001 |
| Body fat (%) | 25.5 ± 7.0 | 41.7 ± 5.1 | < 0.001 |
| WC (cm) | 74.7 ± 8.4 | 93.6 ± 11.1 | < 0.001 |
| WHR | 0.82 ± 0.05 | 0.96 ± 0.08 | < 0.001 |
| Sagittal diameter (cm) | 17.8 ± 2.4 | 23.5 ± 3.5 | < 0.001 |
| Physical activity (questionnaire) | |||
| Total physical activity (METs) (min/wk) | 3635 ± 2220 | 2701 ± 2572 | 0.023 |
| Leisure time (METs) (min/wk) | 1209 ± 1225 | 398 ± 513 | 0.004 |
| Walking (METs) (min/wk) | 1329 ± 878 | 728 ± 699 | < 0.001 |
| Biochemical and blood pressure measurements | |||
| Triglycerides (mg/dL) | 64 ± 20 | 101 ± 41 | < 0.001 |
| Cholesterol (mg/dL) | 143 ± 38 | 190 ± 34 | < 0.001 |
| HDL cholesterol (mg/dL) | 57.1 ± 13.8 | 48.3 ± 12.0 | 0.009 |
| LDL cholesterol (mg/dL) | 70.0 ± 36.4 | 121.0 ± 30.7 | < 0.001 |
| Glucose (mmol/L) | 92.6 ± 15.2 | 96.6 ± 23.3 | 0.483 |
| Cortisol (morning/evening ratio) | 4.59 ± 0.57 | 3.27 ± 0.70 | < 0.001 |
| Melatonin (midnight/midday ratio) | 2.85 ± 1.13 | 1.85 ± 0.87 | < 0.001 |
| Glucose (evening/morning ratio) | 1.09 ± 0.12 | 1.03 ± 0.20 | 0.126 |
| Systolic blood pressure (evening/morning ratio) | 0.84 ± 0.29 | 1.16 ± 0.44 | < 0.001 |
| Diastolic blood pressure (evening/morning ratio) | 0.70 ± 0.05 | 0.87 ± 0.13 | < 0.001 |
| Leptin (ng/mL) | 8.1 ± 5.3 | 33.0 ± 15.8 | < 0.001 |
| Ghrelin (mmol/L) | 933 ± 403 | 412 ± 191 | < 0.001 |
| Adiponectin (μg/mL) | 5.3 ± 1.1 | 3.3 ± 1.3 | < 0.001 |
Data are presented as means ± SD. p values were calculated using Student’s t test to compare normal-weight versus obese women. Bold faces represent significant correlations. Significant differences (p < .05) are shown in bold.
BMI = body mass index; WC = waist circumference; HC = hip circumference; WHR = waist to hip ratio; METs = metabolic equivalents (min/wk) HDL = high-density lipoprotein; LDL = low-density lipoprotein.
The mean WT chronograms in both obese and control women are represented in Figure 1. Both groups exhibited similar daily WT patterns, characterized by an increase before the time of lights-off at bedtime, a nocturnal steady state with high temperatures, and a pronounced drop after arising in the morning. Obese women showed a transient decrease after the morning arising, whereas in normal-weight women this decrease tended to be sharper (Figure 1a). In contrast, before the lights-off time, the situation was reversed in that the decrease was sharper in obese women (Figure 1c). However, in both cases, when analysis of repeated measurements was performed, no statistical significance was found between obese and normal-weight women in these two segments of the curve. Nevertheless, whereas in normal-weight women there was a marked secondary WT peak in the postprandial period, this peak was less pronounced in obese women (Figure 1b). In this case, when analysis of repeated measurements was performed, differences were statistically significant (p = .02). In general, the daily rhythms of obese women appeared to be more flattened, particularly during the afternoon and evening hours.
Factor Analysis
The WT daily chronogram (Figure 1) was further analyzed using a time-series analysis software (Ortiz-Tudela et al., 2010) in conjunction with factor analysis to assess (a) which temperature variables explained the greatest degree of variability among subjects; (b) which variables were correlated with obesity (Table 2); and (c) which variables were correlated with MetS features (Table 3).
TABLE 3.
Factor analysis incorporating metabolic syndrome features and characteristics of wrist temperature rhythm
| F1 | F2 | F3 | F4 | F5 | |
|---|---|---|---|---|---|
| Amplitude | 0.919 | ||||
| First-harmonic power (P1) | 0.897 | ||||
| Percentage of rhythmicity (PR) | 0.845 | ||||
| Relative amplitude 1 (RA1) | 0.832 | ||||
| Relation between 2nd and 12th harmonics (P1/P2–P12) | 0.765 | ||||
| Interdaily stability (IS) | 0.722 | ||||
| Rayleigh | 0.520 | ||||
| Intradaily variability (IV) | −0.513 | ||||
| Acrophase | 0.897 | ||||
| Time L10 | 0.854 | ||||
| Time M5 | 0.797 | ||||
| Glucose | −0.414 | ||||
| Mesor | 0.892 | ||||
| L10 | 0.749 | ||||
| M5 | 0.732 | ||||
| Second-harmonic power (P2) | −0.461 | ||||
| Diastolic blood pressure | 0.897 | ||||
| Waist | 0.793 | ||||
| Systolic blood pressure | 0.772 | ||||
| HDL cholesterol | 0.751 | ||||
| Triglycerides | −0.728 | ||||
| % total variability | 27.1 | 15.4 | 12.1 | 11.6 | 8.6 |
Five factors explained 75 % of the total variance. Factors with a % of total variability <5% are not shown. Factors loading <0.25 were not recorded.
As a first step in factor analysis, temperature and obesity variables were introduced. Four patterns accounted for 81% of the variance (Table 2). The rotated factor-loading pattern for these four factors is shown in Table 2. F1 explained 29% of the total variance, with high (>0.7) positive loading for percentage of rhythmicity (PR), amplitude, first-harmonic power (P1), and relative amplitude (RA). Importantly, obesity appeared only in F4, loading negatively (−0.87) together with second-harmonic power (P2) (0.60) and maximum value (0.49). Intradaily variability (IV) was also in the same factor as obesity, but in this case loading negatively (−0.53). The fact that obesity correlated inversely with the second-harmonic power (P2) and maximum value of temperature (°C) and correlated directly with intradaily variability (IV) confirms results from Figure 1, indicating significant differences between normal-weight and obese women in the postprandial period. During this time period, a more marked peak among the normal-weight subjects contributes to a more pronounced ultradian rhythm (P2) in this group. In contrast, obese subjects showed a diminished mean temperature. These results were further confirmed with a Student’s t test comparing IV, P2, and mean temperature between obese and normal-weight women (p < .05). As a second step in factor analysis, we included the variables defining MetS (Zimmetet al., 2005) (Table 3), and our results indicated that glucose appeared in F2 together and in the opposite direction of acrophase and other variables related to the time of maximum or minimum temperature.
Correlation Analysis
In a second approach using correlation analysis, we evaluated potential associations between temperature variables selected from factor analysis and plasma leptin, ghrelin, adiponectin, and daily melatonin fluctuations. Interestingly, those variables that explained maximum variability in F1 were also related to ghrelin. Ghrelin was significantly and inversely correlated with the percentage of rhythmicity (PR) (r = −0.35; p = .002), amplitude (r = −0.30; p = .015), and relative amplitude (RA) (r = −0.33; p = .006)—parameters that assess the robustness of the rhythm. In contrast, those temperature variables previously related to obesity in the factor analysis (second-harmonic power [P2], maximum value, and intradaily variability [IV]) were significantly correlated both with obesity-related proteins (leptin and adiponectin) and also with melatonin daily fluctuations (Table 4). It is noteworthy that when values were adjusted for obesity, differences remained significant except for leptin variables, in which significance was lost.
TABLE 4.
Correlations between melatonin ratio, leptin, and adiponectin and temperature variables related to obesity
| Melatonin midnight/midday | Leptin | Adiponectin | ||
|---|---|---|---|---|
| Maximum value | r | 0.24 | −0.01 | 0.37 |
| p | (0.047) | (0.936) | (0.002) | |
| Second-harmonic power (P2) | r | 0.32 | −0.30 | 0.33 |
| p | (0.008) | (0.015) | (0.007) | |
| Intradaily variability (IV) | r | −0.25 | 0.32 | −0.17 |
| p | (0.042) | (0.008) | (0.164) |
P2 = the amplitude of 12-h rhythm; intradaily variability (IV) characterizes the rhythm fragmentation. Significant correlations are indicated in bold font.
DISCUSSION
In this study, we have used measures of WT to increase our understanding of relationships between chronobiology and obesity. Towards this end, we analyzed both average values and daily variation using specific time-series analysis (Ortiz-Tudela et al., 2010). Our data demonstrate a consistent pattern linking daily temperature with chronodisruption and obesity. Particularly relevant are the differences in cortisol and melatonin circadian variability between obese and normal-weight women, these rhythms being more subtle in obese women. For cortisol, a high variability is a sign of the typical normal diurnal curve, with peaks in the morning and low values in the evening. In contrast, a low variability with a flattened curve indicates diminished differences between morning and evening values due to lower morning and/or higher evening concentrations (Björntorp, 2000; Van Someren, 2004). Consistent with our results, previous studies have reported low morning cortisol levels in obese subjects (Kisebah & Krakower, 1994), especially in those with central obesity (García-Prieto et al., 2007). A similar pattern has been previously described for melatonin. Indeed, melatonin rhythmicity may regulate metabolic functions through redox, inflammation, and epigenetic pathways (Barrenetxe et al., 2004; Korkmaz et al., 2009), which in turn affect energy balance, body weight (Pandi-Perumal et al., 2006), and MetS components (Lund et al., 2001).
Our results from the factor analysis demonstrate an inverse correlation between obesity and the second-harmonic power (P2). This ultradian peak is also the most notable finding derived from analysis of the chronogram (Figure 1), and is related to the postprandial WT peak. In normal-weight women, we observed a marked secondary WT peak (assessed by the second circadian harmonic of 12 h), which was much less pronounced and phase delayed among obese women. Differences in food intake, and its specific dynamic action, can be partly responsible for this differential increase in postprandial heat production between obese and normal-weight women (Sarabia et al., 2008). It has been hypothesized that a lower thermogenic effect of food (Sims, 1989; Welle, 1995) or differences in short periods of napping (Sarabia et al., 2008) may underlie these observations. Previously, absence of the second circadian harmonic (P2) has been considered a marker of chronodisruption and metabolic alterations (García-Prieto et al., 2007).
Obesity was also related to intraday variability (IV), obtained from the analysis of repeated measures across several days. Indeed, in the factor analysis, IV was directly correlated with obesity, indicating an increased IV in obese women, which suggests a greater fragmentation of the rest-activity rhythm as compared with their normal-weight counterparts. Previously, increased IV has been associated with aging (Huang et al., 2002), probably related to the increased daytime napping and nocturnal awakenings in the elderly, and also characteristic of obese subjects. In the present study, this increased IV was also associated with a decrease in the amplitude of the melatonin daily rhythmicity, a sign of chronodisruption.
The third variable related to obesity in the factor analysis was the maximum value of temperature, which is reduced in obese individuals. This may be due to a reduced ability of obese individuals to dissipate heat through vasodilation of their peripheral blood vessels (Raymann et al., 2007a). A good sympathetic (vasoconstrictive) and parasympathetic (vasodilating) activation is a prerequisite for an adequate sleep balance. Indeed, insomniacs and elderly people who sleep poorly typically exhibit lower skin temperatures (Kistler et al., 1998). Although the differences in mean temperature values between obese and normal-weight may seem negligible (0.3°C), this small difference appears to be sufficient to disrupt circadian rhythmicity. In fact, induction of a slight increase (0.4°C) in skin temperature suppresses nocturnal wakefulness and shifts sleep to deeper stages (Raymann et al., 2008b).
It has been proposed that chronodisruption is not only related to overall obesity, but also to MetS (Eckel et al., 2010). Thus, we have demonstrated that the time when a subject reaches maximum temperature (acrophase) was also associated with the metabolic alterations characteristic of MetS. More specifically, and consistent with a previous report (Jauch-Chara et al., 2007), a delayed acrophase, which characterizes “evening-type” subjects, was related to morning hypoglycemia. Additionally, the ultradian peak (P2) or its amplitude was significantly related to lower MetS risk, with diminished concentrations of the protective adiponectin (Garaulet et al., 2007).
Hormonal regulators of food intake, an important external synchronizer of our internal biological clock, could also be related to WT rhythmicity. Thus, we have shown that the appetite-related hormone ghrelin was associated with temperature variability, which may be linked to its circadian behavior. Ghrelin spikes occur at times coincident with classical meal times, showing both circadian and ultradian rhythms (Drazen et al., 2006; Kluge et al., 2008; Motivala et al., 2009). Further, the inverse correlation found between ghrelin, the rhythm amplitude, and the percentage of rhythmicity (PR), the latter two being indicators of circadian robustness, seems to be consistent with previous reports showing an association between increased ghrelin and lack of sleep (Motivala et al., 2009).
Finally, our temperature data were significantly correlated with the circadian rhythm in melatonin. The positive association between melatonin index (midnight/midday ratio of blood hormone concentration) and temperature variables supports the use of wrist skin temperature to evaluate the circadian system status in obese subjects. In fact, the temperature daily rhythm is normally timed to be in synchrony with specific phases of the sleep-wake cycle, the pineal melatonin rhythm, and the responsiveness of the circadian pacemaker to light. The onset of melatonin secretion promotes an increase in peripheral temperature via cutaneous vasodilation (Cagnacci, 1997).
One of the potential limitations of the current study is related to the issue of multiple testing. To address this issue, we substantially reduced the number of statistical tests by selecting only those measured temperature variables that showed the maximal variability in the factor analysis. Patterns of relationships illustrated through factor analyses may be more convincing than individual significant p values. Moreover, the impact of multiple testing is further reduced in the current study because many of the primary outcomes are highly correlated phenotypes.
Conclusions
In summary, our data demonstrate a consistent pattern linking daily temperature with chronodisruption and obesity. Particularly relevant are the differences in cortisol and melatonin circadian variability. Moreover, obese women displayed a moderated WT rhythm, with a more flattened pattern (particularly in the postprandial period), and the increased IV observed in obese women suggests a greater fragmentation of the rest/activity rhythm. Collectively, these results could indicate a reduced capacity for synchronizing endogenous rhythms with external inputs, or to more irregular sleeping and eating patterns, which may ultimately increase MetS risk.
Acknowledgments
This work was supported by the Government of Education, Science and Research of Murcia (Project BIO/FFA 07/01-0004) and the Spanish Department of Science and Innovation (project AGL2008-01655/ALI) National Heart, Lung, and Blood Institute grant HL-54776, National Institute of Diabetes and Digestive and Kidney Diseases grant DK075030, and contracts 53-K06-5-10 and 58-1950-9-001 from the US Department of Agriculture. Teresa Hernandez and Ana Espallardo are acknowledged for their previous work in the initial part of this study.
Footnotes
Declaration of interest: The authors report no conflicts of interest. The authors alone are responsible for the content and writing of the paper.
References
- Alberti KG, Zimmet P, Shaw J. International Diabetes Federation: a consensus on Type 2 diabetes prevention. Diabet Med. 2007;24:451–463. doi: 10.1111/j.1464-5491.2007.02157.x. [DOI] [PubMed] [Google Scholar]
- Aschoff J, editor. Biological rhythms. Handbook of behavioral neurobiology. Plenum Press; New York: pp. 215–241. [Google Scholar]
- Barrenetxe J, Delagrange P, Martínez JA. Physiological and metabolic functions of melatonin. J Physiol Biochem. 2004;60:61–72. doi: 10.1007/BF03168221. [DOI] [PubMed] [Google Scholar]
- Blankfield RP. The thermoregulatory-vascular remodeling hypothesis: an explanation for essential hypertension. Med Hypotheses. 2006;66:1174–1178. doi: 10.1016/j.mehy.2005.12.014. [DOI] [PubMed] [Google Scholar]
- Björntorp P. Obesity and cortisol. Nutrition. 2000;16:924–936. doi: 10.1016/s0899-9007(00)00422-6. [DOI] [PubMed] [Google Scholar]
- Cagnacci A. Influences of melatonin on human circadian rhythms. Chronobiol Int. 1997;14:205–220. doi: 10.3109/07420529709001156. [DOI] [PubMed] [Google Scholar]
- Campbell S, Broughton R. Rapid decline in body temperature before sleep: fluffing the physiological pillow? Chronobiol Int. 1994;11:126–131. doi: 10.3109/07420529409055899. [DOI] [PubMed] [Google Scholar]
- Campuzano A, Cambras T, Vilaplana J, Canal MM, Carulla M, Díez-Noguera A. Period length of the light-dark cycle influences the growth rate and food intake in mice. Physiol Behav. 1999;67:791–797. doi: 10.1016/s0031-9384(99)00196-1. [DOI] [PubMed] [Google Scholar]
- Cornelissen G, Gubin D, Halberg F, Milano G, Halberg F. Chronomedical aspects of oncology and geriatrics. In Vivo. 1999;13:77–82. [PubMed] [Google Scholar]
- Craig CL, Marshall AL, Sjöström M, Bauman AE, Booth ML, Ainsworth BE, Pratt M, Ekelund U, Yngve A, Sallis JF, Oja P. International Physical Activity Questionnaire: 12-country reliability and validity. Med Sci Sports Exerc. 2003;35:1381–1395. doi: 10.1249/01.MSS.0000078924.61453.FB. [DOI] [PubMed] [Google Scholar]
- Dijk DJ, Czeisler CA. Contribution of the circadian pacemaker and the sleep homeostat to sleep propensity, sleep structure, electroencephalographic slow waves, and sleep spindle activity in humans. J Neurosci. 1995;15:3526–3538. doi: 10.1523/JNEUROSCI.15-05-03526.1995. [DOI] [PMC free article] [PubMed] [Google Scholar]
- Drazen DL, Vahl TP, D’Alessio DA, Seeley RJ, Woods SC. Effects of a fixed meal pattern on ghrelin secretion: evidence for a learned response independent of nutrient status. Endocrinology. 2006;147:23–30. doi: 10.1210/en.2005-0973. [DOI] [PubMed] [Google Scholar]
- Duguay D, Cermakian N. The crosstalk between physiology and circadian clock proteins. Chronobiol Int. 2009;26:1479–1513. doi: 10.3109/07420520903497575. [DOI] [PubMed] [Google Scholar]
- Eckel RH, Alberti KGMM, Grundy SM. The metabolic syndrome. Lancet. 2010;375:181–183. doi: 10.1016/S0140-6736(09)61794-3. [DOI] [PubMed] [Google Scholar]
- Ferrario VF, Sforza C, Schmitz JH, Miani A, Taroni G. Fourier analysis of human soft tissue facial shape: sex differences in normal adults. J Anat. 1995;187:593–602. [PMC free article] [PubMed] [Google Scholar]
- Focan C. Marker rhythms for cancer chronotherapy. From laboratory animals to human beings. In Vivo. 1995;9:283–298. [PubMed] [Google Scholar]
- Garaulet M, Madrid JA. Chronobiological aspects of nutrition, metabolic syndrome and obesity. Adv Drug Deliv Rev. 2010;62:967–978. doi: 10.1016/j.addr.2010.05.005. [DOI] [PubMed] [Google Scholar]
- Garaulet M, Hernández-Morante JJ, de Heredia FP, Tébar FJ. Adiponectin, the controversial hormone. Public Health Nutr. 2007;10:1145–1150. doi: 10.1017/S1368980007000638. [DOI] [PubMed] [Google Scholar]
- Garaulet M, Gomez-Abellan P, Madrid JA. Chronobiology and obesity: the orchestra out of tune. Clin Lipidol. 2010a;5:181–188. [Google Scholar]
- Garauket M, Ordovás JM, Madrid JA. The Chronobiology, etiology and pathophysiology of obesity. Int J Obesity. 2010b;34:1667–83. doi: 10.1038/ijo.2010.118. [DOI] [PMC free article] [PubMed] [Google Scholar]
- García-Prieto MD, Tébar FJ, Nicolás F, Larqué E, Zamora S, Garaulet M. Cortisol secretary pattern and glucocorticoid feedback sensitivity in women from a Mediterranean area: relationship with anthropometric characteristics, dietary intake and plasma fatty acid profile. Clin Endocrinol. 2007;66:185–191. doi: 10.1111/j.1365-2265.2006.02705.x. [DOI] [PubMed] [Google Scholar]
- Halberg F, Cornélissen G, Ulmer W, Blank M, Hrushesky W, Wood P, Singh RK, Wang Z. Cancer chronomics III. Chronomics for cancer, aging, melatonin and experimental therapeutics researchers. J Exp Ther Oncol. 2006;6:73–84. [PMC free article] [PubMed] [Google Scholar]
- Huang YL, Liu RY, Wang QS, Van Someren EJ, Xu H, Zhou JN. Age-associated difference in circadian sleep-wake and rest-activity rhythms. Physiol Behav. 2002;76:597–603. doi: 10.1016/s0031-9384(02)00733-3. [DOI] [PubMed] [Google Scholar]
- Jauch-Chara K, Hallschmid M, Gais S, Oltmanns KM, Peters A, Born J, Schultes B. Awakening and counterregulatory response to hypoglycemia during early and late sleep. Diabetes. 2007;56:1938–1942. doi: 10.2337/db07-0044. [DOI] [PubMed] [Google Scholar]
- Kahn HS, Williamson DF. Sagittal abdominal diameter. Int J Obes Relat Metab Disord. 1993;17:669. [PubMed] [Google Scholar]
- Kirschbaum C, Hellhammer DH. Salivary cortisol in psychoneuroendocrine research: recent developments and applications. Psychoneuroendocrinology. 1994;19:313–333. doi: 10.1016/0306-4530(94)90013-2. [DOI] [PubMed] [Google Scholar]
- Kistler A, Mariauzouls C, Von Berlepsch K. Fingertip temperature as an indicator for sympathetic responses. Int J Psychophysiol. 1998;29:35–41. doi: 10.1016/s0167-8760(97)00087-1. [DOI] [PubMed] [Google Scholar]
- Kluge M, Schüssler P, Bleninger P, Kleyer S, Uhr M, Weikel JC, Yassouridis A, Zuber V, Steiger A. Ghrelin alone or co-administered with GHRH or CRH increases non-REM sleep and decreases REM sleep in young males. Psychoneuroendocrinology. 2008;33:497–506. doi: 10.1016/j.psyneuen.2008.01.008. [DOI] [PubMed] [Google Scholar]
- Korkmaz A, Topal T, Tan DX, Reiter RJ. Role of melatonin in metabolic regulation [review] Rev Endocr Metab Disord. 2009;10:261–270. doi: 10.1007/s11154-009-9117-5. [DOI] [PubMed] [Google Scholar]
- Krauchi K. How is the circadian rhythm of core body temperature regulated? Clin Auton Res. 2002;12:147–149. doi: 10.1007/s10286-002-0043-9. [DOI] [PubMed] [Google Scholar]
- Krauchi K. The thermophysiological cascade leading to sleep initiation in relation to phase of entrainment. Sleep Med Rev. 2007;11:439–451. doi: 10.1016/j.smrv.2007.07.001. [DOI] [PubMed] [Google Scholar]
- Kvist H, Chowdhury B, Grangård U, Tylén U, Sjöström L. Total and visceral adipose-tissue volumes derived from measurements with computed tomography in adult men and women: predictive equations. Am J Clin Nutr. 1988;48:1351–1361. doi: 10.1093/ajcn/48.6.1351. [DOI] [PubMed] [Google Scholar]
- Lanfranco F, Motta G, Minetto MA, Baldi M, Balbo M, Ghigo E, Arvat E, Maccario M. Neuroendocrine alterations in obese patients with sleep apnea syndrome. Int J Endocrinol. 2010:474–518. doi: 10.1155/2010/474518. [DOI] [PMC free article] [PubMed] [Google Scholar]
- Lewy AJ, Sack RL. The dim light melatonin onset as a marker for circadian phase position. Chronobiol Int. 1989;6:93–102. doi: 10.3109/07420528909059144. [DOI] [PubMed] [Google Scholar]
- Lund J, Arendt J, Hampton SM, English J, Morgan LM. Postprandial hormone and metabolic responses amongst shift workers in Antarctica. J Endocrinol. 2001;171:557–564. doi: 10.1677/joe.0.1710557. [DOI] [PubMed] [Google Scholar]
- Marcheva B, Ramsey KM, Affinati A, Bass JJ. Clock genes and metabolic disease. Appl Physiol. 2009;107:1638–1646. doi: 10.1152/japplphysiol.00698.2009. [DOI] [PMC free article] [PubMed] [Google Scholar]
- Medina-Lezama J, Pastorius CA, Zea-Diaz H, Bernabe-Ortiz A, Corrales-Medina F, Morey-Vargas OL, Chirinos DA, Muñoz-Atahualpa E, Chirinos-Pacheco J, Chirinos JA. Optimal definitions for abdominal obesity and the metabolic syndrome in Andean Hispanics: the PREVENCION study. Diabetes Care. 2010;33:1385–1388. doi: 10.2337/dc09-2353. [DOI] [PMC free article] [PubMed] [Google Scholar]
- Moore-Ede MC, Sulzman FM. Internal temporal order. In: Asschoff J, editor. Biological Rhythms. Handbook of behavioral Neurobiology. Plenum Press; New York: 1981. pp. 215–241. [Google Scholar]
- Motivala SJ, Tomiyama AJ, Ziegler M, Khandrika S, Irwin MR. Nocturnal levels of ghrelin and leptin and sleep in chronic insomnia. Psychoneuroendocrinology. 2009;34:540–545. doi: 10.1016/j.psyneuen.2008.10.016. [DOI] [PMC free article] [PubMed] [Google Scholar]
- Ortiz-Tudela E, Martinez-Nicolas A, Campos M, Rol MÁ, Madrid JA. A new integrated variable based on thermometry, actimetry and body position (TAP) to evaluate circadian system status in humans. PLoS Comput Biol. 2010;6:pe1000996. doi: 10.1371/journal.pcbi.1000996. [DOI] [PMC free article] [PubMed] [Google Scholar]
- Pandi-Perumal SR, Srinivasan V, Maestroni GJ, Cardinali DP, Poeggeler B, Hardeland R. Melatonin: nature’s most versatile biological signal? FEBS J. 2006;273:2813–2838. doi: 10.1111/j.1742-4658.2006.05322.x. [DOI] [PubMed] [Google Scholar]
- Perez-Tilve D, Stern JE, Tschöp M. The brain and the metabolic syndrome: not awireless connection. Endocrinology. 2006;147:1136–1139. doi: 10.1210/en.2005-1586. [DOI] [PubMed] [Google Scholar]
- Portaluppi F, Smolensky MH, Touitou Y. Ethics and methods for biological rhythm research on animals and human beings. Chronobiol Int. 2010;27:1911–1929. doi: 10.3109/07420528.2010.516381. [DOI] [PubMed] [Google Scholar]
- Raymann RJ, Swaab DF, Van Someren EJW. Skin temperature and sleep-onset latency: changes with age and insomnia. Physiol Behav. 2007;90:257–266. doi: 10.1016/j.physbeh.2006.09.008. [DOI] [PubMed] [Google Scholar]
- Raymann RJ, Swaab DF, Van Someren EJW. Skin deep: enhanced sleep depth by cutaneous temperature manipulation. Brain. 2008;131:500–513. doi: 10.1093/brain/awm315. [DOI] [PubMed] [Google Scholar]
- Reilly T, Waterhouse J, Atkinson G. Aging, rhythms of physical performance, and adjustment to changes in the sleep–activity cycle. Occup Environ Med. 1997;54:812–816. doi: 10.1136/oem.54.11.812. [DOI] [PMC free article] [PubMed] [Google Scholar]
- Risérus U, Arnlöv J, Brismar K, Zethelius B, Berglund L, Vessby B. Sagittal abdominal diameter is a strong anthropometric marker of insulin resistance and hyperproinsulinemia in obese men. Diabetes Care. 2004;27:2041–2046. doi: 10.2337/diacare.27.8.2041. [DOI] [PubMed] [Google Scholar]
- Salas-Salvadó J, Rubio MA, Barbany M, Moreno B. Consensus for the evaluation of overweight and obesity and the establishment of therapeutic intervention criteria. Med Clin. 2007;128:184–196. doi: 10.1016/s0025-7753(07)72531-9. [DOI] [PubMed] [Google Scholar]
- Sampaio LR, Simões EJ, Assis AM, Ramos LR. Validity and reliability of the sagittal abdominal diameter as a predictor of visceral abdominal fat. Arq Bras Endocrinol Metabol. 2007;51:980–986. doi: 10.1590/s0004-27302007000600013. [DOI] [PubMed] [Google Scholar]
- Sarabia JA, Rol MA, Mendiola P, Madrid JA. Circadian rhythm of wrist temperature in normal-living subjects. A candidate of new index of the circadian system. Physiol Behav. 2008;95:570–580. doi: 10.1016/j.physbeh.2008.08.005. [DOI] [PubMed] [Google Scholar]
- Sims EA. Storage and expenditure of energy in obesity and their implications for management. Med Clin North Am. 1989;73:97–110. doi: 10.1016/s0025-7125(16)30694-0. [DOI] [PubMed] [Google Scholar]
- Van marken Lichtenbelt WD, Daanen HA, Wouters L, Fronczek R, Raymann RJ, Severens NM. Evaluation of wireless determination of skin temperature using iButtons. Physiol Behav. 2006;88:489–497. doi: 10.1016/j.physbeh.2006.04.026. [DOI] [PubMed] [Google Scholar]
- Van Someren EJW. More than a marker: interaction between the circadian regulation of temperature and sleep, age-related changes, and treatment possibilities. Chronobiol Int. 2000;17:313–354. doi: 10.1081/cbi-100101050. [DOI] [PubMed] [Google Scholar]
- Van Someren EJW. Sleep propensity is modulated by circadian and behavior-induced changes in cutaneous temperature. J Therm Biol. 2004;29:437. [Google Scholar]
- Van Someren EJW. Mechanisms and functions of coupling between sleep and temperature rhythms. Prog Brain Res. 2006;153:309–324. doi: 10.1016/S0079-6123(06)53018-3. [DOI] [PubMed] [Google Scholar]
- Van Someren EJW, Scherder EJA, Swaab DF. Transcutaneous electrical nerve stimulation (TENS) improves circadian rhythm disturbances in Alzheimer’s disease. Alzheimer Dis Assoc Disord. 1998;12:114–118. doi: 10.1097/00002093-199806000-00010. [DOI] [PubMed] [Google Scholar]
- Van Someren EJW, Swaab DF, Colenda CC, Cohen W, McCall WV, Rosenquist PB. Bright light therapy: improved sensitivity to its effects on rest-activity rhythms in alzheimer patients by application of nonparametric methods. Chronobiol Int. 1999;16:505–518. doi: 10.3109/07420529908998724. [DOI] [PubMed] [Google Scholar]
- Watenpaugh DE. The role of sleep dysfunction in physical inactivity and its relationship to obesity. Curr Sports Med Rep. 2009;8:331–338. doi: 10.1249/JSR.0b013e3181c27834. [DOI] [PubMed] [Google Scholar]
- Waterhouse J, DeCoursey PJ. The relevance of circadian rhythms for human welfare. In: Dunlap JC, Loros JJ, DeCoursey PJ, editors. Chronobiology: biological timekeeping. Sinauer; Sunderland, MA: 2004. pp. 325–356. [Google Scholar]
- Waterhouse J, Drust B, Weinert D, Edwards B, Gregson W, Atkinson G, Kao S, Aizawa S, Reilly T. The circadian rhythm of core temperature: origin and some implications for exercise performance. Chronobiol Int. 2005;22:207–225. doi: 10.1081/cbi-200053477. [DOI] [PubMed] [Google Scholar]
- Welle S. Sympathetic nervous system response to intake. Am J Clin Nutr. 1995;62:S1118–S1122. doi: 10.1093/ajcn/62.5.1118S. [DOI] [PubMed] [Google Scholar]
- Zimmet P, Magliano D, Matsuzawa Y, Alberti G, Shaw J. The metabolic syndrome: a global problem and a new definition. J Atheroscler Thromb. 2005;12:295–300. doi: 10.5551/jat.12.295. [DOI] [PubMed] [Google Scholar]
- Zulley J, Wever R, Aschoff J. The dependence of onset and duration of sleep on the circadian rhythm of rectal temperature. Pflügers Archiv. 1981;391:314–318. doi: 10.1007/BF00581514. [DOI] [PubMed] [Google Scholar]