

Abstract
HHcy has been implicated in elderly frailty, but the underlying mechanisms are poorly understood. Using C57 and CBS+/- mice and C2C12 cell line, we investigated mechanisms behind HHcy induced skeletal muscle weakness and fatigability. Possible alterations in metabolic capacity (levels of LDH, CS, MM-CK and COX-IV), in structural proteins (levels of dystrophin) and in mitochondrial function (ATP production) were examined. An exercise regimen was employed to reverse HHcy induced changes. CBS+/- mice exhibited more fatigability, and generated less contraction force. No significant changes in muscle morphology were observed. However, there is corresponding reduction in large muscle fiber number in CBS+/- mice. Excess fatigability was not due to changes in key enzymes involved in metabolism, but was due to reduced ATP levels. A marginal reduction in dystrophin levels along with a decrease in mitochondrial transcription factor A (mtTFA) were observed. There was also an increase in the mir-31, and mir-494 quantities that were implicated in dystrophin and mtTFA regulation respectively. The molecular changes elevated during HHcy, with the exception of dystrophin levels, were reversed after exercise. In addition, amount of NRF-1, one of the transcriptional regulators of mtTFA, was significantly decreased. Furthermore, there was enhancement in mir-494 levels and a concomitant decline in mtTFA protein quantity in homocysteine treated cells. These changes in C2C12 cells were also accompanied by an increase in DNMT3a and DNMT3b proteins and global DNA methylation levels. Together, these results suggest that HHcy plays a causal role in enhanced fatigability through mitochondrial dysfunction which involves epigenetic changes.
Keywords: microRNA, mtTFA, dystrophin, exercise, epigenetics, NRF-1
1. Introduction
Impaired cardiovascular function and derailed energy metabolism (as in diabetes and obesity) are the two major causes for human mortality and morbidity in the 21st century [1-3]. Exercise has been shown to correct both metabolic impairments and cardiovascular deficiencies [4-6]. However, exercise intolerance and fatigue are the leading causes that undermine the benefits of exercise in apparently physically normal individuals [7]. Furthermore, certain factors such as hyperhomocysteinemia aggravate age associated decline in physical function [8]. In this regard, understanding molecular changes associated with the factors that cause fatigue or exercise intolerance not only benefit efforts that raise physical capabilities, but also significantly reduces mortality and morbidity associated with cardiovascular disease and metabolic syndromes such as diabetes and obesity through improved exercise competence.
Fatigue could result from decreased muscle mass and/or structural and metabolic/energy production alterations intrinsic to muscle cells [9]. Structural alterations that lead to progressive muscle weakness are well characterized. Of note are the defects associated with dystrophin complex assembly [10]. Dystrophin anchors the inner cytoskeleton to the outer matrix via a dystrophin complex and is perceived to provide membrane stabilization, especially during rigorous muscle contractions [10-12]. Dystrophin deficiency was proposed to cause muscle membrane injury during exercise and limits exercise capacity [11]. Other deficiencies in structural proteins are also reported [11]. While genetic causes underlying changes in dystrophin and other important structural components, such as truncated protein products and defective splicing, are relatively well characterized, involvement of epigenetic modifications is less well characterized [13].
Apart from structural deficiencies, energy imbalances were also reported to play a crucial role in causation of fatigue [14, 15]. As mitochondria play a pivotal role in the production of bulk cellular ATP, the cellular currency, the factors that either compromise mitochondrial function and/or prevent mitochondrial biogenesis and content would limit muscle's ability to contract [16-18]. For example, deficiency of regulators of mitochondrial gene transcription and mitochondrial DNA replication such as mitochondrial transcription factors (mtTF), nuclear encoded mitochondrial localized proteins, have been reported to cause exercise intolerance and fatigue in mouse models [16]. Moreover changes in genes that regulate aerobic and anaerobic metabolism have also been implicated in causation of exercise intolerance [19]. For example, alterations in CS, LDH and COXIV were reported to limit physical capacity [19-22]. Identification of factors that cause mitochondrial dysfunction and/or declined biogenesis as well as changes in energy metabolism is necessary to enhance physical capacity and to maximize exercise benefits.
Recent evidence suggestes that epigenetics can also modulate gene expression levels through changes in DNA methylation, regulation of chromatin structure and gene accessibility and most recently through microRNA expression levels [23-25]. Though involvement of epigenetic modifications in regulation of important gene expression levels associated with skeletal muscle function are characterized relatively well [26], the role of epigenetic modifications in causation of fatigue is largely unknown [13]. Importantly knowledge regarding pathological factors that contribute to fatigue and associated epigenetic modifications is lacking. In the current study we evaluated the influence of hyperhomocysteinemia (HHcy) on skeletal muscle fatigability and associated epigenetic modifications.
HHcy is a metabolic disorder mainly due to improper removal and/or accumulation of the non-protein coding sulfur containing amino acid homocysteine (Hcy) [8]. Genetic, nutritional and disease specific factors have been implicated in causation of HHcy [8]. Though skeletal muscle deformities in HHcy patients have been reported long back [27], it is now that the association between HHcy and decline in muscle function is increasingly recognized [8]. However, the causes for such a decline in physical function are not well characterized [8]. As Hcy metabolism also generates methyl groups to feed to the cellular methylation reactions and DNA methylation is aberrant in HHcy conditions, HHcy is proposed as an epigenetic modulator [8]. However, the relevance of epigenetic changes during HHcy in causation of muscle weakness is not known. In the current study we have characterized the nature of HHcy medicated changes in skeletal muscle function and found that epigenetic modifications contribute to HHcy associated decline in physical function using genetic mouse models of HHcy. The transsulfuration enzyme CBS, Cystathionine β synthase which performs irreversible conversion of Hcy into cysteine, has been found to frequently mutated in human beings. Consequently, mouse models that lack CBS had been generated. The homozygous CBS knock out mice not only exhibit severe HHcy, but also die shortly after birth [28]. Hence, the mice heterozygous for CBS gene depletion, exhibit moderate HHcy with normal longevity, are frequently used to know the systemic effects of HHcy condition [8, 28]. In the current study, the CBS+/- mice exhibited more fatigability, and generated less contraction force. No significant changes in muscle morphology were observed. However, there is a corresponding reduction in large muscle fiber number in CBS+/- mice. Excess fatigability was not due to changes in key enzymes involved in metabolism, but was due to reduced ATP levels. A marginal reduction in dystrophin levels along with a decrease in mitochondrial transcription factor A (mtTFA) were observed. There was also an increase in the mir-31, and mir-494 quantities that were implicated in dystrophin and mtTFA regulation respectively. The molecular changes elevated during HHcy, with the exception of dystrophin levels, were reversed in CBS+/- mice after exercise. In addition, the amount of NRF-1, one of the transcriptional regulators of mtTFA, was significantly decreased in CBS+/- mice. Furthermore, after treating C2C12 cells with homocysteine (Hcy), there was enhancement in mir-494 levels and concomitant decline in mtTFA protein amount. These changes in C2C12 cells were also accompanied by an increase in DNMT3a and DNMT3b proteins and global DNA methylation levels. Together, these results suggest that HHcy plays a causal role in reduced physical performance and muscle force generation through mitochondrial dysfunction which involve epigenetic changes.
2. Materials and Methods
2.1 Ex-vivo muscle contraction
Myobath studies were conducted using multi-channel isolated tissue bath system as described before [29] (Myobath, World Precision Instruments, Sarasota, FL, USA). All in vivo conditions such as temperature (37°C), pH, electrolyte strength and proper aeration were supplied. The desired muscles were isolated from tendon to tendon without damage to the muscle bundle. Isolated intact muscles were mounted onto a force transducer and muscle contractions were recorded after determining the appropriate tension. For each experiment initial muscle tension was adjusted to give maximal response. Duration of muscle contraction for a given stimulus and maximal response were calculated after supplying field electric stimulus. As there were no significant measurable difference between weight and length of EDL and soleus from different groups no normalization was done to reflect the weight and length of the muscles. All the muscles were stimulated with 40 V (maximal electric output) for a duration of 30 ms (milli seconds) with a frequency of 0.5 Hz.
2.2 Exercise Protocol
All mice in the exercise group were administered a swimming protocol, aerobic endurance exercise, developed from recommendations listed in the “Resource Book for the Design of Animal Exercise Protocols” by the American Physiological Society. The protocol consisted of 4 days of exercise per week for 4 weeks with the duration of swimming starting at 30 minutes on week 1 and increasing by 15 minutes each week to a maximum duration of 75 minutes by the fourth week. Large polymer containers measuring 20′×14′×7′ were filled with warm water to a depth of approximately 5 inches. The water temperature was maintained between 32 and 36 degrees Celsius. Mice were placed in the water and constantly monitored to ensure safety and physical activity. If the mice discontinued swimming for more than 2 seconds, they were gently nudged to promote movement. Upon completion of exercise, the mice were placed on a paper towel and gently dried off before being placed back into their cage.
2.3 Swim test
Intact male mice of appropriate ages from WT and CBS-/+ groups were subjected to swim performance and the live recordings were obtained using ‘Live animal behavior recoding and analysis system’ (Topscan) from CLEVER SYSTEMS (Reston, Virginia, USA) as described before [30].
2.4 Tissue ATP estimation
Desired tissues (entire soleus muscle) were snap frozen and were used later for enumeration of ATP levels. Total ATP levels were measured using calorimetric kit from Bio Vision (Milpitas, CA, USA). Cold homogenized tissues were deproteinized and neutralized as described in the kit. Cleared samples were used to assay for the ATP levels using spectromaxx spectrophotometer with appropriate standards. Tissue ATP levels were derived from standard curve equations.
2.5 Global methyl-C estimation
Genomic DNA was isolated using Quick-gDNA™ MiniPrep kit from Zymo research (Irvine, CA, USA). After quantification, an equal amount of genomic DNA was used to estimate global levels of 5-methylcytosine using 5-mC DNA ELISA kit from Zymo research (Irvine, CA, USA) by following the manufacturer instructions.
2.6 Real Time PCR
Total RNA was isolated from different samples and quality and quantity was assessed using a spectro-photometer (Nano drop, Wilmington, DE, USA). Total cDNA was synthesized using Hiflex buffer reagent system (miScript II RT kit) from Qiagen (Gaithersburg, MD, USA) by following the manufacturer's instructions. The following primers (5′ to 3′) were used to amplify the mRNA of interest using RT SYBER green qPCR master mix (Qiagen, Gaithersburg, MD, USA) : b-Actin F (5′-3′): GGCTGTATTCCCCTCCATCG, R: CCAGTTGGTAACAATGCCATGT; CS F (5′-3′): GGACAATTTTCCAACCAATCTGC, R: TCGGTTCATTCCCTCTGCATA; COX-IV F: ATTGGCAAGAGAGCCATTTCTAC, R: CACGCCGATCAGCGTAAGT; LDH F: TGTCTCCAGCAAAGACTACTGT, R: GACTGTACTTGACAATGTTGGGA. NRF-1 F: TATGGCGGAAGTAATGAAAGACG, R: CAACGTAAGCTCTGCCTTGTT. MM-CK F: CTGACCCCTGACCTCTACAAT, R: CATGGCGGTCCTGGATGAT. For estimation of levels of miRNA of interest we used miScript primer assay system in combination with universal primer (Qiagen, Gaithersburg, MD, USA). Data was analyzed by calculating normalized relative ratios using cq values.
2.7 Western blotting
Whole cell lysates from homogenized tissues and cultured cells were prepared using RIPA lysis buffer containing protease and phosphatase inhibitors as described earlier [30]. After lysis with the buffer, the preparations were subjected to sonication. Cleared supernatants were obtained after centrifugation. Protein quantities among different samples were determined using Bio-Rad Bradford reagent. Equal quantities of protein samples were resolved using SDS-PAGE gel as described before [30]. After probing the membranes with primary and secondary antibodies along with appropriate washes, chemiluminescence signal was detected using Bio-Rad ChemiDoc™ XRS+ System and Image Lab™ Software (Bio-Rad, Hercules, CA, USA).
2.8 Antibodies
The antibody sources are: Anti-mtTFA from Santa Cruz, (Paso Robles, CA, USA); anti-Mfn2, anti-H3K18 acetylation, anti-DNMT3a, anti-DNMT3b and anti-Dystrophin from Abcam (Cambridge, MA, USA); and Anti-GAPDH from Millipore (Billerica, MA, USA). HRP conjugated secondary antibodies from Santa Cruz Biotechnology (Dallas, Texas, USA).
2.9 Hematoxylin and eosin (H & E) staining and enumeration of muscle fiber crosssectional area (CSA)
Frozen sections of gastrocnemius muscle were subjected to H & E staining as described before [31]. A minimum of 4 different animals for each group were used. Pictures were obtained using cooled Q imaging camera. A minimum of 350 fibers were used to measure CSA for each group using imageJ software [31].
2.10 Animal care and tissue collection
WT (C57BL/6J) and CBS-/+ (B6.129P2-Cbstm1Unc/J002853) mice were genotyped and reared on regular chow and water as reported previously [30]. All the animal studies were approved by the institutional IACUC and are in conformity with the prescribed institutional standards. Standard procedures were followed for collection of tissues and for isolation of individual muscles for ex-vivo contraction experiments after induction of general anesthesia using tribromoethanol as described before [32] Except for the Figures 3B, 4, 5 we used male mice. For these figures we included male and female mice of similar age groups.
Figure 3.
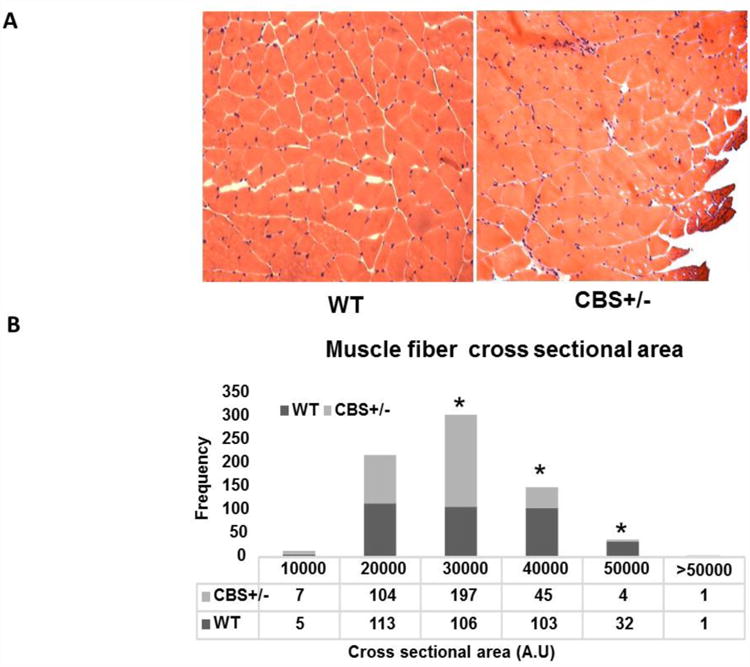
Skeletal muscle morphology and muscle fiber size enumeration. (A) Images of H & E stained representative cross sections of gastrocnemius muscles were showed. The magnification is 10×. (B) Bar graph and table showing different frequencies of muscle fibers categorized based on their size. Cross sectional area was calculated for ∼350 muscle fibers from the H & E stained sections were measured using imageJ software. Five different animals were used. * indicates significantly different (p<0.05).
Figure 4.
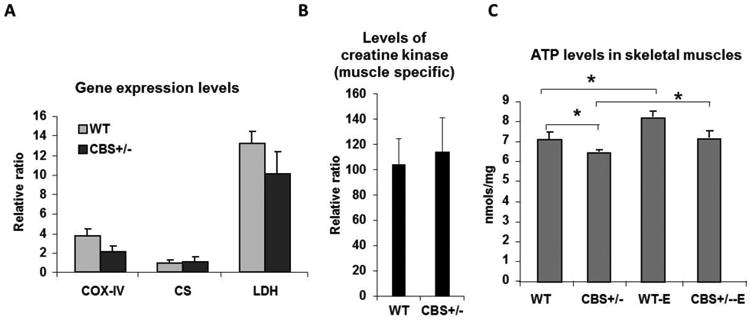
Expression of different metabolic enzymes and tissue ATP levels. (A) Bar graph representing relative quantification of mRNA levels of CS, LDH and COXIV between groups in skeletal muscles. β-actin levels were used to normalize input RNA amount across samples. (B) Bar graph depicting the levels of creatine kinase (muscle specific) mRNA between the groups. The levels are non-significant between the groups. β-actin levels were used to normalize input RNA amount across the samples. (C) Bar graph showing quantification of tissue ATP levels in soleus muscle with and without exercise among groups. * indicates p<0.05.
Figure 5.
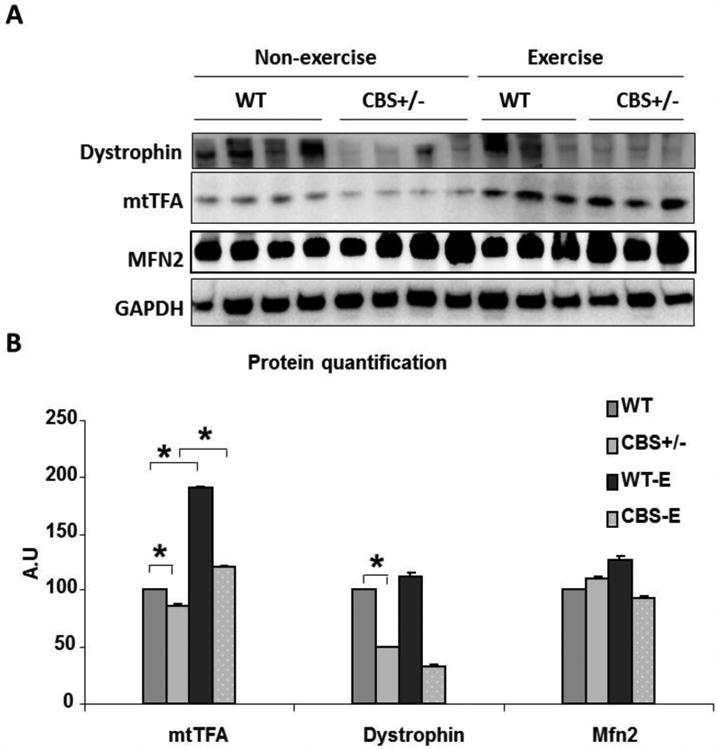
Quantification of relative concentration of different proteins affecting fatigability by western blotting. (A) Western blot image depicting changes in amounts of dystrophin, mtTFA and Mfn2 in whole cell lysates of muscle tissues. The levels of GAPDH were used to normalize input protein levels among the samples. Samples were derived from gastrocnemius muscles of sedentary and exercised mice. (B) Bar graph showing quantification of the above data. For * indicates p is <0.05. For Mfn2 expression no measurable differences were noticed.
2.11 Cell culture
C2C12 cells were grown using DMEM medium (life technologies) with 10% FBS and 1% penicillin and streptomycin solution. At a confluence of 80%, the cells were subjected to differentiation using DMEM medium (ATCC) containing 2% horse serum and 1% penicillin and streptomycin solution. After 5 days of differentiation, cells were treated with Hcy (500uM) (Sigma-Aldrich, St. Louis, MO, USA) for 3 consecutive days with appropriate control. At the end of the treatment cell were lysed and protein, total RNA and DNA were collected.
2.12 Statistical analysis
Images from the western blotting were obtained and were analyzed using Image lab (Bio-Rad, Hercules, CA, USA) software. P value < 0.05 was considered significant. The student t-test was used to enumerate the levels of significance between two different groups. For quantification and analysis of Q-PCR data, we used light cycler software from Roche. Unless otherwise mentioned a minimum of 3 replicates were used for the studies.
3. Results
3.1 HHcy alters whole animal performance
Previous studies reported that there was considerable decline in body weight of HHcy mice [33]. Moreover, recently it was proposed that lack of prompt revascularization after ischemic events could potentially undermine the skeletal muscle performance [34]. However, actual functional capacity of the intact animals was not assessed. In order to verify if there are any alterations in exercise capacity or functional performance, we measured various parameters such as total distance moved in a given time and fatigability after subjecting the intact mice from age matched wild type (WT) and CBS+/- groups through swim challenge and captured live recordings of motion. Analysis of total distance moved in a given time and speed of motion revealed that there was significant reduction in total distance covered in a given time and enhancement in fatigue levels during the course with the CBS+/-mice when compare to WT mice (Fig. 1A, 1B and 1C). The rate of motion was high at the beginning of the swim challenge for all the participants suggesting that both the groups have healthy animals. During the first 20 min (bar graphs), the CBS+/- mice could move only half the distance as that of the wild type mice. The CBS+/- mice also spent relatively higher amount of time with slow speed (<5mm/sec) compared to that of the wild type controls. These results suggested that HHcy could potentially compromise total distance moved in a given time and also affects motion speed which may suggest enhanced fatigability.
Figure 1.
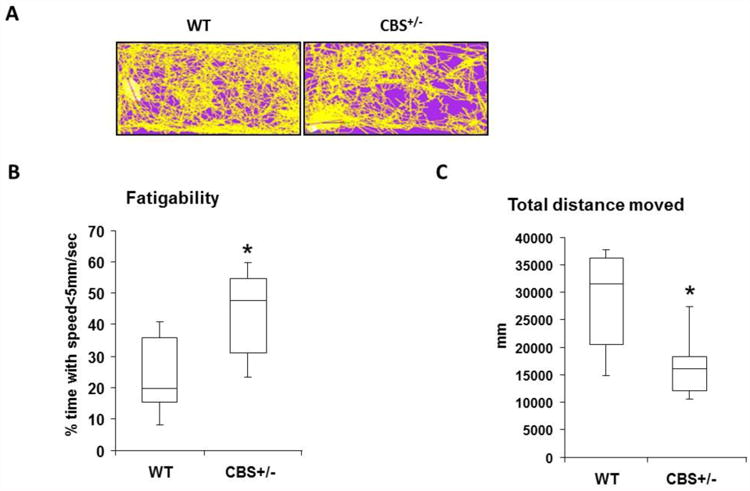
Summary of live recording of intact WT and CBS+/- mice motion performance during swim test. (A) Representative animal tracings were shown for the first 10 min of swim for each group. (B) Box plot depicting measurements of total distance moved (mm) for a given period of 20 min was measured for each group. N= 6 and * indicates p<0.05. (C) Box plot representing measurement of fatigue susceptibility as expressed here as time spent with motion speeds less than 5mm/sec. N= 6 and * indicates p<0.05.
3.2 Altered ex-vivo muscle contraction of oxidative and glycolytic skeletal muscles from CBS+/- mice
Enhanced fatigability that was observed with the CBS+/- mice could result from many pathological processes affecting different organ systems and does not itself indicate defective skeletal muscle function per se. Hence, we elected to characterize if HHcy could alter skeletal muscle function by subjecting isolated intact muscles from anaesthetized mice for field electric stimulation in a myobath chamber that mimics endogenous physiological conditions. We used both oxidative/slow twitch (soleus) and glycolytic/fast-twitch (extensor digitorum longus, EDL) muscles to measure ex-vivo contractile properties. As shown in Fig. 2, the EDL muscles from both the groups exhibited higher contractile force when compared to the force produced from soleus muscles. However, soleus muscles could contract for a longer duration than the EDL muscles. These results are in conformity with the previous findings and are true to their nature with regard to the main source of metabolism (oxidative verses glycolytic). The force generation from the wild type EDL and soleus were consistently higher than those muscles from the CBS+/-mice when they were subjected to same electric stimulus. Interestingly, we did not observe any significant difference in the EDL or soleus muscle weight or length between the two groups. We also measured (2E and 2F) time to half maximal force as an indirect indicator of fatigue after subjecting the isotonic muscles for repeating stimulations at a constant frequency and field strength. In the majority of cases, the EDL and soleus muscles from CBS+/- exhibited quicker reduction in contractile force when compared to that of the wild type muscles. Even though the differences were not significant, these findings do suggest that there is a tendency for higher fatigability in metabolically different muscles (EDL and soleus) of CBS+/- mice. Taken together, these findings suggest that irrespective of muscle fiber nature, HHcy exerts attenuated contractile function and enhanced fatigability, at least as observed with the ex-vivo scenario.
Figure 2.
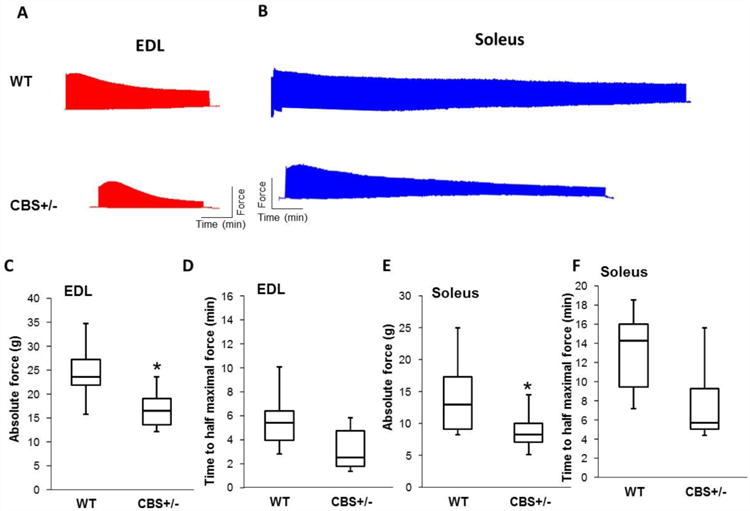
Summary of Ex-vivo isometric muscle contraction response to field stimulation in myobath experiments. (A) and (B) Representative myobath tracings from EDL and Soleus muscles respectively for both the groups were showed. X-axis represents time (min) and Y- axis represent force generation in grams. (C) Box plot depicting quantification of force difference between EDL muscles of different groups. N=6 or more and * indicates p<0.05. The amount of initial maximal force generated was used for quantification from each experiment. (D) Box plot showing time measurements to reach half maximal force was measured for EDL muscle in each group. N=6 or more and p=0.066. (E) Box plot depicting quantification of force difference between soleus muscles of different groups. N=6 or more and * indicates p<0.05. The amount of initial maximal force generated was used for quantification from each experiment. (F) Box plot showing time measurements to reach half maximal force was measured for soleus muscle in each group. N=6 or more and p=0.05.
3.3 CBS+/- mice exhibit diminished muscle fiber size
To assess if there are any morphological changes that are associated with HHcy condition, we performed H & E staining on the cross sections of CBS+/- and wild type gastrocnemius muscles. No apparent gross morphological differences such as damaged muscle fibers or excessive cell infiltration were noted between the groups (Fig. 3a). Next, we assessed muscle fiber cross sectional area between the groups. As shown in Fig.3b, there was a significantly higher number of medium size fibers in CBS+/- mice muscles. However, there is a corresponding reduction in the number of large muscle fibers in CBS+/- mice. These results suggest that HHcy might hinder formation of large muscle fibers and result in diminished muscle performance.
3.4 No significant change in the levels of key enzymes involved in aerobic and anaerobic metabolism
As the CSA of muscle fibers not always represent diminished force production and fatigability [35], we assessed whether the observed reduced performance and the declined muscle contraction force in CBS+/- mice are due to changes in key regulators of energy metabolism. For that we assayed for mRNA levels of enzymes involved in both aerobic and anaerobic metabolism. Though, the levels of Cytochrome C Oxidase subunit IV (COX-IV) and Lactate dehydrogenase were less in CBS+/- mice skeletal muscles than that of the wild type mice the changes are not significant enough to cause any considerable degree of aerobic or anaerobic metabolic alterations respectively (Fig. 4A). The levels of another key aerobic metabolic regulator, citrate synthase, between the groups were barely changed (Fig. 4A). Next, to know if there any changes in the energy buffering capacity of the skeletal muscles, the mRNA levels of muscle specific creatine kinase (MM-CK) were measured. As depicted in Fig. 4B, there were no significant difference in the MM-CK levels between WT and CBS+/- mouse muscles. When considered together, these findings suggest that the differences in muscle force and animal performance between the groups were not due to changes in the key metabolic regulators.
3.5 CBS+/- skeletal muscles exhibit reduction in ATP levels and exercise restores them
To know if there are any changes in ATP levels which are the main currency for the cell function, we assayed for the levels of ATP in the soleus muscles between wild type and CBS+/- mice. Interestingly, there was considerable decrease in ATP levels in the CBS+/- mice muscles (Fig. 4C). Since, exercise has been shown to improve muscle health and functional capacity; we asked whether exercise can restore ATP levels in the CBS+/- mice skeletal muscles. As shown in (Fig. 4C), muscles from both the groups contained enhanced ATP level presence after 4 weeks of administration of a swim exercise protocol. These findings gave us indications that HHcy might compromise either mitochondrial function or biogenesis and responsible for the lower ATP production in CBS+/- mice, as mitochondrial oxidation is the biggest contributor for the cellular ATP production.
3.6 CBS+/- mice exhibit decline in structural and mitochondrial transcriptional regulators
As skeletal muscle fatigue could be due to structural and/or mitochondrial biogenesis regulation, we then assessed if any of these protein levels are different between wild type and CBS+/- mice skeletal muscles. Since dystrophin plays a crucial role in determination of skeletal muscle health, we looked at the levels of dystrophin in skeletal muscles. As observed in Fig. 5A, western blot data suggested that although the dystrophin protein levels vary among each group, over all we tend to see a declining trend in CBS+/- mice muscles. We also assessed levels of key regulators of mitochondrial transcription/replication and biogenesis. Though there was no change in the mitochondrial fusion protein, Mfn2, levels between groups, the levels of mitochondrial transcriptional/replication regulator, mtTFA, were significantly declined in the CBS+/- mice group. Interestingly, the swim protocol was able to restore mtTFA levels but failed to augment levels of dystrophin in CBS+/- mice. When considered that dystrophin levels in both the groups were not significantly improved after exercise, our results suggest that exercise may produce a marginal influence on the levels of dystrophin, if any, with our protocol. In contrast to the dystrophin levels, exercise was able to restore mtTFA levels considerably. Given that exercise was also able to enhance muscle ATP content in CBS+/- mice, it is plausible that HHcy, by inhibiting levels of mtTFA, is rendering the CBS+/- mice muscles more susceptible to fatigue.
3.7 Exercise ameliorated changes in microRNA levels that were aberrant in CBS+/- mice
Since exercise, by a multitude of effects including epigenetic changes, could enhance skeletal muscle health and function and HHcy was also reported to modulate epigenetic regulators, next we asked the question: are there any microRNAs that regulate dystrophin and mitochondrial function that are also known to be influenced by exercise. Based on the literature search, we came across three specific microRNAs (mir-31, mir-494 and mir-499) that were known to be expressed in skeletal muscles and previously have been shown to influence either dystrophin levels or modulate mitochondrial function [36-40]. We quantified the levels of these microRNAs in total RNA samples between wild type and CBS+/- mice with or without exercise.
As shown in Fig. 5, out of the three microRNAs assayed, mir-494 was expressed in higher amounts, followed by mir-31. The expression levels of mir-499 were substantially declined. We found that mir-494 levels were significantly higher in CBS+/- mice skeletal muscles and after 4 weeks of exercise the levels were significantly reduced. The exercise induced reduction in mir-494 levels was minimal in wild type. Nonetheless, the mir-494 expression levels were negatively correlated with mtTFA protein levels with and without exercise in CBS+/- mice. These results suggest that HHcy might diminish mtTFA levels through augmentation of mir-494 levels and that exercise reverses these HHcy induced changes and restores proper muscle function. In addition to mir-494 levels, we also observed a significant increase in mir-31 levels which was previously shown to negatively modulate dystrophin levels in CBS+/- skeletal muscles. Though a negative relationship between mir-31 levels and dystrophin was observed in CBS+/- mice, no such relation was observed after exercise, even though mir-31 levels dropped significantly after exercise.
3.8 HHcy is also associated with diminished NRF-1 levels
Given that mtTFA expression can also be regulated at the transcriptional level [41], we also verified if there are any changes in known mtTFA transcriptional regulators such as NRF-1. Quantification of mRNA levels of NRF-1 (Fig. 6D) revealed that HHcy significantly attenuated NRF-1 mRNA. As reported before that exercise can enhance NRF-1 levels [42], NRF-1 levels were elevated after exercise in both the groups and were also correlated with enhanced mtTFA levels after the exercise regimen. These findings together with the above results (Fig. 6A) indicated that HHcy induced changes target expression of mtTFA at both the transcriptional (declined NRF-1 level) and post transcriptional levels (through increase in mir-494 level).
Figure 6.
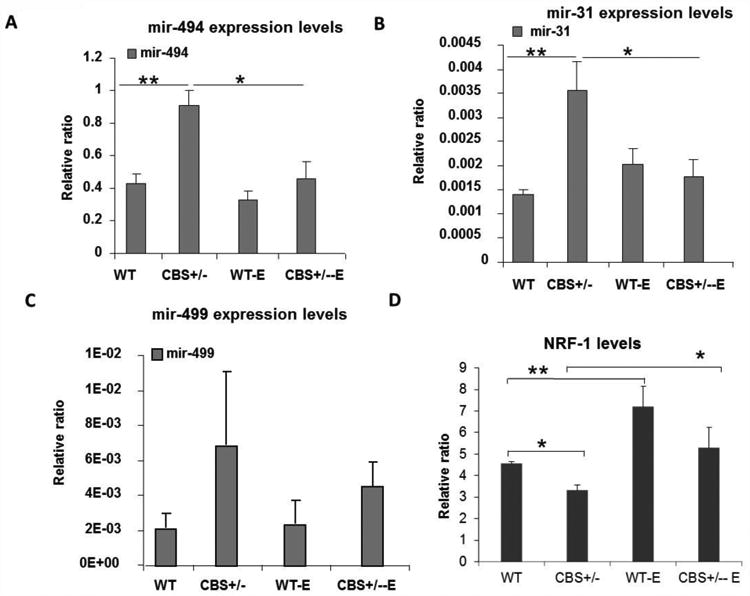
Quantification of relative microRNA concentrations in the skeletal muscles of WT and CBS+/- mice with and without exercise. (A) Bar graph represents relative amount of mir-494 expressed. **p< 0.01 and * p<0.05. In case of wild type we could not observe significant change in mir-494 after exercise. (B) Bar graph represents relative amount of mir-31 expressed. **p< 0.01 and * p<0.05. In the case of wild type, we could not observe any significant change in mir-31 after exercise. (C) Bar graph represents relative amount of mir-499 expressed. No significant changes in mir-499 concentrations were observed among different groups. (D) Bar graph showing relative quantities of NRF-1 transcription factor in each group as assayed by Q-PCR. * indicates p< 0.05. ** indicates p<0.01.
3.9 Treatment of C2C12 cells with Hcy reduced mtTFA levels and enhanced mir-494 levels
To further determine if the observed changes in mir-494 and mtTFA levels in CBS+/- skeletal muscles were due to HHcy and to test the cause and effect relationship, we treated C2C12 cells as described in the methods section. As shown in Fig. 7A and 7B, Hcy treatment significantly decreased mtTFA protein levels. Moreover, we also observed enhancement of mir-494 levels after Hcy treatment in C2C12 cells (Fig. 7C). These findings not only corroborate the previous findings but also suggest that Hcy, when in excess, can alter mir-494 expression and thereby diminish mtTFA protein and compromise muscle function.
Figure 7.
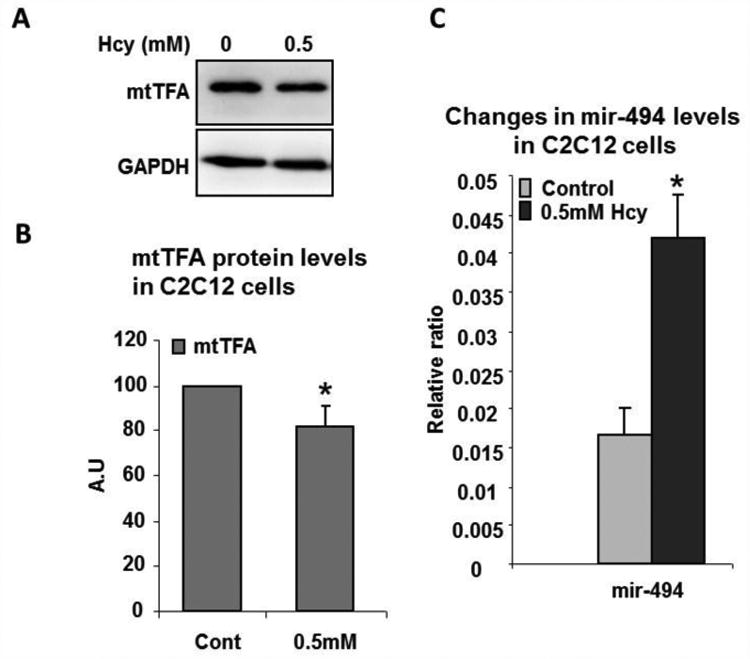
Treatment of C2C12 cells with Hcy alters mir-494 and mtTFA levels. (A) Western blot image showing mtTFA levels after 0.5mM Hcy treatment. Equal loading was shown by detecting GAPDH levels. (B) Bar graph represents quantification of mtTFA levels from Western blots. * p< 0.05. (C) Bar graph showing Q-PCR analysis of mir-494 relative concentrations. * p<0.05.
3.10 Hcy treatment alters global methylation levels through enhancing de novo methylation enzymes
Since HHcy could potentially alter other epigenetic patterns such as CpG methylation, chromatin condensation apart from changes in microRNA levels and influencing proper cell function, we tested if Hcy treatment results in changes in other forms of epigenetic patterns. As observed in Fig. 8, after three days of Hcy treatment, there was significant enhancement in the levels of two different mediators of de novo DNA methylation enzymes: DNT3a and DNMT3b.Although there was an enhancement in the levels of H3K18 acetylation levels after Hcy treatment, the changes were not significant. These results together suggest that Hcy induces changes in DNA methylation patterns which might also potentially influence gene expression related to muscle function.
Figure 8.
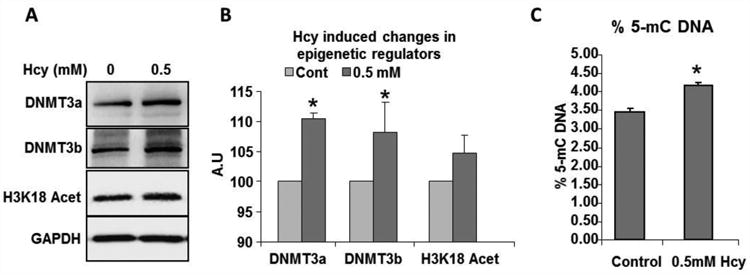
Changes in epigenetic patterns and modifiers after Hcy treatment in C2C12 cells. (A) Representative western blot image showing relative amounts of DNMT3a, 3b and H3K18Acetylation modification after Hcy treatment. (B) Bar graph showing quantification of Western data from (A). * p< 0.05. (C) Global 5 methylcytosine levels were assayed by ELISA and are presented in bar graph. * represents p<0.05.
4. Discussion
Our data from the whole animal swim test and ex-vivo muscle contractility measurements suggested that HHcy could diminish skeletal muscle performance. Given that both oxidative and glycolytic muscles are equally affected, we do not think the HHcy induced changes are fiber specific alterations. In addition, there were no apparent gross morphological defects on the H & E stained sections. However, there were differences in cross sectional area of the muscle fibers. In CBS+/- mice, there were more of medium size fibers instead of larger muscle fibers observed with the wild type muscles. Though there is some correlation between increase in muscle fiber CSA and physical performance, the correlation is not solid. For example, inhibition of myostatin receptor through chemical means resulted in enhanced CSA but with diminished specific force [35]. Hence, mere reduction in muscle fiber CSA may not account for the observed changes in the physical performance and muscle contractile force.
To further characterize underlying molecular changes during HHcy induced fatigability, we considered alterations in metabolic, structural and mitochondrial function as potential starting points. Accordingly, we measured levels of certain key enzymes that regulate aerobic and anaerobic metabolism and found no significant changes (Fig.3A). Previous studies have found that there was significant elevation of MM-CK levels in the plasma from the hyperhomocysteinemic rats indicating HHcy inflicted muscle damage [43]. Our results suggest that there was no significant difference in the creatine kinase levels between WT and CBS+/-mouse muscles implying no apparent imbalance in the energy homeostasis. Together our findings demonstrate that there were no significant alterations in the key enzymes that regulate muscle metabolism. However, skeletal muscles form CBS+/- exhibited low levels of ATP presence and the ATP levels were increased after 4 weeks of exercise (Fig.3B) indicating some problem with either energy production or utilization during HHcy. One limitation of the current study is that relative amounts of other glycolytic enzymes [phosphofructokinase, hexokinase (HK)], as well as glycogenolytic enzyme (glycogen phosphorylase) were not assessed. Though, glyceraldehyde phosphate dehydrogenase mRNA levels were increased to some extent in the CBS+/- mice, the differences were not significant (not showed). Nonetheless, decreased ATP concentration and reduced propensity for mitochondrial replication and transcription (lower levels of mtTFA) together suggest that the mitochondrial function is compromised during HHcy conditions. Furthermore, we showed that the relative quantities of the negative regulator of mtTFA, mir-494, were increased in CBS+/- mice. Interestingly, exercise was able to reverse the concentrations of mtTFA and mir-494, especially in CBS+/- mice. These results would voice for a model where HHcy mediated epigenetic changes might augment mir-494 concentration and diminish mtTFA amount and thereby compromise ATP production and attenuate muscle contractile properties. Whereas regular exercise, by preventing mir-494 level augmentation during HHcy, could potentially ameliorate fatigability. Other studies also reported involvement of mir-494 and mtTFA in skeletal muscle function and in general our results conform to these previous reports [16, 37].
Alterations in mitochondrial biogenesis were also reported to cause diminished skeletal muscle performance and enhanced fatigability. In the current study we also examined if there were any alteration in mitochondrial biogenesis, specifically in the quantities of the regulator of mitochondrial fusion, Mfn2. Neither the exercise regimen we employed nor the HHcy condition were able to perturb the amount of Mfn2 in skeletal muscles. However, with our current study we could not rule out the possibility that HHcy might alter the mitochondrial fission and derail the healthy mitochondrial pool in skeletal muscles. Nonetheless, relative amounts of mir-499, which targets Drp-1 and a known regulator of mitochondrial fission [40], was not significantly altered in CBS+/- mice. This might argue against the possible role of mitochondrial fission regulators in the fatigability of CBS+/- mice at least through mir-499.
Changes in structural proteins have been reported to cause muscle injury and fatigability. Here we examined quantities of one such candidate, dystrophin, most frequently altered in human myopathies, in CBS+/- and wild type mice. Though we were able to observe differential expression of dystrophin between groups, the concentrations varied among each group. Currently, we have no explanation for such variability among the individuals. Nonetheless, consistent with declined tendency for dystrophin levels in the CBS+/- mouse muscles, previous report has found that HHcy inflicts muscle damage as there was significant accumulation of MM-CK in the plasma which were correlated with elevated Hcy levels [43]. Given that dystrophin deficiency is frequently associated with MM-CK release from the muscles [44], our current finding with previous results [43] suggest that HHcy mediated inhibition of dystrophin expression might be the reason behind the muscle damage and elevation in the plasma MM-CK [43]. Apart from apparent dystrophin level reduction in CBS+/- mouse muscles, other potential mechanism that might damage muscles during HHcy condition is heightened oxidative stress which may damage sarcolemmal membrane. Our unpublished results and along with the other data from different organ systems including skeletal muscles during HHcy condition, may point to the compromised oxidative stress handling during HHcy condition [8, 45]. Further, oxidative stress has been implicated with fatigue, mitochondrial dysfunction as well [46]. When considered moderate exercise and HHcy both increase oxidative stress [8, 47], it is still not clear how HHcy condition differs from exercise. It could be the intensity and/or persistence of oxidative stress along with the other changes reported (epigenetic) in this manuscript could contribute to the fatigue. Other potential mechanisms involve Ca2+ mishandling which might lead to fatigue as well [48]. Future studies will clarify more on these possibilities.
With 4 weeks of exercise we were unable to observe any significant change in dystrophin quantities in both the groups. Inability of exercise to alter dystrophin protein amount was reported before in humans and our findings further corroborate this conclusion [49]. Though we were able to observe a negative correlation between the amounts of dystrophin and mir-31 in CBS+/- mice, the correlation was lost after exercise. This finding contrasts the previous finding that mir-31 regulates dystrophin protein levels [39]. Though previous reports documented the negative correlation between exercise and levels of mir-31 and mir-494, in our study only mir-31 behaved in such fashion in CBS+/- mice [37, 38]. The apparent differences observed here could be due to differences in intensity or duration of exercise regimen employed. Interestingly, in addition to lack of exercise influence over mir-499 quantities, we noted that this particular microRNA expresses in very low amounts in both the groups further downgrading its ability to mediate any physiological responses in skeletal muscles. In addition mir-499 expression might have very well diminished in differentiated matured muscles, as its expression is regulated by the myogenic transcriptional factors such as MyoD [50], suggesting its limited role during the muscle differentiation phase.
Modifications in epigenetic patterns have been proposed before, but not tested to have a causal role in fatigue [13]. Here we show that HHcy mediated epigenetic changes could potentially undermine skeletal muscle ability to function. The potential ramification from the current study is enhanced DNA methylation and increased expression of DNMT3 isoforms which might change gene expression either directly by regulating transcription of mtTFA or indirectly through upregulation of microRNAs. Here we have characterized one such negative association between mtTFA and mir-494 during HHcy. Our current study could not rule out changes in other potential mtTFA targeting microRNAs. In addition, indirect regulation might also occur through changes in levels of transcription factors such as PGC-1α and NRF-1 that regulate mtTFA expression and mitochondrial biogenesis [41]. In our previous study, we could not observe any significant change in the amounts of PGC-1α between intact C57 and CBS+/- mice [34]. The current study observed a significant decrease in NRF-1 mRNA expression in HHcy mice in addition to enhanced mir-494. These findings together suggested orchestration of concerted multi-pronged changes during HHcy leading to reduced mtTFA levels and mitochondrial function to cause enhanced fatigability. Currently, the mechanisms of NRF-1 down regulation during HHcy are not determined. It is also possible that mir-31 and mir-494 might affect other targets not studied here that could cause fatigability. Future studies will provide more information with regard to these possibilities.
Other potential mechanisms with regard to enhancement of ATP concentrations after exercise might be worth considering, but not tested in the current study are: 1) it was previously reported that exercise alleviates plasma Hcy levels by enhancing the BHMT levels in kidney [51-53]. The reduction in Hcy levels might potentially reverse adverse influence on mtTFA levels and restores proper mitochondrial function and ATP levels. 2) Exercise has been shown to enhance PGC-1α and NRF (Fig. 6D) transcription factors which might enhance mtTFA levels/function and thereby counters the HHcy induced decline in mtTFA levels [42]. 3) It is also possible that a combination of the above two possibilities might also confer the observed effects. Future studies would render more details with regard to which of these aspects are in place after exercise in reversal of HHcy mediated diminished performance.
Highlights.
HHcy is associated with diminished physical performance & muscle force generation.
HHcy alters muscle fiber size and tissue ATP levels.
Alterations in mtTFA and its regulators microRNA and NRF-1 were present.
Exercise reverses some of the HHcy induced changes.
HHcy causes changes in global methylation and its regulators.
Highlights.
Quality and consistency are improved.
Incorporated more discussion to realistically evaluate our results in line with the perceived perceptions in the field.
Performed better images of H& E staining images (we have working imaging software now).
Measured MM-CK levels in the muscles between groups.
Measured NRF-1 levels after exercise.
Acknowledgments
Part of the research in the current study is supported by the NIH grants (HL-74185, NS-84823, and HL-108621) to Dr. Tyagi.
Abbreviations
- mir
microRNA
- DNMT
DNA methyltransferase
- CBS
Cystathionine β-synthase
- HHcy
hyperhomocysteinemia
- Hcy
homocysteine
- mtTFA
mitochondrial transcription factor A
- Mfn2
Mitofusion 2
- H3K18
histone H3 lysine 18
- LDH
Lactate dehydrogenase
- CS
citrate synthase
- COX-IV
Cytochrome C oxidase subunit IV
- 5-mC
5 methylCytosine
- PGC-1α
Peroxisome proliferator-activated receptor-gamma coactivator (PGC)-1alpha
- BHMT
betaine-homocysteine S-methyltransferase
- NRF
nuclear respiratory factor
- MM-CK
Creatine kinase muscle specific
Footnotes
Contributions: SV and SCT conceived the project at the early stages, SV further progressed the project, designed the experiments, collected the data, interpreted the results and wrote the manuscript. WL conducted the exercise protocol and prepared the total protein and RNA from the samples. SCT provided the necessary input and supervised the project.
Publisher's Disclaimer: This is a PDF file of an unedited manuscript that has been accepted for publication. As a service to our customers we are providing this early version of the manuscript. The manuscript will undergo copyediting, typesetting, and review of the resulting proof before it is published in its final citable form. Please note that during the production process errors may be discovered which could affect the content, and all legal disclaimers that apply to the journal pertain.
Bibliography
- 1.Laakso M. Cardiovascular Disease in Type 2 Diabetes From Population to Man to Mechanisms – The Kelly West Award Lecture 2008. Diabetes Care. 2010;33:442–449. doi: 10.2337/dc09-0749. [DOI] [PMC free article] [PubMed] [Google Scholar]
- 2.Santoro N. Childhood obesity and type 2 diabetes: the frightening epidemic. World J Pediatr. 2013;9:101–102. doi: 10.1007/s12519-013-0410-8. [DOI] [PubMed] [Google Scholar]
- 3.Smyth S, Heron A. Diabetes and obesity: the twin epidemics. Nat Med. 2006;12:75–80. doi: 10.1038/nm0106-75. [DOI] [PubMed] [Google Scholar]
- 4.Fiuza-Luces C, Garatachea N, Berger NA, Lucia A. Exercise is the Real Polypill. Physiology. 2013;28:330–358. doi: 10.1152/physiol.00019.2013. [DOI] [PubMed] [Google Scholar]
- 5.Toledo FGS, Goodpaster BH. The role of weight loss and exercise in correcting skeletal muscle mitochondrial abnormalities in obesity, diabetes and aging. Mol Cell Endocrinol. 2013;379:30–34. doi: 10.1016/j.mce.2013.06.018. [DOI] [PubMed] [Google Scholar]
- 6.O'Gorman DJ, Krook A. Exercise and the Treatment of Diabetes and Obesity. Med Clin N Am. 2011;95:953–+. doi: 10.1016/j.mcna.2011.06.007. [DOI] [PubMed] [Google Scholar]
- 7.Mancuso M, Angelini C, Bertini E, Carelli V, Comi GP, Minetti C, Moggio M, Mongini T, Servidei S, Tonin P, Toscano A, Uziel G, Zeviani M, Siciliano G, Collaborative NWI. Fatigue and exercise intolerance in mitochondrial diseases. Literature revision and experience of the Italian Network of mitochondrial diseases. Neuromuscular Disord. 2012;22:S226–S229. doi: 10.1016/j.nmd.2012.10.012. [DOI] [PMC free article] [PubMed] [Google Scholar]
- 8.Veeranki S, Tyagi SC. Defective homocysteine metabolism: potential implications for skeletal muscle malfunction. Int J Mol Sci. 2013;14:15074–15091. doi: 10.3390/ijms140715074. [DOI] [PMC free article] [PubMed] [Google Scholar]
- 9.Westerblad H, Place N, Yamada T. Mechanisms of Skeletal Muscle Weakness. Adv Exp Med Biol. 2010;682:279–296. doi: 10.1007/978-1-4419-6366-6_16. [DOI] [PubMed] [Google Scholar]
- 10.Blake DJ, Weir A, Newey SE, Davies KE. Function and genetics of dystrophin and dystrophin-related proteins in muscle. Physiological reviews. 2002;82:291–329. doi: 10.1152/physrev.00028.2001. [DOI] [PubMed] [Google Scholar]
- 11.Davies KE, Nowak KJ. Molecular mechanisms of muscular dystrophies: old and new players. Nat Rev Mol Cell Bio. 2006;7:762–773. doi: 10.1038/nrm2024. [DOI] [PubMed] [Google Scholar]
- 12.Jahnke VE, Van Der Meulen JH, Johnston HK, Ghimbovschi S, Partridge T, Hoffman EP, Nagaraju K. Metabolic remodeling agents show beneficial effects in the dystrophin-deficient mdx mouse model. Skeletal muscle. 2012;2:16. doi: 10.1186/2044-5040-2-16. [DOI] [PMC free article] [PubMed] [Google Scholar]
- 13.Landmark-Hoyvik H, Reinertsen KV, Loge JH, Kristensen VN, Dumeaux V, Fossa SD, Borresen-Dale AL, Edvardsen H. The Genetics and Epigenetics of Fatigue. Pm&R. 2010;2:456–465. doi: 10.1016/j.pmrj.2010.04.003. [DOI] [PubMed] [Google Scholar]
- 14.Filler K, Lyon D, Bennett J, McCain N, Elswick R, Lukkahatai N, Saligan LN. Association of Mitochondrial Dysfunction and Fatigue: A Review of the Literature. BBA clinical. 2014;1:12–23. doi: 10.1016/j.bbacli.2014.04.001. [DOI] [PMC free article] [PubMed] [Google Scholar]
- 15.Myhill S, Booth NE, McLaren-Howard J. Chronic fatigue syndrome and mitochondrial dysfunction. Int J Clin Exp Med. 2009;2:1–16. [PMC free article] [PubMed] [Google Scholar]
- 16.Wredenberg A, Wibom R, Wilhelmsson H, Graff C, Wiener HH, Burden SJ, Oldfors A, Westerblad H, Larsson NG. Increased mitochondrial mass in mitochondrial myopathy mice. Proceedings of the National Academy of Sciences of the United States of America. 2002;99:15066–15071. doi: 10.1073/pnas.232591499. [DOI] [PMC free article] [PubMed] [Google Scholar]
- 17.Yamada T, Ivarsson N, Hernandez A, Fahlstrom A, Cheng AJ, Zhang SJ, Bruton JD, Ulfhake B, Westerblad H. Impaired mitochondrial respiration and decreased fatigue resistance followed by severe muscle weakness in skeletal muscle of mitochondrial DNA mutator mice. J Physiol-London. 2012;590:6187–6197. doi: 10.1113/jphysiol.2012.240077. [DOI] [PMC free article] [PubMed] [Google Scholar]
- 18.Cartoni R, Leger B, Hock MB, Praz M, Crettenand A, Pich S, Ziltener JL, Luthi F, Deriaz O, Zorzano A, Gobelet C, Kralli A, Russell AP. Mitofusins 1/2 and ERR alpha expression are increased in human skeletal muscle after physical exercise. J Physiol-London. 2005;567:349–358. doi: 10.1113/jphysiol.2005.092031. [DOI] [PMC free article] [PubMed] [Google Scholar]
- 19.Weston AR, Karamizrak O, Smith A, Noakes TD, Myburgh KH. African runners exhibit greater fatigue resistance, lower lactate accumulation, and higher oxidative enzyme activity. Journal of Applied Physiology. 1999;86:915–923. doi: 10.1152/jappl.1999.86.3.915. [DOI] [PubMed] [Google Scholar]
- 20.Houmard JA, Weidner ML, Gavigan KE, Tyndall GL, Hickey MS, Alshami A. Fiber type and citrate synthase activity in the human gastrocnemius and vastus lateralis with aging. Journal of Applied Physiology. 1998;85:1337–1341. doi: 10.1152/jappl.1998.85.4.1337. [DOI] [PubMed] [Google Scholar]
- 21.Tesch P, Sjodin B, Thorstensson A, Karlsson J. Muscle Fatigue and Its Relation to Lactate Accumulation and Ldh Activity in Man. Acta Physiol Scand. 1978;103:413–420. doi: 10.1111/j.1748-1716.1978.tb06235.x. [DOI] [PubMed] [Google Scholar]
- 22.McArdle A, McArdle F, Jackson MJ, Page SF, Fahal I, Edwards RHT. Investigation by polymerase chain reaction of enteroviral infection in patients with chronic fatigue syndrome. Clin Sci. 1996;90:295–300. doi: 10.1042/cs0900295. [DOI] [PubMed] [Google Scholar]
- 23.Jaenisch R, Bird A. Epigenetic regulation of gene expression: how the genome integrates intrinsic and environmental signals. Nature genetics. 2003;33:245–254. doi: 10.1038/ng1089. [DOI] [PubMed] [Google Scholar]
- 24.Mukherji S, Ebert MS, Zheng GXY, Tsang JS, Sharp PA, van Oudenaarden A. MicroRNAs can generate thresholds in target gene expression. Nature genetics. 2011;43:854–U860. doi: 10.1038/ng.905. [DOI] [PMC free article] [PubMed] [Google Scholar]
- 25.Valencia-Sanchez MA, Liu JD, Hannon GJ, Parker R. Control of translation and mRNA degradation by miRNAs and siRNAs. Gene Dev. 2006;20:515–524. doi: 10.1101/gad.1399806. [DOI] [PubMed] [Google Scholar]
- 26.Ntanasis-Stathopoulos J, Tzanninis JG, Philippou A, Koutsilieris M. Epigenetic regulation on gene expression induced by physical exercise. J Musculoskel Neuron. 2013;13:133–146. [PubMed] [Google Scholar]
- 27.Kalra BR, Ghose S, Sood NN. Homocystinuria with bilateral absolute glaucoma. Indian J Ophthalmol. 1985;33:195–197. [PubMed] [Google Scholar]
- 28.Watanabe M, Osada J, Aratani Y, Kluckman K, Reddick R, Malinow MR, Maeda N. Mice deficient in cystathionine beta-synthase: animal models for mild and severe homocyst(e)inemia. Proc Natl Acad Sci U S A. 1995;92:1585–1589. doi: 10.1073/pnas.92.5.1585. [DOI] [PMC free article] [PubMed] [Google Scholar]
- 29.Liu Y, Sugiura Y, Wu FF, Mi WT, Taketo MM, Cannon S, Carroll T, Lin WC. beta-Catenin stabilization in skeletal muscles, but not in motor neurons, leads to aberrant motor innervation of the muscle during neuromuscular development in mice. Dev Biol. 2012;366:255–267. doi: 10.1016/j.ydbio.2012.04.003. [DOI] [PMC free article] [PubMed] [Google Scholar]
- 30.Veeranki S, Givvimani S, Pushpakumar S, Tyagi SC. Hyperhomocysteinemia attenuates angiogenesis through reduction of HIF-1alpha and PGC-1alpha levels in muscle fibers during hindlimb ischemia. American journal of physiology Heart and circulatory physiology. 2014;306:H1116–1127. doi: 10.1152/ajpheart.00003.2014. [DOI] [PMC free article] [PubMed] [Google Scholar]
- 31.Senf SM, Howard TM, Ahn B, Ferreira LF, Judge AR. Loss of the Inducible Hsp70 Delays the Inflammatory Response to Skeletal Muscle Injury and Severely Impairs Muscle Regeneration. PloS one. 2013;8 doi: 10.1371/journal.pone.0062687. [DOI] [PMC free article] [PubMed] [Google Scholar]
- 32.Givvimani S, Munjal C, Tyagi N, Sen U, Metreveli N, Tyagi SC. Mitochondrial division/mitophagy inhibitor (Mdivi) Ameliorates Pressure Overload Induced Heart Failure. PloS one. 2012;7 doi: 10.1371/journal.pone.0032388. [DOI] [PMC free article] [PubMed] [Google Scholar]
- 33.Narayanan N, Pushpakumar SB, Givvimani S, Kundu S, Metreveli N, James D, Bratcher AP, Tyagi SC. Epigenetic regulation of aortic remodeling in hyperhomocysteinemia. Faseb J. 2014;28:3411–3422. doi: 10.1096/fj.14-250183. [DOI] [PMC free article] [PubMed] [Google Scholar]
- 34.Veeranki S, Givvimani S, Pushpakumar S, Tyagi SC. Hyperhomocysteinemia attenuates angiogenesis through reduction of HIF-1 alpha and PGC-1 alpha levels in muscle fibers during hindlimb ischemia. Am J Physiol-Heart C. 2014;306:H1116–H1127. doi: 10.1152/ajpheart.00003.2014. [DOI] [PMC free article] [PubMed] [Google Scholar]
- 35.Watt KI, Jaspers RT, Atherton P, Smith K, Rennie MJ, Ratkevicius A, Wackerhage H. Sb431542 Treatment Promotes the Hypertrophy of Skeletal Muscle Fibers but Decreases Specific Force. Muscle Nerve. 2010;41:624–629. doi: 10.1002/mus.21573. [DOI] [PubMed] [Google Scholar]
- 36.Russell AP, Lamon S, Boon H, Wada S, Guller I, Brown EL, Chibalin AV, Zierath JR, Snow RJ, Stepto N, Wadley GD, Akimoto T. Regulation of miRNAs in human skeletal muscle following acute endurance exercise and short-term endurance training. J Physiol-London. 2013;591:4637–4653. doi: 10.1113/jphysiol.2013.255695. [DOI] [PMC free article] [PubMed] [Google Scholar]
- 37.Yamamoto H, Morino K, Nishio Y, Ugi S, Yoshizaki T, Kashiwagi A, Maegawa H. MicroRNA-494 regulates mitochondrial biogenesis in skeletal muscle through mitochondrial transcription factor A and Forkhead box j3. Am J Physiol-Endoc M. 2012;303:E1419–E1427. doi: 10.1152/ajpendo.00097.2012. [DOI] [PubMed] [Google Scholar]
- 38.Mooren FC, Viereck J, Kruger K, Thum T. Circulating micrornas as potential biomarkers of aerobic exercise capacity. Am J Physiol-Heart C. 2014;306:H557–H563. doi: 10.1152/ajpheart.00711.2013. [DOI] [PMC free article] [PubMed] [Google Scholar]
- 39.Cacchiarelli D, Incitti T, Martone J, Cesana M, Cazzella V, Santini T, Sthandier O, Bozzoni I. miR-31 modulates dystrophin expression: new implications for Duchenne muscular dystrophy therapy. Embo Rep. 2011;12:136–141. doi: 10.1038/embor.2010.208. [DOI] [PMC free article] [PubMed] [Google Scholar]
- 40.Wang JX, Jiao JQ, Li Q, Long B, Wang K, Liu JP, Li YR, Li PF. miR-499 regulates mitochondrial dynamics by targeting calcineurin and dynamin-related protein-1. Nat Med. 2011;17:71–78. doi: 10.1038/nm.2282. [DOI] [PubMed] [Google Scholar]
- 41.Yu L, Yang SJ. Amp-Activated Protein Kinase Mediates Activity-Dependent Regulation of Peroxisome Proliferator-Activated Receptor Gamma Coactivator-1 Alpha and Nuclear Respiratory Factor 1 Expression in Rat Visual Cortical Neurons. Neuroscience. 2010;169:23–38. doi: 10.1016/j.neuroscience.2010.04.063. [DOI] [PubMed] [Google Scholar]
- 42.Baar K, Wende AR, Jones TE, Marison M, Nolte LA, Chen M, Kelly DP, Holloszy JO. Adaptations of skeletal muscle to exercise: rapid increase in the transcriptional coactivator PGC-1. Faseb J. 2002;16:1879–1886. doi: 10.1096/fj.02-0367com. [DOI] [PubMed] [Google Scholar]
- 43.Miller A, Mujumdar V, Shek E, Guillot J, Angelo M, Palmer L, Tyagi SC. Hyperhomocyst(e)inemia induces multiorgan damage. Heart and Vessels. 2000;15:135–143. doi: 10.1007/s003800070030. [DOI] [PubMed] [Google Scholar]
- 44.Goldstein JA, McNally EM. Mechanisms of muscle weakness in muscular dystrophy. J Gen Physiol. 2010;136:29–34. doi: 10.1085/jgp.201010436. [DOI] [PMC free article] [PubMed] [Google Scholar]
- 45.Kolling J, Scherer EB, Siebert C, Marques EP, Dos Santos TM, Wyse AT. Creatine prevents the imbalance of redox homeostasis caused by homocysteine in skeletal muscle of rats. Gene. 2014 doi: 10.1016/j.gene.2014.05.005. [DOI] [PubMed] [Google Scholar]
- 46.Armstrong CW, McGregor NR, Butt HL, Gooley PR. Metabolism in Chronic Fatigue Syndrome. Adv Clin Chem. 2014;66:121–172. doi: 10.1016/b978-0-12-801401-1.00005-0. [DOI] [PubMed] [Google Scholar]
- 47.Hammouda O, Chtourou H, Chaouachi A, Chahed H, Ferchichi S, Kallel C, Chamari K, Souissi N. Effect of short-term maximal exercise on biochemical markers of muscle damage, total antioxidant status, and homocysteine levels in football players. Asian journal of sports medicine. 2012;3:239–246. doi: 10.5812/asjsm.34544. [DOI] [PMC free article] [PubMed] [Google Scholar]
- 48.Rouviere C, Corona BT, Ingalls CP. Oxidative capacity and fatigability in run-trained malignant hyperthermia-susceptible mice. Muscle Nerve. 2012;45:586–596. doi: 10.1002/mus.22343. [DOI] [PMC free article] [PubMed] [Google Scholar]
- 49.Woolstenhulme MT, Conlee RK, Drummond MJ, Stites AW, Parcell AC. Temporal response of desmin and dystrophin proteins to progressive resistance exercise in human skeletal muscle. Journal of Applied Physiology. 2006;100:1876–1882. doi: 10.1152/japplphysiol.01592.2005. [DOI] [PubMed] [Google Scholar]
- 50.Yeung F, Chung E, Guess MG, Bell ML, Leinwand LA. Myh7b/miR-499 gene expression is transcriptionally regulated by MRFs and Eos. Nucleic acids research. 2012;40:7303–7318. doi: 10.1093/nar/gks466. [DOI] [PMC free article] [PubMed] [Google Scholar]
- 51.Neuman JC, Albright KA, Schainske KL. Exercise prevents hyperhomocysteinemia in a dietary folate-restricted mouse model. Nutrition Research. 2013;33:487–493. doi: 10.1016/j.nutres.2013.04.008. [DOI] [PubMed] [Google Scholar]
- 52.Randeva HS, Lewandowski KC, Drzewoski Z, Brooke-Wavell K, O'Callaghan C, Czupryniak L, Hillhouse EW, Prelevic GM. Exercise decreases plasma total homocysteine in overweight young women with polycystic ovary syndrome. Journal of Clinical Endocrinology & Metabolism. 2002;87:4496–4501. doi: 10.1210/jc.2001-012056. [DOI] [PubMed] [Google Scholar]
- 53.Winchester L, Veeranki S, Givvimani S, Tyagi SC. Exercise mitigates the adverse effects of hyperhomocysteinemia on macrophages, MMP-9, skeletal muscle, and white adipocytes. Canadian journal of physiology and pharmacology. 2014;92:575–582. doi: 10.1139/cjpp-2014-0059. [DOI] [PubMed] [Google Scholar]