Figure 1.
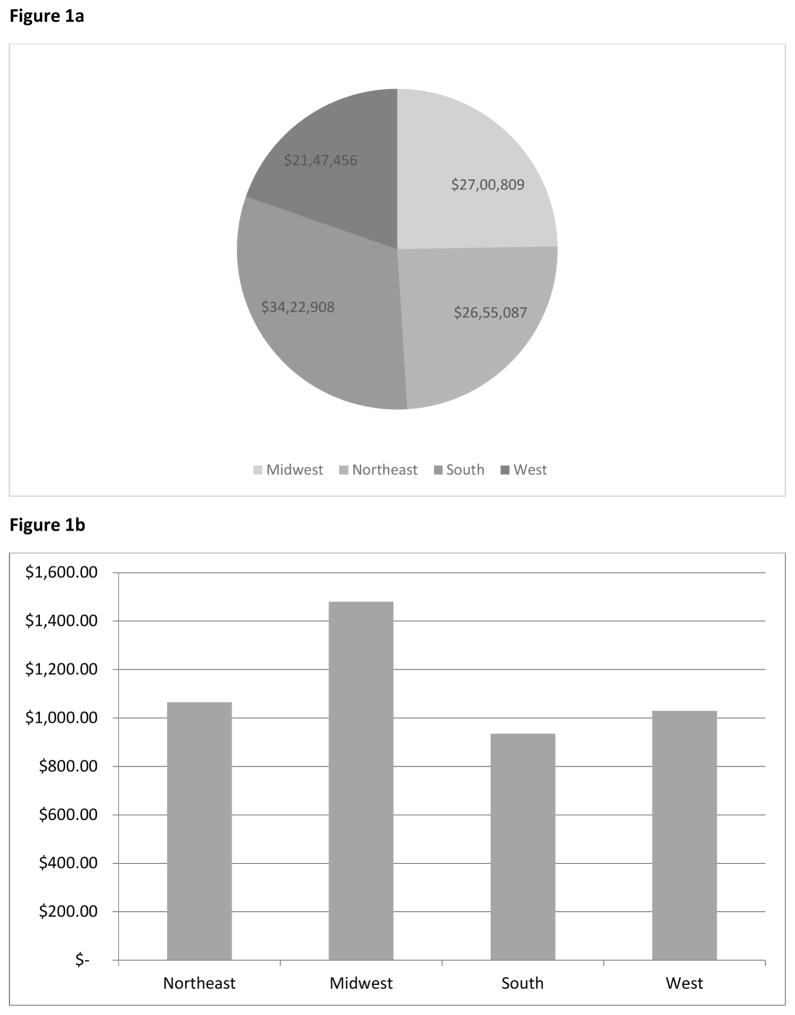
Figure 1a – Distribution of payments to providers by geographic region
All sums are reported in US Dollars. The geographic region was determined by the state in the address listed for each provider.
Figure 1b - Average payments received per physician ID by each geographic region
All sums are reported in US Dollars. The geographic region was determined by the state in the address listed for each provider. Some providers may have received payments attributed to different regions.

