

Abstract
Objective
To describe the baseline characteristics of the Primary Open-Angle African-American Glaucoma Genetics (POAAGG) study cohort, the largest African-American primary open-angle glaucoma (POAG) population recruited at a single institution (University of Pennsylvania, Department of Ophthalmology, Scheie Eye Institute) to date.
Design
Population-based, cross-sectional, case-control study.
Participants
2,520 African-American subjects 35 years and older, recruited from the greater Philadelphia, Pennsylvania area.
Methods
Each subject underwent a detailed interview and eye examination. The interview assessed demographic, behavioral, medical, and ocular risk factors. Current zip codes surrounding the University of Pennsylvania were recorded and United States census data were queried to infer socioeconomic status. The eye exam included measurement of visual acuity and intraocular pressure, a detailed anterior and posterior segment examination including gonioscopy, dilated fundus and optic disc examination, visual fields, stereo disc photography, optical coherence tomography imaging, and measurement of central corneal thickness.
Main Outcome Measures
The baseline characteristics of gender, age, and glaucoma diagnosis were collected. Body mass index (BMI), hypertension, diabetes, and alcohol and tobacco use, as well as ocular conditions including blindness, cataract, non-proliferative diabetic retinopathy, age-related macular degeneration, and use of ocular medication and surgery, were examined. Median population density, income, education level, and other socioeconomic measures were determined for the study cohort.
Results
Of the 2,520 African-Americans recruited to the POAAGG study to date, 2,067 (82.0%) including 807 controls and 1,260 POAG cases met all inclusion criteria and completed the detailed clinical ocular exam. Cases were more likely to have a lower BMI (p<0.01) and report a history of blindness (visual acuity of 20/200 or worse, p<0.001), while controls were more likely to have diabetes (p<0.001), have non-proliferative diabetic retinopathy (p=0.02), and be female (p<0.001). Study participants were drawn largely from predominantly African-American neighborhoods (African-American population 67.7-70.0%) of low income, high unemployment, and lower education, surrounding the University of Pennsylvania.
Conclusions
The POAAGG study has currently recruited over 2,000 African-Americans eligible for a POAG genetics study. Blindness and low BMI were significantly associated with POAG. This population was predominantly recruited from neighborhoods whose population income exists at or near the Federal Poverty Level.
Introduction
Glaucoma is the leading cause of irreversible vision loss worldwide, and primary open-angle glaucoma (POAG) is the most common form of the disease.1 POAG develops as retinal ganglion cell damage causing optic nerve degeneration with subsequent progressive, irreversible vision loss.2 POAG is phenotypically heterogeneous, characterized by a spectrum of disease severity and progression. The mechanisms through which POAG develops are not well understood. Several risk factors increase an individual’s risk of developing POAG, including advanced age, a positive family history, and African-American race.3-5
Multiple epidemiological studies have confirmed that POAG prevalence is higher in African-Americans than other race/ethnicity groups.6,7 African-Americans develop POAG an average of ten years earlier and are four times more likely to be blinded by POAG than Caucasians.6 POAG risk strongly correlates with family history in African descent populations, suggesting that African ancestry, genetic factors, and/or shared environmental factors underlie the increased risk of POAG in African-American people.8,9 Studies in Nigeria,10 Barbados,11 the Congo,12 and Baltimore8 demonstrate odds of POAG up to 18-fold higher in individuals of African descent with positive family history compared to African controls without glaucoma.12 The increased prevalence and risk for vision loss highlight the need to investigate the etiology of POAG within this disparately affected population.
Family and twin studies suggest a strong genetic contribution to POAG and large genetic studies are in progress.4,5,13,14 Linkage analyses have implicated Myocilin and Optineurin genes to POAG15 and Genome-Wide Association Studies (GWAS) have identified another 18 loci of smaller effect,14 although understanding their role in disease etiology and progression requires additional investigation. To date, most genetic studies have been conducted in populations of European descent,3,14 despite the increased risk and severity of disease in African-Americans. The relevance of these findings for African-Americans remains unknown.
The goal of the Primary Open-Angle African-American Glaucoma Genetics (POAAGG) study is to identify the genetic and other risk factors that underlie POAG in African-Americans and to understand the basis for the increased disease burden in this population. Long-term goals include performing a comprehensive genetic analysis of POAG, including a GWAS as well as whole genome sequencing and functional studies of variants, along with deep endophenotyping, in order to construct a risk model for POAG in African-Americans. The objectives of this paper are to present the baseline characteristics and to characterize the socioeconomic environment of the POAAGG participants.
The initial stage of the POAAGG study is a five year population-based project funded by the National Eye Institute of the National Institutes of Health. POAAGG is designed to elucidate the genetic architecture of POAG as well as to determine the effect of demographic, environmental, and ocular and medical co-morbidities for glaucoma in the high-risk but understudied African-American population. Two cohorts of POAG cases and controls have been identified from (1) the University of Pennsylvania (UPenn) including the Scheie Eye Institute (SEI), The Perelman Center for Advanced Medicine (PCAM), and the Mercy Fitzgerald Hospital (MFH) UPenn Ophthalmology satellite; and (2) the Kaiser Permanente Research Program on Genes, Environment and Health, Genetic Epidemiology Research in Adult Health and Aging (GERA) 110,000 person population in California who were recruited to participate in studies of genetic and environmental risk factors on health. Only the UPenn population recruited to date is detailed in this initial report. The patient population seen at UPenn comes mostly from the population of lower socioeconomic status adults of west and southwest Philadelphia. Approval to enroll and to recontact subjects was obtained from the UPenn institutional review board (IRB).
Methods
Ascertainment and Eligibility
Participants were identified within all comprehensive and subspecialty clinics at SEI, PCAM, and MFH. UPenn certified clinical research coordinators screened potential subjects based on IRB-approved inclusion/exclusion criteria. Inclusion criteria include age over 35 years and self-identification as Black (African-American, African descent, or African Caribbean). Exclusion criteria include a history of narrow angle, closed angle, neovascular, mixed mechanism, or pseudoexfoliation glaucoma; history of glaucoma secondary to eye surgery or secondary to severe ocular trauma; history of iritis, uveitis, or iridocyclitis; presence of Grave’s disease with ocular manifestations, vascular occlusion causing neovascularization of the iris, optic nerve atrophy from other diagnoses, or advanced proliferative diabetic retinopathy. Informed consent was obtained from all participating subjects.
Study Procedures
The clinical examination included an onsite ophthalmic exam and interview. Examination data were recorded on case report forms and then entered directly into the POAAGG REDCap (Research Electronic Data Capture) database utilized at UPenn.16 REDCap is an online, secure database used for clinical research studies. Its functions include: (1) a user-friendly platform for data entry; (2) a tracking system for manipulation and exportation of data; and (3) data import and export procedures to and from common statistical programs. Data collection was standardized and included a series of measurements taken by clinical research coordinators, ophthalmic technicians, and ophthalmologists who are fellowship-trained in the glaucoma subspecialty.
The full onsite exam included: (1) verification of name, age, date of birth, street address, gender, and informed consent with signature (2) completion of a questionnaire in-clinic; (3) evaluation of height and weight; (4) explanation of procedure for blood collection for DNA analysis; (5) Visual Acuity (VA) measured using Snellen chart at 20 feet; (6) automated refraction with a Reichert Phoropter RS Automatic Refractor (Reichert Technologies, Depew, NY) if the presented VA was not 20/20 in either eye, followed by manual refraction; (7) near vision assessed using the Snellen chart at near with the participant’s present reading prescription; (8) intraocular pressure (IOP) measured with a Goldmann applanation tonometer; (9) anterior and posterior segment examinations by slit lamp with a 90-diopter lens for optic nerve examination and indirect ophthalmoscopy; (10) gonioscopy confirming the presence of an Open-Angle; (11) central corneal thickness and axial length measurements assessed with an ultrasonic A-scan/pachymeter DGH 4000B SBH IOL Computation module (DGH Tech Inc., Exton, PA); (12) visual field test utilizing the Humphrey Automated Field Analyzer (Standard 24-2 Swedish interactive thresholding algorithm); (13) stereo disc photos and fundus photography utilizing the Topcon TRC 50EX Retinal Camera (Topcon Corp. of America, Paramus, NJ); (14) Optical coherence topography (OCT) using either Cirrus or Stratus OCT (Carl Zeiss Meditec, Dublin, CA). The outcomes of the procedures and all diagnoses were discussed with the patient at the conclusion of the examination.
Phenotyping
Cases and controls were selected from the UPenn patient population based on the following criteria. POAG cases were defined as having an open iridocorneal angle and: (1) characteristic glaucomatous optic nerve findings in one or both eyes consisting of at least one of the following: notching, neuroretinal rim thinning, excavation, or a nerve fiber layer defect; (2) characteristic visual field defects on two consecutive reliable visual field tests in at least one eye, which were consistent with the observed optic nerve defects in that eye, as determined by fellowship-trained glaucoma specialists; and (3) all secondary causes of glaucoma excluded. Normal controls were defined as subjects older than 35, without: (1) high myopia (greater than −8.00 diopters); (2) high presbyopia (+8.00 diopters); (3) family history of POAG; (4) abnormal visual field; (5) IOP greater than 21 mmHg; (6) neuroretinal rim thinning, excavation, notching or nerve fiber layer defects; (7) optic nerves asymmetry; or (8) a cup to disc ratio difference between eyes greater than 0.2.
A masked preliminary concordance study of 20 cases and 20 controls from each institution with exchange of disc photos and visual fields between University of Southern California (Rohit Varma, MD, MPH), University of California San Diego (Robert Weinreb, MD), and UPenn (Eydie Miller-Ellis, MD; Prithvi Sankar, MD; Meredith Regina, MD, PhD) was conducted using “drop box” technology. All fields and discs were reviewed at all three centers. This study confirmed a 97% concordance rate between these three institutions in the diagnosis of the 120 total glaucoma cases and controls. These cases and controls included mild, moderate, and severe disease, although by definition mild cases still required concordance between optic nerve defect and visual field defect. Dr. Varma, primary investigator on the Los Angeles Latino Eye Study (LALES) and an expert on large-scale glaucoma studies in minority populations, provided a site visit to UPenn to assure accuracy and completeness of phenotyping and data collection. Dr. Varma is a Co-Investigator on the POAAGG grant.
Socioeconomic Status Estimates by Census Data
Demographic and socioeconomic information for the cohort was obtained using data from the 2010 United States Census Summary File Three17 and the 2008-2012 American Community Survey 5-Year Estimates.18 Population per square mile for each patient’s zip code was calculated by taking the population counts of the zip code from the 2010 United States Census and dividing it by the area (in square miles) obtained from the 2010 United States Census Gazetteer Files. Percentage of African-Americans in each zip code was calculated by dividing the African-American population by the total population in each zip code, using data from the 2010 United States Census. Median household income was defined as income in the past 12 months of households with a householder who self-identified as Black or African-American on the 2008-2012 American Community Surveys. The percentage of African-Americans in each zip code with income below the poverty threshold (an annual income of $11,139 for an individual and $22,314 for a family of four in 2010)19 was calculated using information from the 2008-2012 American Community Survey 5-Year Estimates.
Statistical Analysis
Comparisons between cases and controls were analyzed using linear regression models for continuous characteristics, logistic regression models for categorical characteristics, and both types of analyses were applied with and without age adjustment. Socioeconomic estimates were evaluated for all cases and controls within their respective residential zip codes and compared using linear regression models. All statistical computations were performed with SAS 9.4 (SAS Inc, Cary, NC). We reported the unadjusted p-values and age-adjusted p-values without correcting for multiple comparisons in tables. In addition, to avoid the risk of reporting the false positive results due to multiple comparisons, we also made the correction for multiple comparisons using approach of false discovery rate20,21 for comparisons within each category of baseline characteristics (i.e., demographics, medical comorbidities, ocular comorbidities, and socioeconomic status). The multiple comparison corrected p-values were reported as text when the multiple comparison correction changed their statistical significance. All the comparisons associated with p<0.01 were still statistically significant even after correcting for multiple comparisons.
One of the central goals of the POAAGG study is to examine genetic influences on the risk of POAG in African-Americans. We conducted a power analysis to determine the genetic effects that can be detected through this study. Most common variants that have been associated with human diseases through GWAS have genotype relative risks (GRR) of 1.5 or less; such findings are the norm, not the exception.22-24 For GWAS analysis in POAAGG, we assumed the conventional genome-wide significance level for a GWAS of 5×10⁻⁸ and an additive genetic model using Quanto version 1.2.4 (available from http://biostats.usc.edu/software). We estimated power for the combined discovery population (UPenn and GERA) that has been collected to date, a total of 10,350 subjects (2,515 cases, 7,835 controls). We have 80% power to detect GRRs of 1.38 or higher for variants with a minor allele frequency of 0.10. For more common variants, for example, those with a minor allele frequency of 0.5 or higher, we have 80% power to detect risks of 1.23 or greater. Comparing the power of the POAAGG discovery cohort to existing studies, the power is greater than that of the NEIGHBOR-Glaugen Consortium Primary Open-Angle Glaucoma Genome-wide Association Study, which has 80% power to detect a GRR of 1.4 and minor allele frequency of 0.10 in their combined dataset from 12 institutions (n=3,500 cases and 3,500 controls), and 80% power to detect effects of 1.26 or greater for variants with a minor allele frequency of 0.3 or greater.25 We note that the ongoing development of a POAAGG validation cohort will provide an opportunity to validate findings from the discovery set and provide even greater power for discover through meta-analysis.
Results
Recruitment and Ascertainment
A total of 2,520 participants were recruited to the POAAGG study from July 2010 until March 2014. Figure 1 is a flowchart of participation in POAAGG, with the number and criteria for ascertainment within each group. 453 participants were excluded because they (1) were categorized as non-African-American race by study questionnaires, (2) were diagnosed as glaucoma suspects (defined as an individual with risk factors that indicate an increased likelihood of developing POAG but without optic nerve damage or visual field defects) after completing the full clinical examination (3) did not receive the required detailed examination (4) did not receive all the required diagnostic testing (5) did not complete the questionnaire or (6) withdrew as subjects. 2,067 (82.0%) study subjects met inclusion criteria, including 1,260 African-American participants with clinical examination characteristics consistent with POAG and 807 glaucoma-free controls.
Figure 1.

Flowchart for classification of the Primary Open-Angle African-American Glaucoma Genetics Study cohort.
Baseline Characteristics
Research personnel administered study questionnaires to document demographic and clinical characteristics of participants. The mean age of the 2,067 participants was 67.3 ± 12.4 years and the majority (63%) were female. Table 1 summarizes key baseline characteristics for African-American POAG cases and controls. The mean age of the 807 controls was 61.3 ± 11.7 years. POAG cases were older, with an average age of 71.2 ± 11.3 years (p<0.0001). Due to the age gap between groups, all statistical comparisons for difference were age-adjusted. Consistent with prior reports,26 study controls were more likely to be female than cases (67.2% vs. 60.3%, p<0.001, age-adjusted).
Table 1.
Demographic and clinical characteristics of African-Americans with POAG compared with those who were unaffected in the Primary Open-Angle African-American Glaucoma Genetics Study cohort.
| Characteristic | n (%) | p-value | |||
|---|---|---|---|---|---|
| Control (N=807) |
Case (N=1260) |
Unadjusted | Age- Adjusted |
||
| Demographics | |||||
| Race (African American) | 807 (100%) | 1260 (100%) | |||
| Age | Mean (SD) | 61.3 (11.7) | 71.2 (11.3) | <0.001 | n/a |
| Gender (Female) | 542 (67.2%) | 760 (60.3%) | <0.01 | <0.001 | |
| Glaucoma History | |||||
| Glaucoma Diagnosis | Unilateral | 61 (4.8%) | |||
| Bilateral | 1199 (95.2%) | ||||
| Taking Glaucoma Medications | 845 (67.1%) | ||||
| Past Glaucoma Surgery | 456 (36.2%) | ||||
Clinical characteristics of glaucoma cases are presented in Table 1. Glaucoma was present in both eyes, with 95.2% of POAG cases having bilateral disease. A total of 67.1% of POAG cases reported taking ocular glaucoma medications including α2 adrenergic agonists, carbonic anhydrase inhibitors, beta blockers, prostaglandin analogues, or combinations of these medications. Over a third of POAG cases (36.2%) had been treated with glaucoma surgery in the past; glaucoma surgery included Selective Laser Trabeculoplasty, Argon Laser Trabeculoplasty, Trabeculectomy, Trabectome, Tube, and Bleb Revision. Of those with previous glaucoma surgery, 33% were also taking glaucoma medications at the time of enrollment.
Medical and Ocular Co-morbidities
To assess risk factors for POAG in our African-American population, we evaluated medical and ocular co-morbidities of African-Americans with POAG and compared these to controls. Table 2 summarizes comparisons of the BMI and social and medical history between controls and cases. POAG cases had a lower overall BMI with mean (± standard deviation) of 29.6 (±6.7) while controls had mean BMI of 31.8 (±7.4) (p<0.01, age-adjusted). POAG cases were slightly less likely to be current smokers (12.3%) than controls (13.7%, odds ratio and 95% confidence interval 0.95 [0.71, 1.28]) before correction for age. After age adjustment, cases were actually more likely to be current smokers (1.42 [1.03, 1.97]), but the association was not significant after correcting for multiple comparisons using false discovery rate approach (p=0.07). There were no differences in history of alcohol use after age-adjustment. We evaluated for potential association of POAG with history and treatment for common co-morbid diseases of hypertension and diabetes. Hypertension was present in 81.0% of POAG cases and 75.3% of controls (p=0.18, age-adjusted). Controls were more likely to have diabetes than cases (46.0% vs. 40.1%, p<0.001, age-adjusted) and were more likely to take diabetes medication (42.5% vs. 36.5%, p< 0.01, age-adjusted).
Table 2.
Medical co-morbidities of African-Americans with POAG compared with those without disease in the Primary Open-Angle African-American Glaucoma Genetics Study cohort.
| Characteristic | n (%) | p-value | |||
|---|---|---|---|---|---|
| Control (N=807) |
Case (N=1260) |
Unadjusted | Age- Adjusted |
||
| Medical Comorbidities | |||||
| Body Mass Index | Mean (SD) | 31.8 (7.4) | 29.6 (6.7) | <0.001 | <0.01 |
| Social History | |||||
| Smoking Status | Never Smoker |
327 (48.2%) | 527 (45.3%) | 0.19 | 0.04 |
| Former Smoker |
259 (38.1%) | 493 (42.4%) | |||
| Current Smoker |
93 (13.7%) | 143 (12.3%) | |||
| History of Alcohol Use | 289 (42.0%) | 377 (32.4%) | <0.001 | 0.27 | |
| Medical History | |||||
| Hypertension | 589 (75.3%) | 1017 (81.0%) | <0.01 | 0.18 | |
| Taking Hypertension Medication | 572 (73.3%) | 994 (79.3%) | <0.01 | 0.18 | |
| Diabetes | 360 (46.0%) | 503 (40.1%) | <0.01 | <0.001 | |
| Taking Diabetes Medication | 332 (42.5%) | 458 (36.5%) | <0.01 | <0.01 | |
A comparison of the ocular comorbidities between controls and cases are shown in Table 3. 93.5% of cases and 78.1% controls reported ocular comorbidities (p<0.001, age-adjusted). Cataract was the most common ocular comorbidity, occurring in 68.7% of POAG cases and 57.8% of controls (p=0.06, age-adjusted), followed by the pseudophakia (32.9% in cases and 19.6% in controls, p=0.40, age-adjusted). Cases were more likely to suffer from legal blindness (VA 20/200 or worse) than controls (8.6% vs. 2.3, p<0.001, age-adjusted). Consistent with an increased percentage of controls with diabetes, controls also had higher rates of non-proliferative diabetic retinopathy (10.5% vs. 8.0%, p<0.02, age-adjusted). Only a small percentage of cases and controls reported age-related macular degeneration (AMD) (0.6% of cases, and 0.8% of controls). AMD was an exclusion factor, so these very infrequent participants that were diagnosed with AMD were seen by a retina specialist after being diagnosed with POAG and enrolled in this study. Those presenting with AMD upon enrollment were excluded from the study.
Table 3.
Ocular co-morbidities of African-Americans with POAG compared with those without disease in the Primary Open-Angle African-American Glaucoma Genetics Study cohort.
| Characteristic | n (%) | p-value | ||
|---|---|---|---|---|
| Control (N=807) |
Case (N=1260) |
Unadjusted | Age- adjusted |
|
| Ocular Comorbidities | ||||
| Any Ocular Comorbidities | 609 (78.1%) | 1173 (93.5%) | <0.001 | <0.001 |
| Age-Related Macular Degeneration | 6 (0.8%) | 7 (0.6%) | 0.56 | 0.15 |
| Blind (VA 20/200 or worse) | 18 (2.3%) | 108 (8.6%) | <0.001 | <0.001 |
| Cataract (Nuclear Sclerosis) | 451 (57.8%) | 862 (68.7%) | <0.001 | 0.06 |
| Pseudophakia | 158 (19.6%) | 414 (32.9%) | <0.001 | 0.4 |
| Diabetic Retinopathy | 82 (10.5%) | 101 (8.0%) | 0.06 | 0.02 |
| Ocular Medications and Surgeries | ||||
| Taking non-Glaucoma Ocular Medications | 25 (3.1%) | 15 (1.2%) | <0.01 | <0.01 |
| Past Retinal Surgery | 64 (7.9%) | 114 (9.0%) | 0.37 | 0.9 |
Socioeconomic Characteristics
We characterized the socioeconomic status (SES) of our study population by zip code, utilizing 2010 U.S. Census data and the 2008-2012 American Community Survey 5-year estimates, and compared SES estimates between POAG cases and controls. Figure 2A is a heat map summarizing the number of participants from each Philadelphia zip code enrolled in the POAAGG study. The majority of the study participants live in West and Southwest Philadelphia. The five zip codes highlighted in the heat map have been identified as areas with high risk, low SES populations, where more than 30% of the residents live below the federal poverty level (FPL). These areas account for 35% of all readmissions to UPenn affiliated hospitals.27 A total of 59% of our study population, including 62% of cases and 55% of controls (p<0.01), live in this low-income, general health at-risk region.
Figure 2.
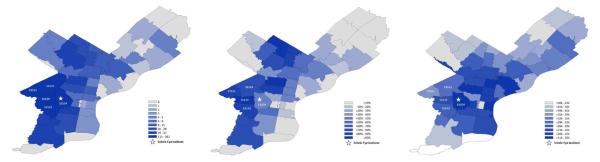
(A) Heat map summarizing the number of participants from each Philadelphia zip code enrolled in the Primary Open-Angle African-American Glaucoma Genetics Study cohort. (B) Heat map summarizing the percentage of households that are African-American within each Philadelphia zip code. (C) Heat map summarizing the average of the median incomes of African-American households within each Philadelphia zip code.
Table 4 summarizes the socioeconomic characteristics of POAG cases and controls. Study cases were from regions in which 70% of residents are African-American, and controls were from regions in which 67% of residents are African-American (unadjusted p=0.049, multiple comparison adjusted p=0.31). Our study captures patients from regions with low-income ($32,404-33,074) and low household-value ($53,623-55,183) where 29% of the population lives below the FPL. Figure 2B shows a heat map of the percentage of households that are African-American by region, and Figure 2C shows the median family income of these households, demonstrating that most POAAGG study participants come from areas of low income, predominantly African-American communities. In these regions, the majority of African-Americans have completed high-school (81%), but only 15% completed a Bachelor’s degree and almost 1 in 5 are currently unemployed. More than half of African-American households are families (56%), with a third comprising married–couple households (35%). In single parent homes, African-American households are about 5 times more likely to be female-only versus male-only homes. POAAGG study participants are from areas where the majority of the population has never been married (53%), and about 1 in 4 are separated, widowed, or divorced (24%). Most of the population in these regions was born in the US (6.8% foreign born) and has health insurance (84%). There were no large differences in any of these variables between POAG cases and controls, indicating that cohorts were well matched for socioeconomic environments.
Table 4.
Socioeconomic characteristics of African-Americans with POAG compared with those without disease in the Primary Open-Angle African-American Glaucoma Genetics Study cohort. Socioeconomic status was estimated using the demographic information of each subject’s zip code.
| Characteristic from Zip Code | Mean (SD) | p-value | |
|---|---|---|---|
| Control | Case | ||
| Population per sq. mile | 14754 (6785) |
14714 (7236) |
0.9 |
| % African American | 67.7% (25.3%) |
70.0% (23.9%) |
0.049 |
| Median household income | 33,074 (12812) |
32,404 (11968) |
0.25 |
| Median household value | 55,183 (31476) |
53,623 (29265) |
0.28 |
| % Living below poverty level | 29.0% (10.7%) |
29.0% (10.5%) |
0.91 |
| % At least high school graduate | 81.2% (6.7%) |
81.1% (6.6%) |
0.91 |
| % At least some college | 44.1% (11.5%) |
44.4% (11.1%) |
0.65 |
| % Bachelor’s degree or higher | 15.0% (8.9%) |
14.7% (8.2%) |
0.47 |
| % Unemployment | 18.5% (5.4%) |
18.1% (5.2%) |
0.13 |
| % Households that are: | |||
| ............................................family households |
56.8% (9.6%) |
56.3% (8.3%) |
0.31 |
| .................................married-couple households |
35.3% (12.0%) |
35.1% (11.5%) |
0.71 |
| ......................................................male- only |
11.3% (3.1%) |
11.6% (2.9%) |
0.07 |
| ....................................................female- only |
53.4% (11.1%) |
53.3% (10.6%) |
0.92 |
| .........nonfamily households, householder lives alone |
90.3% (4.4%) |
90.3% (4.7%) |
0.77 |
| % Population that is/was: | |||
| .................................................never married |
53.5% (7.1%) |
53.2% (7.3%) |
0.38 |
| ..............................married (excluding separated) |
22.9% (7.9%) |
22.8% (8.1%) |
0.86 |
| ........................... separated, widowed, or divorced |
23.6% (4.0%) |
24.0% (3.9%) |
0.049 |
| % Population born outside of the US | 6.9% (5.0%) |
6.8% (4.8%) |
0.62 |
| % with health insurance | 84.7% (3.7%) |
84.4% (3.3%) |
0.02 |
Discussion
POAAGG is the largest proposed study of African-Americans with POAG to date. Our goal is to better understand the genetic and environmental factors affecting onset and progression of POAG within this heavily affected population. We have collected extensive information on sociodemographic factors and health-related behaviors for consideration alongside future genotype information. Gene-environmental interactions should allow us to construct a risk model for POAG in this population.
Comparability of the POAAGG Study
POAAGG is the first large study of a well-characterized, deeply endophenotyped African-American patient population. Currently, there are two large GWAS investigating POAG: the Glaucoma Genes and Environment Study (GLAUGEN)28,29 and the NEI Glaucoma Human genetics collaBORation (NEIGHBOR).30 Both studies excluded patients of African descent and instead targeted European-derived or Hispanic whites.30 There are very few genetic studies of POAG within populations of African ancestry, and those being conducted are limited by smaller study cohorts.31-33 One study examined multiple loci previously linked with Caucasian POAG at the genome-wide level including CDKN2B-AS1, CAV1/CAV2, TMCO1, SIX1/SIX6, and chromosome 8q22 intergenic region in populations of Ghanaian ancestry, but failed to identify any significant association.31 An analysis of an Afro-Caribbean population of Barbados was able to confirm one susceptibility variant within CDKN2B, but could not confirm association with other previously identified POAG risk loci.32 These findings suggest that the effect of susceptibility alleles identified in Caucasian POAG cohorts may have smaller effects or no effects in African-American populations. POAG genetic architecture is likely fundamentally different in Caucasians, necessitating the need for a large-scale GWAS, whole genome sequencing, and deep endophenotyping in the more seriously affected African-American population.
Special Considerations of the POAAGG Study
Glaucoma is a heterogeneous disease with many subtypes; therefore, a rigorous definition of POAG was essential for the development of study cohorts. Standard eye examination procedures were used in patient evaluation to reduce heterogeneity in case and control definition. Cases were graded using a staging system modified from LALES, the largest minority POAG cohort study to date.34 For additional phenotypic rigor, we required glaucoma cases to demonstrate the presence of an open-angle with not only a characteristic glaucomatous visual field abnormality, but also evidence of compatible glaucomatous optic disc damage. Comprehensive in-office ocular evaluation, as well as standardized testing were performed, interpreted, and harmonized by fellowship-trained glaucoma specialists to ensure accuracy of POAAGG study cohorts. Rigorous endophenotyping at the time of enrollment will allow subsequent genetic analyses to dissect these cases and controls into precisely defined subgroups.
One of the unique challenges encountered by the POAAGG study was the recruitment of African-Americans. Initially, some patients were quick to decline participation. Apart from time constraints, this was largely due to either being unfamiliar with what research involves or from being uncomfortable with the blood draw. To address this, the POAAGG study used focus groups to determine best practices for recruitment and interview methods and to develop culturally sensitive interventions. Successful community integration was accomplished through outreach at volunteer glaucoma screening centers throughout West Philadelphia. The involvement of local community leaders in African-American churches, in African-American journalism, and within the local government increased awareness of the project goals and was central to community outreach. Strong doctor-patient relationships between glaucoma specialists and study subjects were the most influential factors in encouraging enrollment. POAAGG additionally provided transportation to the eye institute in some cases and meal cards to all enrollees in order to meet the needs of this particular population. Successfully addressing community concerns through these interventions led to the recruitment of over 2,000 African-American participants eligible for the POAAGG study prior to the request for NIH funding.
Medical and Ocular Co-morbidities and POAG risk in POAAGG
POAG is a multifactorial neurodegenerative disease of unknown pathophysiology. A long list of ocular and systemic factors has been evaluated as potential contributors. The relationship between POAG and lifestyle choices, cardiovascular risk, and other systemic features remains inconclusive.35 In African descent participants of the Barbados Eye Study, higher BMI was linked to lower POAG risk,36 which is inconsistent with our data, where POAG cases have a significantly lower BMI. We did not observe an association between POAG and alcohol use, hypertension, or systemic antihypertensive medications. These results are consistent with other findings in populations of African origin, including the 9-year follow up of the Barbados Eye Study.11 POAAGG found a significantly higher rate of diabetes, systemic diabetic mediation use, and non-proliferative diabetic retinopathy within controls, which likely reflects the patient population readily available for recruitment in the UPenn Ophthalmology Department. All subjects with severe proliferative diabetic retinopathy were excluded from this study, which could bias these results. The decision to exclude severe proliferative diabetic retinopathy was to maintain integrity of glaucomatous field changes. Many of our patients have advanced proliferative disease with nonglaucomatous field changes. We identified a significantly higher rate of blindness37 in our POAG population, highlighting POAG as a leading cause of irreversible vision loss in African-Americans. The likelihood and extent to which these factors influence the risk of POAG within African-Americans remains to be determined and is currently under study, as enrollment continues and power to detect differences increases.
The Socio-economic Environment of African-American participants in the POAAGG Study
Socioeconomic status (SES) may be a predictor of overall heath and a determinant of variation in disease distribution within populations.38 POAAGG study participants were ascertained from highly vulnerable populations within regions of West and Southwest Philadelphia. High rates of poverty and unemployment, as well as low levels of educational attainment beyond the high school level, characterize these areas. Prompted by the Patient Protection and Affordable Care Act’s requirements that hold health systems accountable for patient outcomes, a recent query of UPenn medical records identified five zip codes where 30% of residents live below the federal poverty level and account for over one-third of all hospital readmissions for targeted community health interventions.27 These areas of low SES are characterized by lower access to primary care39,40 and elevated risk of adverse all-cause readmission and death after hospital discharge.41-44 Reasons for readmission included exacerbation of chronic diseases stemming in part from lack of transportation to primary care appointments, inadequate housing, lack of availability of proper food, lack of insurance, as well as high medication costs, substance abuse, and depression or other psychosocial barriers to care.27
We found that patients from these regions represent the highest percentage of participants in the POAAGG study. Although geographic proximity to SEI contributed to the high enrollment in these areas, it does not fully explain this finding. Patients in these regions tend to have inconsistent follow-up with primary care physicians and therefore account for 35% of readmissions to UPenn affiliated hospitals.27 Thus, while patients generally do not take advantage of their geographic proximity to UPenn for other appointments, they do visit their ophthalmologist for eye exams and they do give blood to participate in genetic eye research. This suggests a unique opportunity for eye clinics to not only screen for, diagnose, and treat ophthalmic diseases like POAG, but also to capture and diagnose general medical conditions such as diabetes, atherosclerosis, hypertension, and other diseases, which have characteristic and distinctive ocular manifestations. Ophthalmology does serve as a point of access for total body health care within this underserved population, and SEI ophthalmologists reinforce compliance for other medical conditions and refer for proper care. An outfitted ophthalmology mobile van now facilitates both more complete ophthalmologic examinations and medical examinations provided directly to patients within these high-risk areas of Philadelphia. This van travels into communities at risk, both to increase POAAGG recruitment and to meet the unmet health needs of this population. It is fully outfitted with a lane and all the diagnostic devices required for this study. Collaborations with other UPenn Medicine physicians are developing and this will allow for broader general health interventions.
Study Limitations
A major limitation of the POAAGG study is the reliance on self-reporting of some study variables, which can be subject to recall bias. In other large epidemiological studies, self-reporting has been shown to be accurate among various ethnic groups45,46 and to correlate well with medical records47 for a number of co-morbidities,45 health care utilization rates,48 and alcohol use.49 To address this limitation, certain key variables, such as glaucoma characteristics, ocular disease history, and ocular medications/surgeries, were validated during the in clinic ophthalmology examination. History of other systemic diseases and systemic medications, as well as alcohol and tobacco use, was not only obtained from patient questionnaires, but also cross-validated in electronic medical records maintained by UPenn.
An additional limitation is that controls were recruited during eye appointments, and therefore may be more likely to have other (non-POAG) ocular diseases. This could potentially account for controls’ higher incidence of diabetes. There is also a smaller number of total controls (n=807) than cases (n=1260) at the present time. Future enrollment will include specimens collected from the Penn BioBank who will be re-contacted and brought into UPenn for glaucoma phenotyping. The number of controls, while small, is a result of only recent funding of POAAGG from the National Eye Institute on March 2, 2014. With funding, enrollment will increase.
A potential limitation of this study was the use of census data and zip codes to provide estimation of socioeconomic factors of POAAGG patients and controls. However, a secondary goal of this study was to investigate capture rates by zip code, rather than examine individual-level socioeconomic variables, which will be the subject of a future manuscript. We were specifically interested in zip code data, after learning of the high rates of hospital readmissions in regions where the majority of our POAAGG subjects reside. 27 Our finding that ophthalmologists can capture patients that are often unresponsive to follow-up in other UPHS Departments is of great interest and has the potential to provide better capture rates and care for these generally vulnerable patients. However, since the analysis was based on zip code data rather than individual data, caution must be used when forming conclusions regarding the causal relationship between socioeconomic status and POAG.
Conclusion
To date, POAAGG is the largest genetic study of POAG in an African-American population. Cultural tailoring of recruitment procedures, strong doctor-patient relationships, and sensitivity to the socioeconomic needs of our neighborhood population has resulted in a high recruitment rate. The majority of the POAAGG population was recruited from five zip codes with low average income and a high population of African-Americans. A well-defined and very comprehensive ophthalmic evaluation, complete with extensive adjunctive testing performed and interpreted by glaucoma specialists, provides a deeply detailed evaluation of glaucomatous disease. Current treatments for POAG aim to slow disease progression, but cannot reverse vision loss associated with late detection. By studying this high risk and severely affected population, we hope to identify potential sight-saving clinical, genetic, and public health interventions targeted earlier and more effectively to these vulnerable individuals. An upcoming GWAS and whole genome sequencing will enable us to functionally characterize associated genes and variants, better understand the underlying pathology of POAG, and develop better screening and therapeutic approaches for glaucoma in African-Americans.
Acknowledgments
Jennifer Jackson Marcucci and Gideon Whitehead
Financial support: This work was supported by the National Eye Institute, Bethesda, Maryland (grant #1RO1EY023557-01) and the Department of Ophthalmology at the Perelman School of Medicine, University of Pennsylvania, Philadelphia, PA. Funds also come from the F.M. Kirby Foundation, Research to Prevent Blindness, The Paul and Evanina Bell Mackall Foundation Trust, and the National Eye Institute, National Institutes of Health, Department of Health and Human Services, under eyeGENETM and contract Nos. HHSN260220700001C and HHSN263201200001C. The sponsor or funding organization had no role in the design or conduct of this research.
Footnotes
Publisher's Disclaimer: This is a PDF file of an unedited manuscript that has been accepted for publication. As a service to our customers we are providing this early version of the manuscript. The manuscript will undergo copyediting, typesetting, and review of the resulting proof before it is published in its final citable form. Please note that during the production process errors may be discovered which could affect the content, and all legal disclaimers that apply to the journal pertain.
Conflict of interest: No conflicting relationship exists for any author.
Address for reprints: Scheie Eye Institute, 51 N. 39th Street, Philadelphia, PA 19104, USA.
References
- 1.Quigley HA, Broman AT. The number of people with glaucoma worldwide in 2010 and 2020. Br J Ophthalmol. 2006;90:262–7. doi: 10.1136/bjo.2005.081224. [DOI] [PMC free article] [PubMed] [Google Scholar]
- 2.Weinreb RN, Khaw PT. Primary open-angle glaucoma. Lancet. 2004;363:1711–20. doi: 10.1016/S0140-6736(04)16257-0. [DOI] [PubMed] [Google Scholar]
- 3.Allingham RR, Liu Y, Rhee DJ. The genetics of primary open-angle glaucoma: a review. Exp Eye Res. 2009;88:837–44. doi: 10.1016/j.exer.2008.11.003. [DOI] [PMC free article] [PubMed] [Google Scholar]
- 4.Wolfs RC, Klaver CC, Ramrattan RS, et al. Genetic risk of primary open-angle glaucoma. Population-based familial aggregation study. Arch Ophthalmol. 1998;116:1640–5. doi: 10.1001/archopht.116.12.1640. [DOI] [PubMed] [Google Scholar]
- 5.Teikari JM. Genetic factors in open-angle (simple and capsular) glaucoma. A population-based twin study. Acta Ophthalmol (Copenh) 1987;65:715–20. doi: 10.1111/j.1755-3768.1987.tb07069.x. [DOI] [PubMed] [Google Scholar]
- 6.Tielsch JM, Sommer A, Katz J, et al. Racial variations in the prevalence of primary open-angle glaucoma. The Baltimore Eye Survey. JAMA. 1991;266:369–74. [PubMed] [Google Scholar]
- 7.Leske MC. The epidemiology of open-angle glaucoma: a review. Am J Epidemiol. 1983;118:166–91. doi: 10.1093/oxfordjournals.aje.a113626. [DOI] [PubMed] [Google Scholar]
- 8.Tielsch JM, Katz J, Sommer A, et al. Family history and risk of primary open angle glaucoma. The Baltimore Eye Survey. Arch Ophthalmol. 1994;112:69–73. doi: 10.1001/archopht.1994.01090130079022. [DOI] [PubMed] [Google Scholar]
- 9.Budenz D, Barton K, Whiteside-de-Vos J, et al. Prevalence of Glaucoma in an Urban West African Population: The TEMA Eye Study. JAMA Ophthalmology. 2013;131:651–8. doi: 10.1001/jamaophthalmol.2013.1686. [DOI] [PMC free article] [PubMed] [Google Scholar]
- 10.Agbeja-Baiyeroju AM, Bekibele CO, Bamgboye EA, et al. The Ibadan glaucoma study. Afr J Med Med Sci. 2003;32:371–6. [PubMed] [Google Scholar]
- 11.Leske MC, Wu SY, Hennis A, et al. Risk factors for incident open-angle glaucoma: the Barbados Eye Studies. Ophthalmology. 2008;115:85–93. doi: 10.1016/j.ophtha.2007.03.017. [DOI] [PubMed] [Google Scholar]
- 12.Kaimbo DK, Buntinx F, Missotten L. Risk factors for open-angle glaucoma: a case-control study. J Clin Epidemiol. 2001;54:166–71. doi: 10.1016/s0895-4356(00)00291-2. [DOI] [PubMed] [Google Scholar]
- 13.Charliat G, Jolly D, Blanchard F. Genetic risk factor in primary open-angle glaucoma: a case-control study. Ophthalmic Epidemiol. 1994;1:131–8. doi: 10.3109/09286589409047221. [DOI] [PubMed] [Google Scholar]
- 14.Burdon KP. Genome-wide association studies in the hunt for genes causing primary open-angle glaucoma: a review. Clin Experiment Ophthalmol. 2012;40:358–63. doi: 10.1111/j.1442-9071.2011.02744.x. [DOI] [PubMed] [Google Scholar]
- 15.Gemenetzi M, Yang Y, Lotery AJ. Current concepts on primary open-angle glaucoma genetics: a contribution to disease pathophysiology and future treatment. Eye (Lond) 2012;26:355–69. doi: 10.1038/eye.2011.309. [DOI] [PMC free article] [PubMed] [Google Scholar]
- 16.Harris PA, Taylor R, Thielke R, et al. Research electronic data capture (REDCap)--a metadata-driven methodology and workflow process for providing translational research informatics support. J Biomed Inform. 2009;42:377–81. doi: 10.1016/j.jbi.2008.08.010. [DOI] [PMC free article] [PubMed] [Google Scholar]
- 17.Mesenbourg T, Potok N, Vitrano F, et al. 2010 Census Summary File 3. US Census Bureau; Washington DC: 2011. [Google Scholar]
- 18.The 2008-2012 American Community Survey 5-Year Estimates. US Census Bureau; 2013. [Google Scholar]
- 19.Poverty thresholds. US Census Bureau; 2010. [Google Scholar]
- 20.Benjamini Y, Hochberg Y. Controlling the false discovery rate: a practical and powerful approach to multiple testing. Journal of the Royal Statistical Society, Series B. 1995;57:289–300. [Google Scholar]
- 21.Benjamini Y. Discovering the false discovery rate. Journal of the Royal Statistical Society: Series B. 2010;72:405–16. [Google Scholar]
- 22.Lohmueller K, Pearce C, Pike M, et al. Meta-analysis of genetic association studies supports a contribution of common variants to susceptibility to common disease. Nature genetics. 2003;33:177–82. doi: 10.1038/ng1071. [DOI] [PubMed] [Google Scholar]
- 23.Hirschhorn J, Lohmueller K, Byrne E, Hirschhorn K. A comprehensive review of genetic association studies. Genet Med. 2002;4:45–61. doi: 10.1097/00125817-200203000-00002. [DOI] [PubMed] [Google Scholar]
- 24.Ioannidis J, Ntzani E, Trikalinos T, Contopoulos-Ioannidis D. Replication validity of genetic association studies. Nature genetics. 2001;29:306–9. doi: 10.1038/ng749. [DOI] [PubMed] [Google Scholar]
- 25.Wiggs JL, Hauser MA, Abdrabou W, et al. The NEIGHBOR consortium primary open-angle glaucoma genome-wide association study: rationale, study design, and clinical variables. Journal of glaucoma. 2013;22:517–25. doi: 10.1097/IJG.0b013e31824d4fd8. [DOI] [PMC free article] [PubMed] [Google Scholar]
- 26.Kaimbo D, Missotten L, Kaimbo W. Risk factors for open-angle glaucoma in 260 black subjects in congo. Bull Soc Belge Ophtalmol. 1997;267:29–34. [PubMed] [Google Scholar]
- 27.Kangovi S, Mitra N, Grande D, et al. Patient-centered community health worker intervention to improve posthospital outcomes: a randomized clinical trial. JAMA Intern Med. 2014;174:535–43. doi: 10.1001/jamainternmed.2013.14327. [DOI] [PubMed] [Google Scholar]
- 28.Wiggs JL, Kang JH, Yaspan BL, et al. Common variants near CAV1 and CAV2 are associated with primary open-angle glaucoma in Caucasians from the USA. Hum Mol Genet. 2011;20:4707–13. doi: 10.1093/hmg/ddr382. [DOI] [PMC free article] [PubMed] [Google Scholar]
- 29.Cornelis MC, Agrawal A, Cole JW, et al. The Gene, Environment Association Studies consortium (GENEVA): maximizing the knowledge obtained from GWAS by collaboration across studies of multiple conditions. Genet Epidemiol. 2010;34:364–72. doi: 10.1002/gepi.20492. [DOI] [PMC free article] [PubMed] [Google Scholar]
- 30.Wiggs JL, Hauser MA, Abdrabou W, et al. The NEIGHBOR consortium primary open-angle glaucoma genome-wide association study: rationale, study design, and clinical variables. J Glaucoma. 2013;22:517–25. doi: 10.1097/IJG.0b013e31824d4fd8. [DOI] [PMC free article] [PubMed] [Google Scholar]
- 31.Liu Y, Hauser MA, Akafo SK, et al. Investigation of known genetic risk factors for primary open angle glaucoma in two populations of African ancestry. Invest Ophthalmol Vis Sci. 2013;54:6248–54. doi: 10.1167/iovs.13-12779. [DOI] [PMC free article] [PubMed] [Google Scholar]
- 32.Cao D, Jiao X, Liu X, et al. CDKN2B polymorphism is associated with primary open-angle glaucoma (POAG) in the Afro-Caribbean population of Barbados, West Indies. PLoS One. 2012;7:e39278. doi: 10.1371/journal.pone.0039278. [DOI] [PMC free article] [PubMed] [Google Scholar]
- 33.Whigham BT, Williams SE, Liu Y, et al. Myocilin mutations in black South Africans with POAG. Mol Vis. 2011;17:1064–9. [PMC free article] [PubMed] [Google Scholar]
- 34.Varma R, Paz SH, Azen SP, et al. The Los Angeles Latino Eye Study: design, methods, and baseline data. Ophthalmology. 2004;111:1121–31. doi: 10.1016/j.ophtha.2004.02.001. [DOI] [PubMed] [Google Scholar]
- 35.Janssen SF, Gorgels TG, Ramdas WD, et al. The vast complexity of primary open angle glaucoma: disease genes, risks, molecular mechanisms and pathobiology. Prog Retin Eye Res. 2013;37:31–67. doi: 10.1016/j.preteyeres.2013.09.001. [DOI] [PubMed] [Google Scholar]
- 36.Leske MC, Connell AM, Wu SY, et al. Risk factors for open-angle glaucoma. The Barbados Eye Study. Arch Ophthalmol. 1995;113:918–24. doi: 10.1001/archopht.1995.01100070092031. [DOI] [PubMed] [Google Scholar]
- 37.Rotchford AP, Kirwan JF, Muller MA, et al. Temba glaucoma study: a population-based cross-sectional survey in urban South Africa. Ophthalmology. 2003;110:376–82. doi: 10.1016/S0161-6420(02)01568-3. [DOI] [PubMed] [Google Scholar]
- 38.Williams D, Collins C. US Socioeconomic and Racial Differences in Health: Patterns and Explanations. Annu Rev Sociol. 1995;21:349–86. [Google Scholar]
- 39.Misky GJ, Wald HL, Coleman EA. Post-hospitalization transitions: Examining the effects of timing of primary care provider follow-up. J Hosp Med. 2010;5:392–7. doi: 10.1002/jhm.666. [DOI] [PubMed] [Google Scholar]
- 40.Asplin BR, Rhodes KV, Levy H, et al. Insurance status and access to urgent ambulatory care follow-up appointments. JAMA. 2005;294:1248–54. doi: 10.1001/jama.294.10.1248. [DOI] [PubMed] [Google Scholar]
- 41.Baker DW, Gazmararian JA, Williams MV, et al. Functional health literacy and the risk of hospital admission among Medicare managed care enrollees. Am J Public Health. 2002;92:1278–83. doi: 10.2105/ajph.92.8.1278. [DOI] [PMC free article] [PubMed] [Google Scholar]
- 42.Elixhauser A, Au DH, Podulka J. Readmissions for Chronic Obstructive Pulmonary Disease, 2008. Agency for Healthcare Research and Quality; Rockville, MD: Sep, 2011. HCUP Statistical Brief #121. [PubMed] [Google Scholar]
- 43.Rodriguez-Artalejo F, Guallar-Castillon P, Herrera MC, et al. Social network as a predictor of hospital readmission and mortality among older patients with heart failure. J Card Fail. 2006;12:621–7. doi: 10.1016/j.cardfail.2006.06.471. [DOI] [PubMed] [Google Scholar]
- 44.Foraker RE, Rose KM, Suchindran CM, et al. Socioeconomic status, Medicaid coverage, clinical comorbidity, and rehospitalization or death after an incident heart failure hospitalization: Atherosclerosis Risk in Communities cohort (1987 to 2004) Circ Heart Fail. 2011;4:308–16. doi: 10.1161/CIRCHEARTFAILURE.110.959031. [DOI] [PMC free article] [PubMed] [Google Scholar]
- 45.Kehoe R, Wu SY, Leske MC, Chylack LT., Jr. Comparing self-reported and physician-reported medical history. Am J Epidemiol. 1994;139:813–8. doi: 10.1093/oxfordjournals.aje.a117078. [DOI] [PubMed] [Google Scholar]
- 46.Heliovaara M, Aromaa A, Klaukka T, et al. Reliability and validity of interview data on chronic diseases. The Mini-Finland Health Survey. J Clin Epidemiol. 1993;46:181–91. doi: 10.1016/0895-4356(93)90056-7. [DOI] [PubMed] [Google Scholar]
- 47.Reijneveld SA, Stronks K. The validity of self-reported use of health care across socioeconomic strata: a comparison of survey and registration data. Int J Epidemiol. 2001;30:1407–14. doi: 10.1093/ije/30.6.1407. [DOI] [PubMed] [Google Scholar]
- 48.Ritter PL, Stewart AL, Kaymaz H, et al. Self-reports of health care utilization compared to provider records. J Clin Epidemiol. 2001;54:136–41. doi: 10.1016/s0895-4356(00)00261-4. [DOI] [PubMed] [Google Scholar]
- 49.Lee DJ, Markides KS, Ray LA. Epidemiology of self-reported past heavy drinking in Hispanic adults. Ethn Health. 1997;2:77–88. doi: 10.1080/13557858.1997.9961817. [DOI] [PubMed] [Google Scholar]