

Abstract
A substantial proportion of colorectal cancers (CRCs) are interval CRCs (I-CRCs; i.e., CRCs diagnosed soon after a colonoscopy). Chromosomal instability (CIN) is defined as an increase in the rate of which whole chromosomes/large chromosomal fragments are gained or lost and is observed in 85% of non-hereditary CRCs. The contribution of CIN to the etiology of I-CRCs remains unknown. We established a fluorescence in situ hybridization (FISH) approach to characterize CIN by enumerating specific chromosomes and determined the prevalence of numerical CIN in a population-based cohort of I-CRCs and control (sporadic) CRCs. Using the population-based Manitoba Health administrative databases and Manitoba Cancer Registry, we identified an age, sex, and colonic site of CRC matched cohort of I-CRCs and controls and retrieved their archived paraffin-embedded tumor samples. FISH chromosome enumeration probes specifically recognizing the pericentric regions of chromosomes 8, 11, and 17 were first used on cell lines and then CRC tissue microarrays to detect aneusomy, which was then used to calculate a CIN score (CS). The 15th percentile CS for control CRC was used to define CIN phenotype. Mean CSs were similar in the control CRCs and I-CRCs; 82% of I-CRCs exhibited a CIN phenotype, which was similar to that in the control CRCs. This study suggests that CIN is the most prevalent contributor to genomic instability in I-CRCs. Further studies should evaluate CIN and microsatellite instability (MSI) in the same cohort of I-CRCs to corroborate our findings and to further assess concomitant contribution of CIN and MSI to I-CRCs.
Abbreviations: CRC, colorectal cancer; I-CRC, interval CRC; MSI, microsatellite instability; CIMP, CpG island methylator phenotype; CIN, chromosomal instability; FISH, fluorescence in situ hybridization; TMA, tissue microarray; CEP, chromosome enumeration probe; CS, CIN score; CS8, CIN score for chromosome 8 within a nucleus or sample; CS11, CIN score for chromosome 11 within a nucleus or sample; CS17, CIN score for chromosome 17 within a nucleus or sample; CSC, combined CIN score for chromosomes 8, 11, and 17 within a nucleus; , mean CS for a given condition/population
Introduction
Colorectal cancer (CRC) is the second leading cause of cancer-related deaths in North America, with more than 80% of these tumors arising randomly (i.e., without family history of affected first-degree relatives and/or predisposing hereditary syndromes), emphasizing the need for accurate screening and diagnostic strategies [1], [2], [3]. Colonoscopy is an accepted CRC screening test as it has been shown in observational studies to reduce CRC incidence and mortality by identifying CRCs at earlier stages as well as CRC precursor lesions (i.e., polyps) [2], [4]. Furthermore, even when other approaches are used as the initial CRC screening test, colonoscopy is employed to investigate the positive results and diagnose CRC, and thus, most CRCs are now diagnosed on colonoscopy. However, even with colonoscopies, there remain a proportion of CRCs, termed interval CRCs (I-CRCs), that are diagnosed within a relatively short time period after a negative colonoscopy (i.e., colonoscopy that did not detect CRC). A recent meta-analysis estimated that approximately 1 in 27 CRCs is I-CRC [5], and if extrapolated to the statistics provided by the American Cancer Society, approximately 5200 Americans will be diagnosed with an I-CRC in 2014, and nearly 2000 will succumb to the disease [6]. Whether these tumors are missed sporadic CRCs that arise due to false-negative colonoscopies [7], [8], [9], [10], [11], [12], [13] or are a distinct subtype of CRC that harbor unique biologic properties [7], [11], [14], [15], [16], [17] that result in rapidly developing tumors is currently unknown (reviewed in [18]).
Genome instability is a hallmark of virtually all tumor types and is arguably best described in CRC. In general, genome instability arises through one of three aberrant pathways: microsatellite instability (MSI), CpG island methylator phenotype (CIMP), or chromosomal instability (CIN) [1], [19], [20]. MSI arises due to defects in the DNA mismatch repair pathway [21] that result in subtle genomic alterations, while CIMP is an epigenetic phenomenon associated with DNA methylation and gene silencing [22]. CIN is defined as an increase in the rate at which whole chromosomes, or large parts thereof, are gained or lost, and thus, aneuploidy is often employed as a metric for CIN [23]. Within traditional sporadic CRC, MSI and CIN are generally accepted to be mutually exclusive pathways [23], [24], while it has been proposed that CIMP may contribute to the development of MSI and/or CIN [25].
Currently, very little is known about the aberrant etiological origins of I-CRCs. Three studies have only examined the prevalence of the MSI [15], [17] and CIMP [14], [17] pathways within two distinct patient cohorts, and CIN has yet to be evaluated. Nevertheless, these studies demonstrated that I-CRCs do exhibit distinct biology relative to their traditional sporadic CRC counterparts. In fact, these studies revealed a 3.0- and 1.5-fold increase in the prevalence of MSI and CIMP, respectively, within I-CRCs relative to sporadic CRCs. Given the general observation that MSI and CIN are mutually exclusive, these results suggest that the prevalence of CIN within I-CRCs should be reduced. However, the prevalence of CIN is currently unknown in I-CRCs, and thus, it is critical to characterize its potential contribution to the pathogenesis of these tumors.
In this study, we established and employed a fluorescence in situ hybridization (FISH)–based approach to evaluate numerical CIN within a Manitoban cohort of I-CRCs and sporadic CRCs. Aneusomy (i.e., abnormal chromosome numbers) was used as the metric for CIN, and through chromosome enumeration within patient-derived tumor samples, we identified the extent of CIN within I-CRCs to be nearly identical to that of the matched control/sporadic CRCs. More specifically, the chromosome enumeration results showed no statistically significant differences between the interval and sporadic cohorts for each subcategory (i.e., gender, age, tumor location, and so on). Our data show that CIN is frequently observed in I-CRCs and further suggest that it likely contributes to the development of these tumors. Finally, due to the similar CIN profiles observed in both I-CRCs and sporadic CRCs, our findings suggest that missed sporadic CRCs may be a predominant factor in the development of I-CRCs.
Materials and Methods
Ethics Statement
This study, including the collection and use of archived clinical CRC tissue samples, was approved by the University of Manitoba Research Ethics Board and Pathology Access Committee for Tissue and Manitoba’s Health Information Privacy Committee.
Cell Culture
HeLa cells were purchased from American Type Culture Collection (Manassas, VA) and are a hypotetraploid cervical adenocarcinoma cell line with a modal number of 82 chromosomes, while hTERT cells are a diploid, immortalized fibroblast cell line with a modal number of 46 chromosomes [26] that were generously provided by Dr C. P. Case (Bristol University, Bristol, United Kingdom). Cells were grown in Dulbecco's modified Eagle's medium (HyClone) supplemented with 10% FBS at 37°C in a humidified incubator with 5% CO2.
Patient Identification
Manitoba Health is the publicly funded health insurance agency that provides health care coverage to all Manitoba residents. Manitoba Health maintains a number of electronic databases, including hospital discharge and physician claims, for monitoring and accounting purposes [27]. Every resident of Manitoba is assigned a unique personal health identification number, which can be used to link patient records longitudinally. For the current study, CRCs occurring in Winnipeg residents (the largest provincial city with two thirds of the Manitoba residents) were identified from the population-based Manitoba Cancer Registry (which tracks all cancers diagnosed in the province) and linked to patient colonoscopy records through Manitoba Health databases to identify I-CRCs and control CRCs. Medical records of colonoscopies were reviewed to determine the differences in colonoscopies in the two groups.
CRC Cohort
For the purpose of this study, I-CRCs were defined as CRCs diagnosed between 6 and 36 months following a colonoscopy, while CRCs detected on initial colonoscopy (on the date of the colonoscopy or within a month thereafter) were classified as sporadic and were included as controls. Sporadic CRCs were matched 2:1 to I-CRC by age (± 5 years), gender, and tumor location in the colon (i.e., right vs left). CRCs occurring in and proximal to the splenic flexure were considered right-sided CRC and those more distally left-sided CRC. Only CRCs diagnosed between 1 January 2007 and 30 March 2010 were included. Exclusion criteria included patients with prior CRC or inflammatory bowel disease, as well as patients diagnosed with CRC before the age of 50 years, due to the higher probability of a hereditary predisposition for CRC.
Archived clinical formalin-fixed, paraffin-embedded tumor tissue blocks were supplied by the Department of Pathology serving all six hospitals in the city of Winnipeg. Samples were provided in an anonymized, double-blinded fashion and the I-CRC status was only revealed once all samples had been analyzed. A total of 141 samples including 46 I-CRCs and 95 sporadic (control) CRCs was obtained and evaluated for CIN.
CRC Tissue Microarray
CRC samples were provided as archived clinical formalin-fixed, paraffin-embedded tissue blocks with corresponding hematoxylin and eosin–stained slides. Slides were examined by a pathologist (R.H.W., University of Manitoba), and tumor regions distal to tumor borders and necrotic zones were identified and used to generate six tissue microarrays (TMAs). The TMAs were generated by the Manitoba Tumor Bank and housed 21 to 32 unique patient tumor samples cored (0.6 mm) in duplicate, with mouse tissues included for orientation purposes. TMAs were sectioned at 5 μm and subjected to FISH as detailed below.
Fluorescence In Situ Hybridization
FISH chromosome enumeration probes (CEPs) specifically recognizing the pericentric regions of chromosomes 8 (CEP8; SpectrumOrange), 11 (CEP11; SpectrumGreen), and 17 (CEP17; SpectrumAqua) were purchased from Vysis (Abbott Molecular Inc., Mississauga, Ontario, Canada). Chromosomes 8, 11, and 17 were specifically selected for evaluation purposes, as genes encoded within these chromosomes have been found altered in CRCs and/or are thought to play a role in CRC tumorigenesis, including MYC and fibroblast growth factor receptor 1 (chromosome 8), ataxia telangiectasia mutated and MRE11 meiotic recombination 11 homolog A (chromosome 11), and tumor protein p53 (chromosome 17) [28], [29], [30], [31], [32]. Furthermore, pericentric CEPs were employed as the centromere is an essential chromosomal element that is normally required for mitotic fidelity and thus chromosome stability. FISH was performed first on cell lines according to the manufacturer (Vysis) to confirm and validate specificity. In brief, pepsin-treated samples were rinsed in phosphate-buffered saline and dehydrated in an ethanol series (70%, 90%, and 100%) and allowed to air dry. DNA was denatured by heating (70°C for 5 minutes) and transferred to 70% formamide/2 × SSC at 70°C (2 minutes) before ethanol fixation. A multiplexed CEP cocktail was prepared by combining CEP11 and CEP17 to the pre-diluted CEP8. The CEP8/11/17 cocktail was transferred to a coverslip and subsequently applied to the samples on the denatured slide. Samples were incubated in the ThermoBrite slide processing system at 77°C (10 minutes), followed by 37°C overnight. Following CEP labeling, cells were counterstained with 4’,6-diamidino-2-phenylindole (DAPI) and mounted in Vectashield anti-fade reagent (Vector Laboratories, Burlingame, CA) before manually evaluating the position, chromosome, and number of each CEP probe within mitotic spreads from both cell lines. CEP foci were manually enumerated within interphase nuclei to confirm their ability to accurately reflect the expected number of CEP signals (i.e., chromosomes).
TMAs were processed for FISH using a standard FISH protocol. Briefly, tissue sections were deparaffinized through two washes in xylene (6 minutes each) and ethanol (100%; 10 minutes each) and allowed to air dry. Samples were incubated in citric acid buffer at 80°C (1 hour), followed by pepsin treatment (0.5 mg/ml) for 45 minutes. TMAs were rinsed (twice in 2 × SSC) and dehydrated (ethanol series), before incubation with the multiplexed CEP probes as above. Excess CEPs were removed with three washes in 50% formamide/2 × SSC (46°C; 10 minutes each), followed by 2 × SSC (46°C; 10 minutes) and 2 × SSC/0.1% NP-40 (46°C; 5 minutes). Finally, samples were washed with 2 × SSC (room temperature; 5 minutes), counterstained with DAPI, mounted in Vectashield, and stored in the dark at − 20°C until imaged.
Image Acquisition and Deconvolution
For tissue culture cells, two-dimensional images were acquired using an Axioplan 2 (Zeiss) equipped with a 63 × Plan-Apochromat oil-immersion objective (numerical aperture 1.40). Images were analyzed using the Case Data Manager software from Applied Spectral Imaging (Carlsbad, CA). The identification of the individual chromosomes (i.e., karyotyping) was automated and based on the inverted DAPI staining pattern. For TMA imaging and to preserve CEP signal intensities and ensure that samples could be imaged immediately following hybridization, six mini-TMAs, harboring 19 to 32 unique patient samples were arrayed in duplicate to address reproducibility. Three-dimensional (3D) images were acquired with an AxioImager Z1 microscope (Zeiss, Toronto, Ontario, Canada) equipped with an AxioCam HR charge-coupled device camera (Zeiss) and 40 Plan-Neofluar (numerical aperture 1.30) and 63 × Plan-Apochromat (numerical aperture 1.40) lenses. Approximately four to eight nonoverlapping 3D image series were acquired from each core at 0.4-μm intervals, and images were collected using DAPI, cyan fluorescent protein (SpectrumAqua), fluorescein isothiocyanate (SpectrumGreen), and Cy3 (SpectrumOrange) filter sets. 3D data sets were processed by maximum-likelihood expectation deconvolution in AutoQuant X3 (Media Cybernetics) using a constrained iterative algorithm and a theoretical point spread function for each fluorescent channel: DAPI (461 nm), cyan fluorescent protein (476 nm), fluorescein isothiocyanate (525 nm), and Cy3 (570 nm). Each 16-bit image was imported into Imaris v7.7.1 (Bitplane) image visualization software, where CEP8/11/17 was enumerated (see CEP Evaluation section).
CEP Evaluation
3D deconvolved images were imported into Imaris where CEP8/11/17 was manually enumerated from 100 nuclei per core whenever possible. Briefly, the DAPI channel was used to generate a surface rendering (Supplementary Figure 1) to ensure that only intact (i.e., complete) nuclei were included in the analysis, and only the CEP8/11/17 foci contained within intact nuclei were evaluated. CEP8/11/17 foci were enumerated if 1) it was contained within the nuclear volume as defined by DAPI staining, 2) it was a distinct signal that did not colocalize with any of the remaining CEP channels and therefore is unlikely to be tissue autofluorescence or channel bleed-through, 3) it was spheroid in shape, and 4) it exhibited a similar signal intensity to the other CEP foci within the particular channel and image. All figures and panels were generated in Photoshop CS6.
CIN Analyses
The CIN score (CS) is a metric devised to describe both the gains and losses of CEP foci within a given patient sample. It was calculated for each individual CEP [e.g., CS for chromosomes 8, 11, or 17 within a nucleus or sample (CS8, CS11, or CS17, respectively)] and for all three CEPs combined (CSC) for each nucleus evaluated. A CEP-specific CS (e.g., CS8) is calculated for a given nucleus using the following formula: [CS8 = |eChr8 - oChr8|], where CS equals the absolute value obtained when the observed (o) number of CEP8 foci is subtracted from the expected (e) number of two CEP8 foci (expect 1 focus/chromosome × 2 copies/cell). By summing the values for a given patient sample and dividing by the number of nuclei evaluated, the CS8 for that sample is calculated. The corresponding CSC for a given nucleus is calculated by summing each of the individual CEP CS as follows: (CSC = CS8 + CS11 + CS17). Further, an overall mean CS can be calculated for each patient sample by summing the CSC for each nucleus analyzed within a patient sample and dividing by the total number of nuclei evaluated:
where n is the number of nuclei evaluated in the sample. By definition, CSC = 0 indicates that the nucleus is diploid. However, for the purpose of this study, we operationally defined the 15th percentile of the CS for the sporadic CRCs (1.68) as the minimum threshold for a CIN phenotype, based on the general observation that 15% of sporadic CRCs exhibit MSI phenotype while 85% harbor a CIN phenotype [21], [23], [33]. All data were imported to Prism (GraphPad, version 6.0a), where scatterplots and bar graphs were generated.
Statistical Analysis
Standard statistical analyses were performed and include Student’s t tests to compare ages, while Fisher tests were used to compare sex distribution and grade. Tumor, metastases, nodes status was compared using exact Mantel-Haenszel test. Median test with linearity was performed to assess if there was an increasing trend of values above the median, when assessing from proximal to distal colonic site cancers. The Spearman rank correlation test was used to assess correlation of values with age. Missing data were omitted from the analyses. We had estimated that with a sample size of 50 I-CRCs and 100 control CRCs we would have an 80% chance to detect a true difference in the mean number of chromosomes in the matched pairs of ± 1.954 with a probability of 0.05 and were limited by slightly smaller number of retrievable samples.
Results
Establishing the Specificity of the CEP FISH Probes
Before enumerating chromosomes within the TMAs, we first sought to confirm the specificity of the FISH probes and assess their ability to accurately enumerate chromosomes using well-defined, cell-based models that included both diploid (hTERT) and hypotetraploid (HeLa) cells. Accordingly, mitotic chromosome spreads were generated from hTERT cells and hybridized with CEP8/11/17. Fluorescence images were collected, and karyotypic analyses were conducted (Figure 1). Figure 1B demonstrates that each of the CEPs correctly recognized the pericentric regions from the corresponding pair of cognate chromosomes with high specificity. Having confirmed the CEP specificities in mitotic chromosome spreads, we next sought to evaluate the ability of CEP8/11/17 to enumerate chromosomes within interphase hTERT nuclei, as the CRC tumor samples are composed almost exclusively of interphase cells. To accomplish this, asynchronous cells were fixed, hybridized with CEP8/11/17, and imaged (Figure 1C). In agreement with the above findings, each probe produced two distinct foci within each interphase nucleus and thus confirmed the ability of each CEP to accurately enumerate their respective chromosomes within interphase cells.
Figure 1.
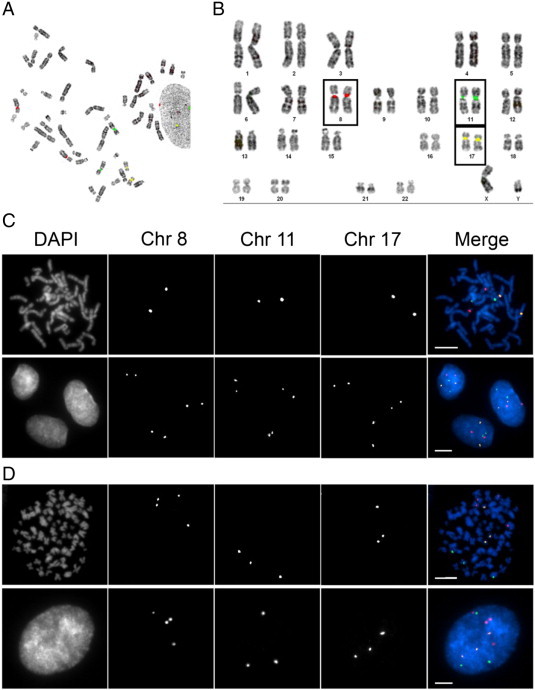
Evaluating the specificity and efficacy of CEP8/11/17. (A) A representative mitotic spread depicting the localization pattern of CEP8 (red), CEP11 (green), and CEP17 (yellow) obtained from diploid, hTERT cells. (B) Karyotypic analysis of the mitotic chromosome spread presented in A demonstrating the specificity of CEP8/11/17 for their respective chromosomes. Each CEP hybridizes with high specificity to the pericentric regions of the corresponding chromosome and presents as two copies (foci) per CEP (one focus per chromosome). (C) Representative images acquired from a mitotic chromosome spread (top) and interphase hTERT cells (bottom) hybridized with CEP8/11/17. Note that each CEP presents as two foci within each interphase nucleus and indicates the presence of two copies of the corresponding chromosome. (D) Representative images acquired from a mitotic chromosome spread (top) and interphase hypotetraploid HeLa cells (bottom) hybridized with CEP8/11/17. Note that four, three, and three copies of CEP8, CEP11, and CEP17, respectively, are observed in both the mitotic spread and interphase cells.
Intuitively, increases or decreases in chromosome numbers will be reflected by corresponding gains or losses in CEP foci, respectively. To formally test this using the CEP-based approach, similar experiments were performed but within HeLa, a hypotetraploid cell line (Figure 1D). As above, each CEP correctly hybridized to the corresponding pericentric regions of the cognate chromosomes within mitotic chromosome spreads. More importantly however, each CEP produced similar focal numbers within mitotic and interphase cells, four copies of chromosome 8 and three copies each of chromosomes 11 and 17. Thus, the above data confirm that CEP8/11/17 hybridize to the pericentric regions of the correct chromosomes with high specificity and further validate that each probe can successfully be employed to enumerate chromosomes within interphase cells.
Clinical and Physical Characteristics of the I-CRC and Sporadic CRC Samples
The cohort comprised a 2:1 ratio of sporadic (control) to I-CRC samples (95 sporadic CRCs to 46 I-CRCs). The characteristics of the matched cohort are presented in Table 1. Because of matching, the sex, age, and tumor location distributions were similar between the sporadic and I-CRC samples. In addition, the tumor grade and stage distribution were also similar in the two groups. While tumor grade was less evenly distributed, the two cohorts were well matched with 80% to 85% of each cohort grade 1 or 2. Late-stage (stage 3 and 4) sporadic tumors were more likely to express CIN phenotype than early-stage (stage 1 and 2) sporadic tumors (Table 2). There was no significant difference in the colonoscopy completion rate between the two groups. The quality of the bowel preparation was recorded in only one third of the entire cohort, with no significant differences between the two groups (data not shown). However, a larger proportion of index colonoscopies were performed by gastroenterologists for the control group than for the I-CRC group.
Table 1.
Comparison of I-CRC and Sporadic CRC Study Subjects and Tumor Characteristics
| Sporadic CRC (N⁎ = 95) |
I-CRC (N = 46) |
P Value‡ | Combined CIN (N = 116) |
CRC Cohort CIN-Negative (N = 22) |
P Value | |
|---|---|---|---|---|---|---|
| n† (%) | n (%) | n (%) | n (%) | |||
| Subject | ||||||
| Age, mean ± SD (years) | 70.1 ± 8.0 | 70.7 ± 7.9 | .69 | 69.8 ± 8.1 | 72.2 ± 7.1 | .18 |
| Sex | ||||||
| Male | 64 (67.4) | 29 (63.0) | .71 | 74 (81.3) | 17 (18.7) | .33 |
| Female | 31 (32.6) | 17 (37.0) | 42 (89.4) | 5 (10.6) | ||
| Sample | ||||||
| Location | ||||||
| Proximal | 70 (73.7) | 35 (76.1) | .84 | 82 (80.4) | 20 (19.6) | .06 |
| Distal | 25 (26.3) | 11 (23.9) | 34 (94.4) | 2 (5.6) | ||
| TNM stage | ||||||
| 0 | 0 | 1 (2.2) | .78 | 0 | 1 (100.0) | .24 |
| 1 | 11 (11.6) | 6 (13.0) | 17 (100.0) | 0 | ||
| 2 | 35 (36.8) | 15 (32.6) | 35 (72.9) | 13 (27.1) | ||
| 3 | 28 (29.5) | 15 (32.6) | 36 (85.7) | 6 (14.3) | ||
| 4 | 20 (21.1) | 9 (19.6) | 27 (93.1) | 2 (6.9) | ||
| N/D§ | 1 (1.1) | 0 | 1 (100.0) | 0 | ||
| TNM stage (clustered) | ||||||
| 1 and 2 | 46 (48.9) | 21 (46.7) | .86 | 52 (80.0) | 13 (20.0) | .23 |
| 3 and 4 | 48 (51.1) | 24 (53.3) | 63 (88.7) | 8 (11.3) | ||
| Grade | ||||||
| 1 | 8 (8.4) | 3 (6.5) | .72 | 7 (77.8) | 2 (22.2) | .23 |
| 2 | 67 (70.5) | 30 (65.2) | 85 (87.6) | 12 (12.4) | ||
| 3 | 13 (13.7) | 8 (17.4) | 13 (65.0) | 7 (35.0) | ||
| 4 | 1 (1.1) | 0 | 1 (100.0) | 0 | ||
| N/D | 6 (6.3) | 5 (10.9) | 10 (90.9) | 1 (9.1) | ||
| Grade (clustered) | ||||||
| 1 and 2 | 75 (84.3) | 33 (80.5) | .62 | 92 (86.8) | 14 (66.7) | .047 |
| 3 and 4 | 14 (15.7) | 8 (19.5) | 14 (13.2) | 7 (33.3) | ||
| Index colonoscopy¶ | ||||||
| Completed to caecum# | 54 (84) | 33 (79) | .45 | 76 (70.4) | 12 (66.7) | .78 |
| Speciality of physician performing colonoscopy | ||||||
| Gastroenterology | 34 (40) | 9 (21) | .04 | 37 (88.1) | 5 (11.9) | .60 |
| Surgery | 52 (60) | 33 (79) | 69 (83.1) | 14 (16.9) |
N = total number of samples in the cohort.
n = number of samples in sub-category.
P value < .05 is statistically significant.
N/D = not determined.
Index colonoscopy = medical records could not be retrieved for all cases. The proportions reported for index colonoscopy are based on the percentage of the reviewed cases. The number of colonoscopies performed by non-gastroenterology, non-surgical specialities was very few and those numbers are not broken down further to protect anonymity of the data.
Completed to caecum = excluding colonoscopies with obstructing lesions.
Table 2.
Results of CIN Analysis
| Total N⁎ | Sporadic CRC (n†, %) | Total N | I-CRC (n, %) | P Value‡ | |
|---|---|---|---|---|---|
| CIN-positive | 94 | 80 (85.1) | 44 | 36 (81.8) | .63 |
| Sex | |||||
| Female | 30 | 28 (93.3) | 17 | 14 (82.4) | .34 |
| Male | 64 | 52 (81.3) | 27 | 22 (81.5) | 1 |
| Age, mean ± SD | 80 | 69.9 ± 8.0 | 36 | 69.6 ± 8.2 | .87 |
| Tumor location | |||||
| Proximal colon | 69 | 57 (82.6) | 33 | 25 (75.8) | .43 |
| Distal colon | 25 | 23 (92.0) | 11 | 11 (100.0) | 1 |
| TNM stage | |||||
| 0 | 0 | 0 | 1 0 | ||
| 1 | 11 | 11 (100.0) | 6 | 6 (100.0) | 1 |
| 2 | 34 | 25 (735) | 13 | 10 (76.9) | 1 |
| 3 | 28 | 25 (89.3) | 15 | 11 (73.3) | .22 |
| 4 | 20 | 18 (90.0) | 9 | 9 (100.0) | 1 |
| N/D§ | 1 | 1 (100.0) | 0 | 0 | |
| TNM stage (clustered) | |||||
| 1 and 2 | 45 | 36 (80.0) | 19 | 16 (84.2) | .74 |
| 3 and 4 | 48 | 43 (89.6) | 24 | 20 (83.3) | .47 |
| Grade | |||||
| 1 | 7 | 5 (71.4) | 2 | 2 (100.0) | 1 |
| 2 | 67 | 59 (88.1) | 30 | 26 (86.7) | 1 |
| 3 | 13 | 9 (69.2) | 7 | 4 (57.1) | .65 |
| 4 | 1 | 1 (100.0) | 0 | 0 | |
| Unknown | 6 | 6 (100.0) | 5 | 4 (80.0) | .45 |
| Grade (clustered) | |||||
| 1 and 2 | 74 | 64 (86.5) | 32 | 28 (87.5) | 1 |
| 3 and 4 | 14 | 10 (71.4) | 7 | 4 (57.1) | .64 |
| CIN-negative | 94 | 14 (14.9) | 44 | 8 (18.2) | .63 |
| Age, mean ± SD | 14 | 71.1 ± 7.9 | 8 | 74.1 ± 5.3 | .36 |
N = total number of samples in the cohort.
n = number of samples in a subcategory.
P value < .05 is statistically significant.
N/D = not determined.
Chromosome Instability Is Frequently Observed within I-CRCs
To assess CIN within the sporadic and I-CRCs, gains and/or losses in chromosomes 8, 11, and 17 were evaluated using the CEP protocol detailed in Materials and Methods section. Briefly, samples were hybridized with CEP8/11/17, 3D images were acquired and deconvolved, and CEP foci were manually enumerated from only intact nuclei. Whenever possible, 100 nuclei per core were evaluated from each patient sample, which was cored in duplicate (i.e., 200 nuclei per tumor sample) to address reproducibility (Supplementary Table 1). Due to the mathematical negating properties of averaging gains and losses in chromosome numbers within a given sample, a CS (see Materials and Methods section) was devised, which was calculated for each individual CEP and all three CEPs combined (CSC). In essence, a CS is a metric used to describe both the gains and losses in chromosome numbers (Supplementary Figure 2) within a given tumor sample, so that comparisons can be made between samples and conditions (i.e., I-CRC and sporadic CRC). For reference purposes, CSC = 0 indicates that the nucleus is diploid (i.e., harbors two copies of each CEP), while CSC > 0 identifies increases in gains and losses of chromosome(s). In addition, an overall mean CS () can be calculated for a given sample or condition (e.g., sporadic CRC vs I-CRC, male vs female, proximal vs distal) by averaging the individual CS values for that condition.
Overall, the distributions of CS values were similar, albeit with a 1.3-fold larger range within the I-CRC samples (0.61-4.61; total range 4.0) compared to the sporadic samples (0.84-3.87; total range 3.03; Figure 2A). Furthermore, the overall values (± SD) were statistically indistinguishable (P value = 1.0) between the sporadic CRC (2.28 ± 0.59) and I-CRC (2.28 ± 0.74) samples (Supplementary Table 2). Due to the general observation that 85% of non-hereditary CRCs exhibit CIN [23], [33], we identified the 15th percentile from the CS values within the sporadic population (CS = 1.68) and set this as the minimum threshold value required to define CIN-positive tumors (85% CIN or 80/94 sporadic CRC samples). Using this threshold, 82% (36/44) of the I-CRCs were classified as CIN-positive tumors (Figure 2B and Table 2). Collectively, these data show that I-CRCs and sporadic CRCs share similar gains and losses in chromosomes 8, 11, and 17.
Figure 2.
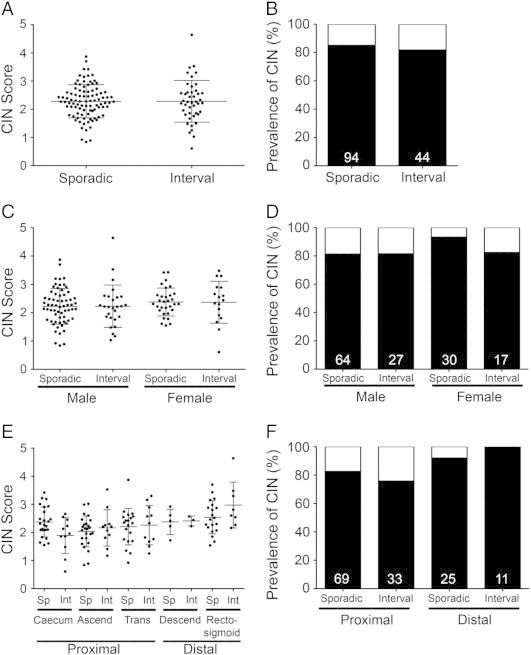
The prevalence of CIN within sporadic and I-CRCs. (A) Scatterplot depicting the distribution of the CS for each sporadic and I-CRC sample. An overall group mean ± SD is indicated by the horizontal bars for both the sporadic and interval populations. (B) Bar graph depicting the percentage of sporadic and I-CRCs displaying a CIN phenotype (black) as defined by CS ≥ 1.68 (see Materials and Methods section). Numbers at the base of the bars identify the total number of samples within that group. (C) Scatterplot depicting the distribution of CS for males and females within the sporadic and I-CRCs. An overall group mean ± SD is indicated for both the sporadic and interval populations. (D) Bar graph presenting the percentage of male and female tumors exhibiting a CIN phenotype (CS ≥ 1.68; black). Numbers in each column identify the total number of samples within that group. (E) Scatterplot showing the overall distribution of CS based on the indicated location (x-axis). An overall group mean ± SD is indicated for each location. Note that, in general, the overall distributions and group means increase from left to right (proximal to distal colon). (F) Bar graph presenting the percentage of sporadic and I-CRCs exhibiting CIN phenotypes within the proximal and distal colon.
Evaluating CIN in Sporadic and I-CRCs, Stratified by Sex, Tumor Location, and Age
Recent studies in sporadic CRCs have shown that MSI occurs more frequently within females than males. To determine if a similar distribution occurs with CIN, the CS values calculated were grouped according to sex (Figure 2C and Supplementary Table 3). Although the values were statistically insignificant for sporadic and I-CRCs within a given sex, overall they were slightly increased within females compared to males. The overall values for male sporadic and I-CRCs are 2.23 ± 0.63 and 2.23 ± 0.75, respectively (P value = .98), while for females they are 2.40 ± 0.48 and 2.37 ± 0.74, respectively (P value = .87). When evaluating the prevalence of CIN within males and females using the CS threshold value (1.68) identified above, there was an increase in the proportion of CIN-positive sporadic tumors (93%) relative to the I-CRCs (82.4%) among females (Figure 2D), while males exhibited similar frequencies in both sporadic CRCs (81%) and I-CRCs (82%). Thus, our data indicate that CIN is more prevalent within female sporadic tumors than within female I-CRCs. Surprisingly however, the current data show that the high prevalence of CIN-positive tumors is not maintained within the female interval tumors but rather is similar to those observed in male sporadic and interval tumors.
Previous studies have shown that the prevalence of CIN correlates with location and that CIN occurs less frequently within the proximal colon than the distal colon [34], [35], [36], [37]. To examine this within I-CRCs, the values from all tumors were classified into one of five locations from the proximal and distal colon (Figure 2E). With the exception of the sporadic CRCs isolated from the caecum, a general trend emerged where the overall values increased as the tumor site moved from the proximal to the most distal colonic regions (P value = .003 from median test; Supplementary Table 4), and this trend was conserved within the I-CRCs (P value = .05). In agreement with previous literature [34], [35], [36], [37], the frequency of CIN-positive sporadic tumors (Figure 2F) was greater within the distal colon (92%; n = 25) than those in the proximal colon (83%; n = 69). Interestingly, this difference was conserved within the interval tumors; however, it was even more pronounced as the frequency within the proximal colon was 76% (n = 33) and 100% (n = 11) in the distal colon. These data show that similar trends are observed for both the sporadic and I-CRCs, where CIN-positive tumors are observed more frequently within the distal colon rather than the proximal colon.
MSI presents most frequently within the proximal colon of sporadic CRCs and is more common in females and elderly patients [1], [38]. Due to the general observation that MSI and CIN are mutually exclusive [23], [24], we predicted that CIN-negative tumors (i.e., values < 1.68) would occur more frequently within the proximal colon of older patients (i.e., > 65 years). The values decreased with increasing age (P value = .04). Despite the limited sample sizes, the distribution of CIN-negative tumors within the proximal colon was preferentially associated with older age in sporadic and I-CRCs (Figure 3A). More specifically, 83.3% (10/12) of CIN-negative sporadic CRCs and 88% (7/8) of CIN-negative I-CRCs occurred within individuals > 65 years of age. Furthermore, when all proximal tumors were subclassified based on age greater or lower than 65 (Figure 3B), a decrease in the frequency of CIN-positive (or an increase in the CIN-negative) tumors was observed within the older population (> 65 years of age). Collectively, these data show that CIN-positive tumors from the proximal colon preferentially occur within younger patients (≤ 65 years), while CIN-negative tumors are more prevalent within older patients (> 65 years of age) for both sporadic and interval tumors.
Figure 3.
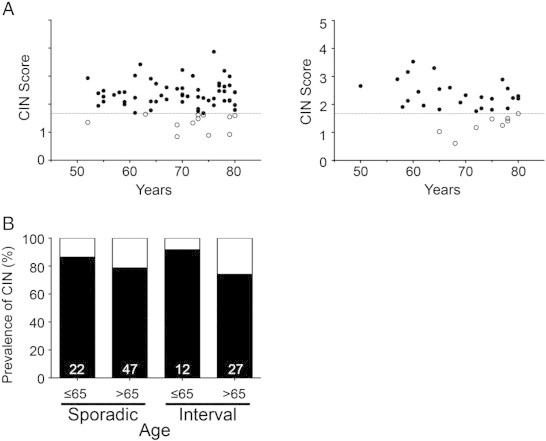
CIN-negative tumors are correlated with age, but not sex, in the proximal colon. (A) Scatterplots depicting the distribution of the CS values versus age for the proximal sporadic (left) and proximal interval (right) CRC samples. Samples with CS ≥ 1.68 are defined as CIN-positive (black), while those < 1.68 are CIN-negative (white). (B) Bar graphs depicting the prevalence of CIN (black) within sporadic and interval tumors based on age. The sample size of each group is indicated at the base of each bar.
Interval and Sporadic Tumors Exhibit Similar Gains and Losses of Chromosomes 8, 11, and 17
To determine if any of the three chromosomes evaluated were preferentially gained or lost from the sporadic or interval tumors, the chromosome enumeration data were further scrutinized. In brief, the average gain or loss of each chromosome from each tumor sample was determined, and the overall population means (± SD) were calculated for the sporadic and interval cohorts (Supplementary Table 5). As shown in Figure 4, the overall distribution and the individual CS values calculated for the gains and losses of each individual chromosome were similar between sporadic and I-CRCs. In general, chromosome 8 was preferentially gained (see Supplementary Figure 3), chromosome 17 was preferentially lost, while chromosome 11 exhibited similar losses and gains in both sporadic and I-CRCs (Supplementary Table 5).
Figure 4.
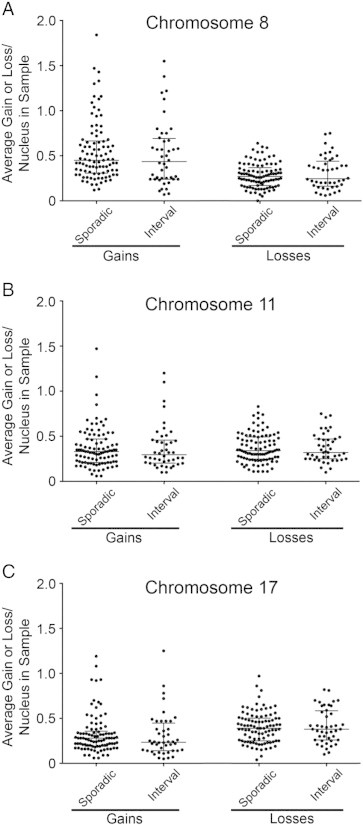
Comparing the gains and losses in chromosome numbers in I-CRC and sporadic CRC tumors. Scatterplots depicting the average gain and loss of chromosomes 8 (A), 11 (B), and 17 (C) in the I-CRC and sporadic CRC samples. The mean and SDs are indicated and are comparable between the I-CRCs and sporadic CRCs for all chromosome gains and losses.
Discussion
In this study, we established, validated, and employed a multiplexed CEP-based approach to evaluate numerical CIN within a Manitoban cohort of CRCs comprising 95 sporadic and 46 interval tumors. Using cell-based models, we confirmed the specificity of each CEP and subsequently validated their ability to accurately enumerate their respective chromosomes in mitotic and interphase populations from both diploid and hypotetraploid cells and applied this approach to evaluate CIN within sporadic and I-CRCs. To accurately assess numerical CIN, we developed a novel metric, CS, to describe the gains and losses in CEP signals in a given tumor or population. This approach was used to assess numerical CIN, and thus any sample exhibiting structural CIN, such as balanced translocations, is not expected to be identified by this approach. To our surprise, the prevalence of CIN was statistically indistinguishable between the sporadic and I-CRCs, regardless of how the data was analyzed (Figure 2). More specifically, the overall distribution and mean CS values were not statistically different (P value > .05), while they were similar within male and female sporadic and I-CRC samples, and only slightly elevated within the female population relative to the male population. Moreover, a predominant proportion of both sporadic (85%) and interval (82%) tumors exhibited CIN phenotypes. However, when the data were grouped according to sex, the frequency of CIN within female interval tumors (82%) was less than the corresponding sporadic tumors (93%) but similar to the frequencies observed for sporadic (81%) and interval (82%) tumors from males. When analyzed based on location, similar trends were observed within the sporadic and interval tumors. For example, increases in mean CS values and the proportion of CIN-positive tumors increased as the sites transitioned from the proximal to distal colon. Collectively, these data show that I-CRCs frequently exhibit gains and losses in chromosomes 8, 11, and 17 and further show that a predominant proportion (82%) harbors a CIN phenotype. Advancements in the field of molecular pathologic epidemiology can be exploited to assess the contribution of environmental factors to the development of I-CRCs compared to sporadic CRCs.
Before the current study, only two I-CRC cohorts had been studied, and only with respect to the prevalence of MSI and CIMP, CIN had yet to be investigated [14], [15], [17]. The current study was devised to address this need and facilitate the comparison of CIN within both sporadic and interval tumors. The study cohort was carefully selected to include a diverse array of I-CRCs (e.g., location, gender, and age) to ultimately provide a more complete understanding of these tumors in general. A critical component of this study was the criteria employed to define and identify the I-CRC to be evaluated. Conceptually, too long of an interval after colonoscopy could erroneously include sporadic tumors that develop through traditional pathways, while too short of an interval could inadvertently include sporadic tumors whose date of diagnosis was delayed due to delays in processing and reporting of pathology specimens [18]. Thus, our study restricted the analyses of I-CRCs to those diagnosed 6 to 36 months following a colonoscopy. We excluded CRCs diagnosed between 1 and 6 months from both groups (I-CRCs and sporadic CRCs) to avoid misclassification. Importantly, the I-CRC samples were matched to control sporadic CRC samples in a 1:2 ratio with respect to age, sex, and tumor location to avoid the potential differences in these characteristics among the CRCs from affecting the CIN analysis.
Although CIN has previously been evaluated using traditional cytogenetic approaches involving mitotic spreads, it is rarely investigated within interphase cells and has never been evaluated within I-CRCs. Accordingly, a major goal of the current study was to develop and validate a novel approach to evaluate CIN by examining the gains and losses in three chromosomes within interphase cells, which represent the predominant (> 99%) cellular population within solid tumor samples (McManus and Cisyk, personal observation). Thus, it is critical to compare the results we obtained to those from previous studies involving sporadic CRCs. Overall, the CIN results and observations we made are in agreement with those of numerous other studies. For example, our approach identified an increase in the prevalence of CIN in sporadic tumors isolated from distal colon relative to the proximal colon, which is in agreement with those of Reichmann et al. [34] and Delattre et al. [35]. Furthermore, late stage sporadic tumors within the current study exhibited an increase in CIN (Table 2) and are consistent with previous work showing that CIN correlates with advance stage disease and poor prognosis [36], [39], [40]. Thus, the in situ CEP-based approach employed on interphase cells in this study accurately detects known trends within the sporadic samples and strongly supports its use in the characterization of CIN within the I-CRCs.
Through our analysis of the Manitoba cohort of I-CRCs and sporadic CRCs, we have identified the relative prevalence of CIN within I-CRCs. Specifically, 82% of I-CRCs were identified as exhibiting a CIN phenotype, a slightly lower (although not significantly different) prevalence compared to 85% of sporadic CRCs. Within sporadic CRC, MSI and CIN are often considered to be mutually exclusive pathways, and it has been proposed that CIMP may contribute to the development of either MSI or CIN. Importantly, previous studies have shown that the MSI phenotype was about three-fold more prevalent within the I-CRCs (~ 45%) than in the corresponding sporadic tumors (~ 15%) [15], [17]. Thus, if MSI and CIN are in fact mutually exclusive, then it can be expected that the prevalence of CIN would decrease from ~ 85% to ~ 55% within I-CRCs. However, we failed to detect a significant decrease within the I-CRCs, as ~ 82% of tumors still exhibited a CIN phenotype. A possible explanation for high prevalence of CIN within the I-CRCs is that they were simply missed during the initial colonoscopy, which may be due to inaccurate surveillance or distinct clinical phenotype/features associated with certain polyps and/or tumors (reviewed in [18]). An alternative possibility is that I-CRCs represent a unique subset of tumors that harbor both CIN and MSI phenotypes. For example, it is possible that defects in the CIMP pathway could result in the epigenetic silencing of critical genes within the CIN and MSI pathways, which collectively synergize and drive the rapid growth of I-CRCs. Accordingly, subsequent studies are highly warranted in the Manitoban cohort, and those in which the initial MSI and CIMP work were conducted to concomitantly study the CIN and MSI pathways in the same cohort [14], [15], [17].
While our current understanding about the etiological origins of I-CRCs is limited, the pathways contributing to genomic instability within these tumors have now been identified. Our study provides evidence that CIN is a prevalent aberrant phenotype within I-CRCs and provides a mechanism for which CIN can be analyzed in many tumor types. An important strength of the current study is the development of a novel molecular pathologic approach to assess CIN that can be coupled with traditional clinical and epidemiological-based data (e.g., age, body mass index, diet, environmental factors, and so on) in an emerging field collectively referred to as molecular pathologic epidemiology [41], [42], [43]. The goal of molecular pathologic epidemiology is to integrate both molecular and population-level health information to help identify causative factors that contribute to the etiology of diseases, such as I-CRC. Accordingly, this study has developed a new CIN screen that can be considered an epidemiologic exposure variable, which can now be incorporated into future molecular pathologic epidemiology studies. Furthermore, an overall greater understanding of I-CRCs, especially at the molecular level, may uncover subcategories within I-CRCs, including missed sporadic CRC, synergistic growth advantage CRCs, and other contributors that are currently unknown. This evidence should help to identify precursor lesions and may impact screening programs with regard to the recommended time interval between screening colonoscopies. The ultimate goal is to understand the altered biology of I-CRCs to improve screening programs and develop novel therapeutic targets.
Footnotes
We are grateful for operational support from Canadian Institutes of Health Research (MOP 115179), CancerCare Manitoba (K.J.M. and H.S.), and Colon Cancer Canada (K.J.M. and H.S.). This study was supported by the Manitoba Tumor Bank (Winnipeg, Canada) funded in part by the CancerCare Manitoba Foundation and Canadian Institutes of Health Research. We acknowledge the strong support of the Research Institute of Oncology and Hematology and CancerCare Manitoba Foundation. The results and conclusions are those of the authors, and no official endorsement by Manitoba Health is intended or should be inferred.
This article refers to supplementary materials, which are designated by Supplementary Tables 1 to 5 and Supplementary Figures 1 to 3 and are available online at www.neoplasia.com.
Supplementary data to this article can be found online at http://dx.doi.org/10.1016/j.neo.2015.02.001.
Appendix A. Supplementary Materials
Cohort Characteristics and Chromosome Enumeration Results
Supplementary material
References
- 1.Markowitz SD, Bertagnolli MM. Molecular origins of cancer: Molecular basis of colorectal cancer. N Engl J Med. 2009;361(25):2449–2460. doi: 10.1056/NEJMra0804588. [DOI] [PMC free article] [PubMed] [Google Scholar]
- 2.American Cancer Society What are the key statistics about colorectal cancer? 2013. http://www.cancer.org/cancer/colonandrectumcancer/detailedguide/colorectal-cancer-key-statistics cited April 21, 2013, available from.
- 3.Canadian Cancer Society's Advisory Committee on Cancer Statistics . Canadian Cancer Society; Toronto, Ontario: 2014. Canadian Cancer Statistics 2014. [Google Scholar]
- 4.Meissner HI, Breen N, Klabunde CN, Vernon SW. Patterns of colorectal cancer screening uptake among men and women in the United States. Cancer Epidemiol Biomarkers Prev. 2006;15(2):389–394. doi: 10.1158/1055-9965.EPI-05-0678. [DOI] [PubMed] [Google Scholar]
- 5.Singh S, Singh PP, Murad MH, Singh H, Samadder NJ. Prevalence, Risk Factors, and Outcomes of Interval Colorectal Cancers: A Systematic Review and Meta-Analysis. Am J Gastroenterol. 2014;109(9):1375–1389. doi: 10.1038/ajg.2014.171. [DOI] [PubMed] [Google Scholar]
- 6.American Cancer Society . American Cancer Society; Atlanta, GA: 2011. Colorectal Cancer Facts & Figures 2011–2013. [Google Scholar]
- 7.Pabby A, Schoen RE, Weissfeld JL, Burt R, Kikendall JW, Lance P, Shike M, Lanza E, Schatzkin A. Analysis of colorectal cancer occurrence during surveillance colonoscopy in the dietary Polyp Prevention Trial. Gastrointest Endosc. 2005;61(3):385–391. doi: 10.1016/s0016-5107(04)02765-8. [DOI] [PubMed] [Google Scholar]
- 8.Leaper M, Johnston MJ, Barclay M, Dobbs BR, Frizelle FA. Reasons for failure to diagnose colorectal carcinoma at colonoscopy. Endoscopy. 2004;36(6):499–503. doi: 10.1055/s-2004-814399. [DOI] [PubMed] [Google Scholar]
- 9.Gorski TF, Rosen L, Riether R, Stasik J, Khubchandani I. Colorectal cancer after surveillance colonoscopy: false-negative examination or fast growth? Dis Colon Rectum. 1999;42(7):877–880. doi: 10.1007/BF02237093. [DOI] [PubMed] [Google Scholar]
- 10.Hosokawa O, Shirasaki S, Kaizaki Y, Hayashi H, Douden K, Hattori M. Invasive colorectal cancer detected up to 3 years after a colonoscopy negative for cancer. Endoscopy. 2003;35(6):506–510. doi: 10.1055/s-2003-39665. [DOI] [PubMed] [Google Scholar]
- 11.Robertson DJea. Interval Cancer After Total Colonoscopy: Results from a Pooled Analysis of Eight Studies. Gastroenterology. 2008;134(4):A-111–A-112. [Google Scholar]
- 12.Pohl H, Robertson DJ. Colorectal cancers detected after colonoscopy frequently result from missed lesions. Clin Gastroenterol Hepatol. 2010;8(10):858–864. doi: 10.1016/j.cgh.2010.06.028. [DOI] [PubMed] [Google Scholar]
- 13.le Clercq CM, Bouwens MW, Rondagh EJ, Bakker CM, Keulen ET, de Ridder RJ, Winkens B, Masclee AA, Sanduleanu S. Postcolonoscopy colorectal cancers are preventable: a population-based study. Gut. 2014;63(6):957–963. doi: 10.1136/gutjnl-2013-304880. [DOI] [PubMed] [Google Scholar]
- 14.Arain MA, Sawhney M, Sheikh S, Anway R, Thyagarajan B, Bond JH, Shaukat A. CIMP status of interval colon cancers: another piece to the puzzle. Am J Gastroenterol. 2010;105:1189–1195. doi: 10.1038/ajg.2009.699. [DOI] [PubMed] [Google Scholar]
- 15.Sawhney MS, Farrar WD, Gudiseva S, Nelson DB, Lederle FA, Rector TS, Bond JH. Microsatellite instability in interval colon cancers. Gastroenterology. 2006;131(6):1700–1705. doi: 10.1053/j.gastro.2006.10.022. [DOI] [PubMed] [Google Scholar]
- 16.Shaukat A, Arain M, Anway R, Manaktala S, Pohlman L, Thyagarajan B. Is KRAS mutation associated with interval colorectal cancers? Dig Dis Sci. 2012;57(4):913–917. doi: 10.1007/s10620-011-1974-6. [DOI] [PubMed] [Google Scholar]
- 17.Nishihara R, Wu K, Lochhead P, Morikawa T, Liao X, Qian ZR, Inamura K, Kim SA, Kuchiba A, Yamauchi M. Long-term colorectal-cancer incidence and mortality after lower endoscopy. N Engl J Med. 2013;369(12):1095–1105. doi: 10.1056/NEJMoa1301969. [DOI] [PMC free article] [PubMed] [Google Scholar]
- 18.Cisyk AL, Singh H, McManus KJ. Establishing a Biological Profile for Interval Colorectal Cancers. Dig Dis Sci. 2014;59(10):2390–2402. doi: 10.1007/s10620-014-3210-7. [DOI] [PubMed] [Google Scholar]
- 19.Colussi D, Brandi G, Bazzoli F, Ricciardiello L. Molecular pathways involved in colorectal cancer: implications for disease behavior and prevention. Int J Mol Sci. 2013;14(8):16365–16385. doi: 10.3390/ijms140816365. [DOI] [PMC free article] [PubMed] [Google Scholar]
- 20.Zoratto F, Rossi L, Verrico M, Papa A, Basso E, Zullo A, Tomao L, Romiti A, Lo Russo G, Tomao S. Focus on genetic and epigenetic events of colorectal cancer pathogenesis: implications for molecular diagnosis. Tumour Biol. 2014;35(7):6195–6206. doi: 10.1007/s13277-014-1845-9. [DOI] [PubMed] [Google Scholar]
- 21.Boland CR, Goel A. Microsatellite instability in colorectal cancer. Gastroenterology. 2010;138:2073–2087. doi: 10.1053/j.gastro.2009.12.064. [e2073] [DOI] [PMC free article] [PubMed] [Google Scholar]
- 22.Issa JP. CpG island methylator phenotype in cancer. Nat Rev Cancer. 2004;4(12):988–993. doi: 10.1038/nrc1507. [DOI] [PubMed] [Google Scholar]
- 23.Lengauer C, Kinzler KW, Vogelstein B. Genetic instability in colorectal cancers. Nature. 1997;386(6625):623–627. doi: 10.1038/386623a0. [DOI] [PubMed] [Google Scholar]
- 24.Lengauer C, Kinzler KW, Vogelstein B. Genetic instabilities in human cancers. Nature. 1998;396(6712):643–649. doi: 10.1038/25292. [DOI] [PubMed] [Google Scholar]
- 25.Kim YS, Deng G. Epigenetic changes (aberrant DNA methylation) in colorectal neoplasia. Gut Liver. 2007;1(1):1–11. doi: 10.5009/gnl.2007.1.1.1. [DOI] [PMC free article] [PubMed] [Google Scholar]
- 26.Sajesh BV, Bailey M, Lichtensztejn Z, Hieter P, McManus KJ. Synthetic lethal targeting of superoxide dismutase 1 selectively kills RAD54B-deficient colorectal cancer cells. Genetics. 2013;195(3):757–767. doi: 10.1534/genetics.113.156836. [DOI] [PMC free article] [PubMed] [Google Scholar]
- 27.Singh H, Nugent Z, Demers A, Czaykowski PM, Mahmud SM. Risk of colorectal cancer after diagnosis of endometrial cancer: a population-based study. J Clin Oncol. 2013;31(16):2010–2015. doi: 10.1200/JCO.2012.47.6481. [DOI] [PubMed] [Google Scholar]
- 28.Pino MS, Chung DC. The chromosomal instability pathway in colon cancer. Gastroenterology. 2010;138(6):2059–2072. doi: 10.1053/j.gastro.2009.12.065. [DOI] [PMC free article] [PubMed] [Google Scholar]
- 29.Barber TD, McManus K, Yuen KW, Reis M, Parmigiani G, Shen D, Barrett I, Nouhi Y, Spencer F, Markowitz S. Chromatid cohesion defects may underlie chromosome instability in human colorectal cancers. Proc Natl Acad Sci U S A. 2008;105(9):3443–3448. doi: 10.1073/pnas.0712384105. [DOI] [PMC free article] [PubMed] [Google Scholar]
- 30.Price JC, Pollock LM, Rudd ML, Fogoros SK, Mohamed H, Hanigan CL, Le Gallo M, Program NI, Zhang S, Cruz P. Sequencing of candidate chromosome instability genes in endometrial cancers reveals somatic mutations in ESCO1, CHTF18, and MRE11A. PLoS One. 2013;8(6):e63313. doi: 10.1371/journal.pone.0063313. [DOI] [PMC free article] [PubMed] [Google Scholar]
- 31.Goke F, Goke A, von Massenhausen A, Franzen A, Sharma R, Kirsten R, Bohm D, Kristiansen G, Stenzinger A, Wynes M. Fibroblast growth factor receptor 1 as a putative therapy target in colorectal cancer. Digestion. 2013;88(3):172–181. doi: 10.1159/000355018. [DOI] [PMC free article] [PubMed] [Google Scholar]
- 32.Forbes SA, Bindal N, Bamford S, Cole C, Kok CY, Beare D, Jia M, Shepherd R, Leung K, Menzies A. COSMIC: mining complete cancer genomes in the Catalogue of Somatic Mutations in Cancer. Nucleic Acids Res. 2011;39:D945–D950. doi: 10.1093/nar/gkq929. [Database issue] [DOI] [PMC free article] [PubMed] [Google Scholar]
- 33.Grady WM, Carethers JM. Genomic and epigenetic instability in colorectal cancer pathogenesis. Gastroenterology. 2008;135(4):1079–1099. doi: 10.1053/j.gastro.2008.07.076. [DOI] [PMC free article] [PubMed] [Google Scholar]
- 34.Reichmann A, Levin B, Martin P. Human large-bowel cancer: correlation of clinical and histopathological features with banded chromosomes. Int J Cancer. 1982;29(6):625–629. doi: 10.1002/ijc.2910290605. [DOI] [PubMed] [Google Scholar]
- 35.Delattre O, Olschwang S, Law DJ, Melot T, Remvikos Y, Salmon RJ, Sastre X, Validire P, Feinberg AP, Thomas G. Multiple genetic alterations in distal and proximal colorectal cancer. Lancet. 1989;2(8659):353–356. doi: 10.1016/s0140-6736(89)90537-0. [DOI] [PubMed] [Google Scholar]
- 36.Furlan D, Carnevali IW, Bernasconi B, Sahnane N, Milani K, Cerutti R, Bertolini V, Chiaravalli AM, Bertoni F, Kwee I. Hierarchical clustering analysis of pathologic and molecular data identifies prognostically and biologically distinct groups of colorectal carcinomas. Mod Pathol. 2011;24(1):126–137. doi: 10.1038/modpathol.2010.179. [DOI] [PubMed] [Google Scholar]
- 37.Choi SW, Lee KJ, Bae YA, Min KO, Kwon MS, Kim KM, Rhyu MG. Genetic classification of colorectal cancer based on chromosomal loss and microsatellite instability predicts survival. Clin Cancer Res. 2002;8(7):2311–2322. [PubMed] [Google Scholar]
- 38.Sinicrope FA, Rego RL, Halling KC, Foster N, Sargent DJ, La Plant B, French AJ, Laurie JA, Goldberg RM, Thibodeau SN. Prognostic impact of microsatellite instability and DNA ploidy in human colon carcinoma patients. Gastroenterology. 2006;131(3):729–737. doi: 10.1053/j.gastro.2006.06.005. [DOI] [PubMed] [Google Scholar]
- 39.Watanabe T, Kobunai T, Yamamoto Y, Matsuda K, Ishihara S, Nozawa K, Yamada H, Hayama T, Inoue E, Tamura J. Chromosomal instability (CIN) phenotype, CIN high or CIN low, predicts survival for colorectal cancer. J Clin Oncol. 2012;30(18):2256–2264. doi: 10.1200/JCO.2011.38.6490. [DOI] [PubMed] [Google Scholar]
- 40.Walther A, Houlston R, Tomlinson I. Association between chromosomal instability and prognosis in colorectal cancer: a meta-analysis. Gut. 2008;57(7):941–950. doi: 10.1136/gut.2007.135004. [DOI] [PubMed] [Google Scholar]
- 41.Ogino S, Stampfer M. Lifestyle factors and microsatellite instability in colorectal cancer: the evolving field of molecular pathological epidemiology. J Natl Cancer Inst. 2010;102(6):365–367. doi: 10.1093/jnci/djq031. [DOI] [PMC free article] [PubMed] [Google Scholar]
- 42.Bishehsari F, Mahdavinia M, Vacca M, Malekzadeh R, Mariani-Costantini R. Epidemiological transition of colorectal cancer in developing countries: environmental factors, molecular pathways, and opportunities for prevention. World J Gastroenterol. 2014;20(20):6055–6072. doi: 10.3748/wjg.v20.i20.6055. [DOI] [PMC free article] [PubMed] [Google Scholar]
- 43.Ogino S, Chan AT, Fuchs CS, Giovannucci E. Molecular pathological epidemiology of colorectal neoplasia: an emerging transdisciplinary and interdisciplinary field. Gut. 2011;60(3):397–411. doi: 10.1136/gut.2010.217182. [DOI] [PMC free article] [PubMed] [Google Scholar]
Associated Data
This section collects any data citations, data availability statements, or supplementary materials included in this article.
Supplementary Materials
Cohort Characteristics and Chromosome Enumeration Results
Supplementary material