
Figure 2.
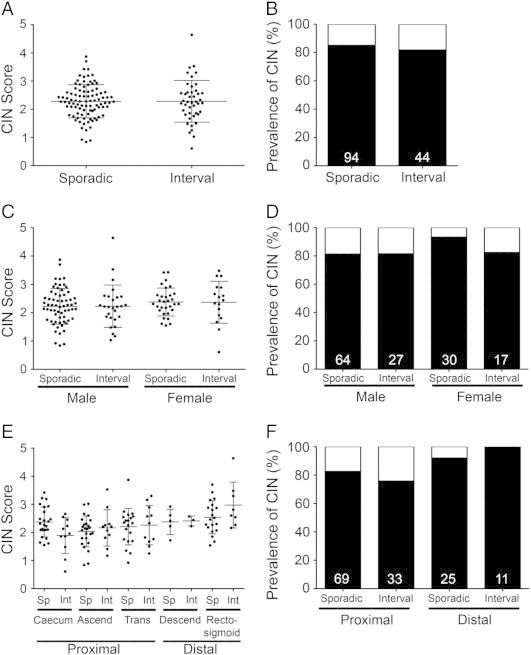
The prevalence of CIN within sporadic and I-CRCs. (A) Scatterplot depicting the distribution of the CS for each sporadic and I-CRC sample. An overall group mean ± SD is indicated by the horizontal bars for both the sporadic and interval populations. (B) Bar graph depicting the percentage of sporadic and I-CRCs displaying a CIN phenotype (black) as defined by CS ≥ 1.68 (see Materials and Methods section). Numbers at the base of the bars identify the total number of samples within that group. (C) Scatterplot depicting the distribution of CS for males and females within the sporadic and I-CRCs. An overall group mean ± SD is indicated for both the sporadic and interval populations. (D) Bar graph presenting the percentage of male and female tumors exhibiting a CIN phenotype (CS ≥ 1.68; black). Numbers in each column identify the total number of samples within that group. (E) Scatterplot showing the overall distribution of CS based on the indicated location (x-axis). An overall group mean ± SD is indicated for each location. Note that, in general, the overall distributions and group means increase from left to right (proximal to distal colon). (F) Bar graph presenting the percentage of sporadic and I-CRCs exhibiting CIN phenotypes within the proximal and distal colon.