

Abstract
We propose that self-control failures, and variation across individuals in self-control abilities, are partly due to differences in the speed with which the decision-making circuitry processes basic attributes like taste, versus more abstract attributes such as health. We test these hypotheses by combining a dietary choice task with a novel form of mouse tracking that allows us to pinpoint when different attributes are being integrated into the choice process with millisecond temporal resolution. We find that, on average, taste attributes are processed about 195 ms earlier than health attributes during the choice process. We also find that 13 - 39% of observed individual differences in self-control ability can be explained by differences in the relative speed with which taste and health attributes are processed.
INTRODUCTION
A large fraction of the population struggles with dietary self-control. For them, a choice between an apple and a chocolate chip cookie is more difficult than a choice between an apple and an orange, and is also more likely to result in decision mistakes (Rangel, 2013). This leads to two basic questions: Why is sustained dietary self-control so difficult for so many? Why do some individuals have better self-control than others?
These important questions have received considerable attention in several disciplines, including economics, psychology, and neuroscience. Behavioral economists conceptualize self-control failures as instances in which individuals over-discount the future consequences of their decisions (Ikeda, Kang, & Ohtake, 2010; Laibson, 1997; O’Donoghue & Rabin, 1999). Related to this idea, psychologists have proposed that dietary self-control is hard due to inherent limitations in how we process two different types of attributes (Liberman & Trope, 2008). In this view, basic attributes like the anticipated taste of foods are easily represented at the time of choice, and reliably weighted in decisions. In contrast, taking into account more abstract attributes like the healthiness of foods is thought to require effort, and as a result they are not weighted as reliably in decisions. This leads to a relative overweighting of taste compared to health information, which can result in poor dietary choices. Neuroscientists have identified neural mechanisms underlying the differences between how taste and health attributes are computed at the time of decision in people with good and poor self-control (Hare, Camerer, & Rangel, 2009). In both groups, areas of ventromedial prefrontal cortex (vmPFC) represent the overall value assigned to the food. However, in individuals with poor self-control this area responds only to the taste of foods, whereas in individuals with good self-control it responds to both health and taste information. Furthermore, in those with good self-control, areas of left dorsolateral prefrontal cortex seem to modulate value-related activity in vmPFC.
Here we propose that dietary self-control failures are partly due to differences in the speed with which the decision-making circuitry processes basic attributes like taste, versus more abstract attributes such as health. In particular, we test the following two explanations of the questions posed above. First, we hypothesize that dietary self-control is difficult for many because, on average, taste attributes are processed earlier than health attributes. Second, we hypothesize that individual differences in dietary self-control abilities are related to differences in the relative speed with which taste and health attributes are processed. In particular, we hypothesize that the ability to deploy self-control decreases with increasing delays of the start of health information processing, relative to taste.
These two hypotheses are inspired by a robust implication of several models of choice, including Decision Field Theory (Busemeyer & Townsend, 1993), the Drift-Diffusion Model (Ratcliff & McKoon, 2008), and the Leaky Competing Accumulator Model (Usher & McClelland, 2001). As illustrated in Figure 1, these models assume that the brain makes decisions by computing a dynamic signal that measures the value of two possible responses: in the example described above, choosing to eat a cookie (“Yes”) or declining it (“No”). At every instant, the signal estimates the relative value of “Yes” by adding a noisy measure of the value of the item, given by a weighted linear combination of the item’s attributes plus some Gaussian noise. A choice is made the first time one of two pre-established barriers is crossed: “Yes” if the upper one is reached first, “No” in the other case. A critical feature of this model is that an attribute can affect the evolution of the value signal only if it is being represented at that instant. Thus, as illustrated in Figure 1, if taste information is processed starting at 500 ms, but health information is processed only starting at 1000 ms, then during the interim the value signal is influenced only by taste. This would move the signal closer to the choice associated with the tastier item and decrease the likelihood of choosing the healthy item. In fact, if the onset of health information processing is sufficiently delayed, a choice will be made before it can influence the decision at all.
Figure 1.
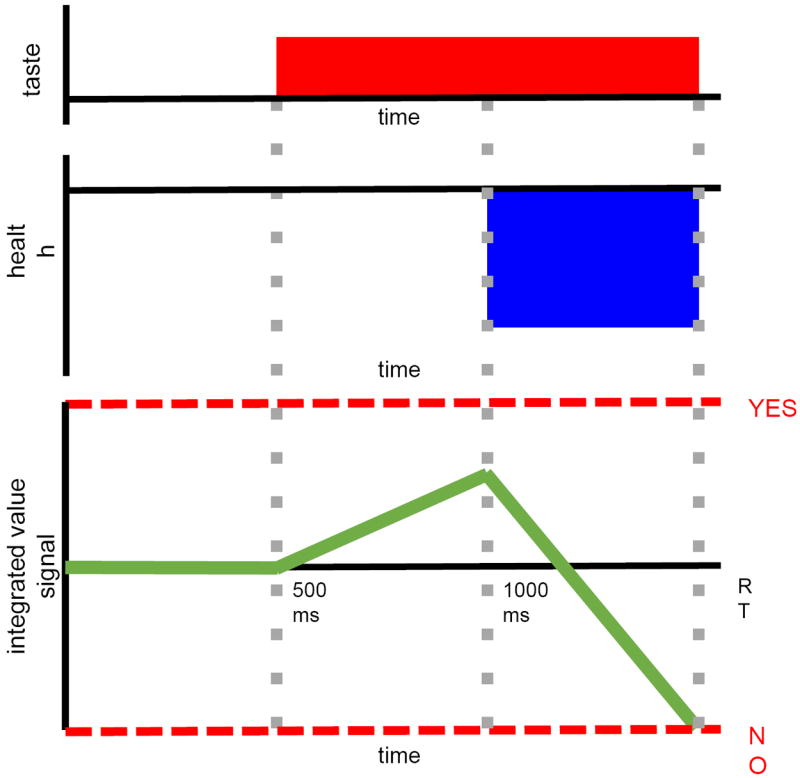
Illustration of how the time at which attributes are computed could affect choices in sequential integrator models of choice. Consider an example in which the subject needs to decide whether to eat a food that is somewhat tasty, but which is quite unhealthy. Suppose also that taste information is computed from 500 ms until a decision is made, whereas health information is computed only after 1000 ms. A choice is made by computing a dynamic value signal that starts at zero and sequentially integrates a weighted linear sum of the attributes represented at this time plus noise. These weights can be interpreted as the “true preferences” that the individual is trying to maximize. A choice is made the first time the integrated value signal crosses one of the two pre-established barriers. For simplicity, the integrated value signal is depicted without noise. The gap in processing times then implies that only taste information affects the value signal between 500 and 1000 ms, which increases the likelihood that an unhealthy choice is made.
These hypotheses are related to the previous findings discussed above, but posit a different and novel mechanism underlying difficulties in the ability to exercise self-control. The emphasis here is on the speed at which attributes are processed, and not on differences in the ability to process the attributes, or on how they would be weighted under the individual’s true preference (i.e., if choices could be made without noise). In particular, differences in the speed of processing can generate differences in the relative influence of health and taste on the final decision, but such weighting differences need not be due to differences in processing speed. This distinction is important because many contextual variables (e.g., time pressure, marketing) could have a direct effect on the relative speed at which different attributes are computed, without directly affecting how they influence choice.
In order to test these hypotheses, it is necessary to have a dynamic measure of the extent to which different attributes are integrated into the choice process while the decision is being made, and with sub-second temporal resolution. Building on the pioneering mouse-tracking literature (Dale, Kehoe, & Spivey, 2007; Dshemuchadse, Scherbaum, & Goschke, 2013; Freeman & Ambady, 2009; Freeman, Ambady, Rule, & Johnson, 2008; McKinstry, Dale, & Spivey, 2008; Song & Nakayama, 2008; Spivey, Grosjean, & Knoblich, 2005), we asked subjects to indicate their choice using a continuous computer mouse movement. By measuring the mouse positions along the trajectory, we can infer the state of the choice process prior to the final decision. Scherbaum, Dshemuchadse, and Goschke (2012) propose a related link between connectionist models and intertemporal choice.
METHODS
Subjects
Twenty-eight students (25% female, 93% right-handed) participated in the experiment, which was approved by Caltech’s Institutional Review Board. Subjects received $25 for their participation. They were asked to fast for four hours prior to the experiment. Compliance with this instruction was monitored by self-report.
Task
Subjects performed the following three tasks, always in the same order.
First, over three separate blocks, they rated 160 different foods in terms of: 1) tastiness (“How tasty is this food?”), 2) healthiness (“How healthy is this food”), and 3) overall liking (“How much would you like to eat this food at the end of the experiment?”). Block and stimulus order were randomized across subjects. All ratings used a five-point scale (-2=very little to 2=very much). Based on pre-testing, we selected food stimuli in which health and taste had minimal correlation for a typical subject (r = 0.2, p<0.001). The foods included fruits, candies, chips, and granola bars. On every rating trial, a single color image was presented at the center of the screen (~ 5.6 × 4.3 inches), on a black background, and in high resolution (1680×1050 pixels) on 20.1-inch 96 DPI LCD monitors.
Second, subjects were asked to read a short excerpt from WebMD.com on the importance of healthy eating (Fig. S1). This was done to increase the frequency with which they exhibited dietary self-control in the food choice task described next.
Third, subjects made 280 binary choices among randomly-selected pairs of foods. Food pairs were selected for the choice task to include an equal number of trials for each combination of taste-health rating pairs, with foods rated as neutral on both taste and health excluded. Choices were made in 40-trial blocks, with short rests in between. There were two types of trials. In six randomly selected blocks, subjects used the computer mouse to indicate their choice (“mouse trials”). In the other block, they used the keyboard to enter their response (“keyboard trials”). Subjects were informed of the type of the trial at the beginning of each block.
Figure 2A describes a typical mouse trial. The trial began with the display of the Start Box at the bottom-center of a black screen. Subjects had to click in this box with the mouse to start the trial. This was followed by a blank screen of random duration drawn from a uniform distribution of 200-500 ms (mean duration 350 ms), during which the mouse cursor disappeared from the screen. At the end of this blank screen, the mouse cursor reappeared in the bottom-center of the screen, where the start box used to be, and pictures of two foods appeared on the top-left and top-right portions of the screen, surrounded by equal-size white boxes (174×131 pixels). Subjects were instructed to make a choice by using the mouse to move the cursor continuously to the location where their preferred food was displayed, either top-left or top right. The location of each food (left versus right) was randomized on each trial. Once the subject clicked inside one of the food boxes, a choice was recorded. Subjects were not constrained in how long they could take to enter their response, but were instructed to respond as quickly and accurately as possible. Importantly, the actual foods did not appear until a mouse movement was detected. This was done in order to promote fluid mouse movements during the choice process. Cursor velocity was significantly greater than zero for normalized time points 1 through 99 (two-sided t-test; p<0.01, uncorrected for multiple comparisons), suggesting that movements were fluid on average. Trials were separated by a fixation of random duration (uniform random 400-700 ms; mean 550 ms).
Figure 2.
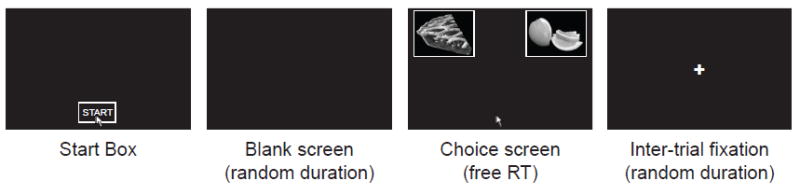
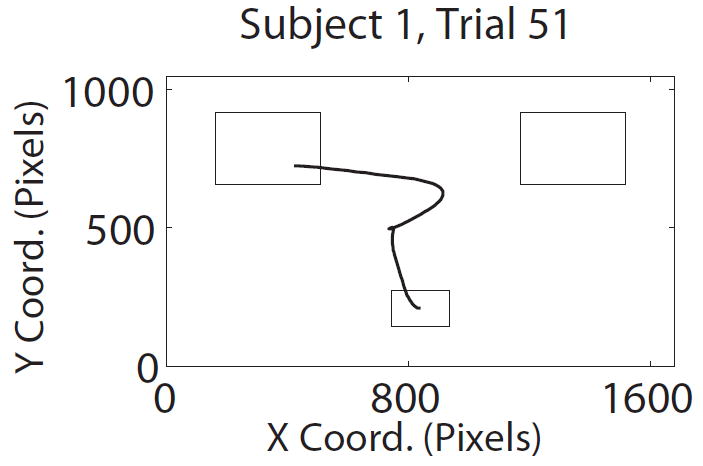
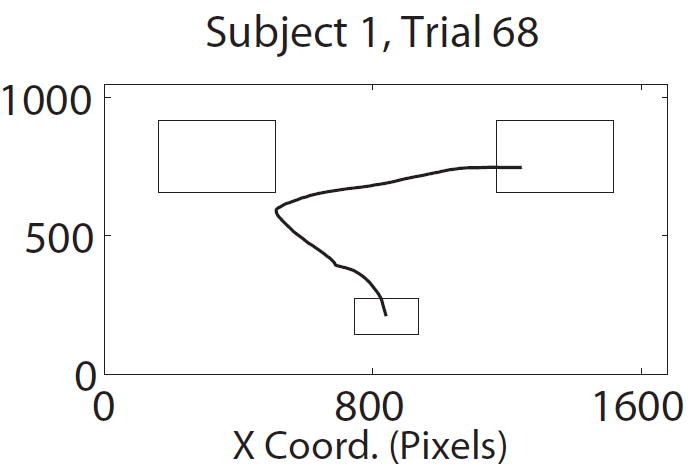
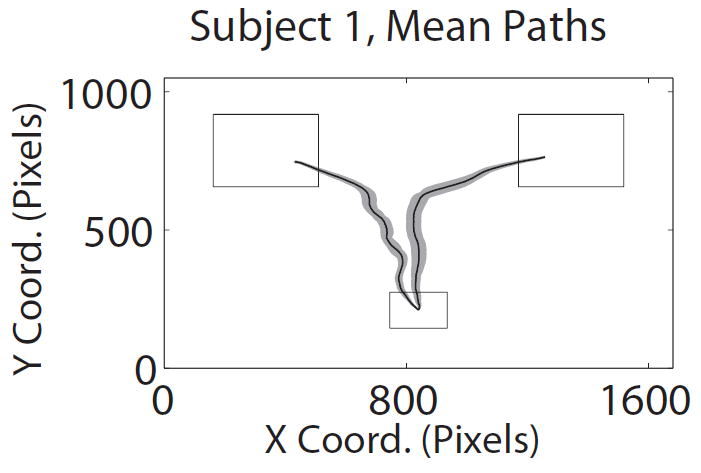
Task description. A) Structure of trials in the mouse tracking choice task. B) Representative paths with two (left) and one (right) changes of direction along the x-axis. C) Average path over all trials for the same subject, conditional on choosing left and choosing right.
Keyboard trials had an identical structure except for the following differences. Subjects kept two fingers over the keyboard buttons associated with left and right responses at all times, and did not use the mouse. Trials were initiated by pressing the spacebar. Foods appeared automatically after the middle blank screen. Subjects indicated their choices by pressing the left or right keys.
Subjects cared about the choices because at the end of the experiment, their choice from a single randomly selected trial was implemented. Subjects were asked to remain in the lab following the choice task until they had eaten the food, or 30 minutes had expired, whichever occurred first. Since they did not know in advance which trial would be selected, their best strategy was to treat every choice as if it were the only one.
Mouse tracking
During mouse trials, the cursor’s X, Y position was tracked using Psychophysics Toolbox (Brainard, 1997) with a temporal resolution of 67 Hz. For the purpose of the analyses below, we shifted and normalized the coordinates so that the center of the Start Box – the location at which the cursor appears – is at (0,0), the pixel clicked to select the left option is at (-1,1), and the pixel clicked to select the right option is at (1,1).
Data pre-processing
To reduce some of the noise caused by trials where subjects seemed to have difficulty complying with the instruction to make continuous and rapid mouse movements, we applied two pre-processing steps to the mouse data. First, for each subject, mouse trials with reaction times (RTs) greater than two standard deviations above their mouse trial mean were excluded from further analysis (mean 13.3% of trials). For comparison, the mean RT in mouse trials was 1814 ms (S.D. = 524 ms). Second, we also removed a small fraction of trials in which the mouse trajectory crossed the y-axis more than three times (mean 3.3% of trials per subject; 26 of 28 subjects had at least one such trial). In contrast, as illustrated in Figure 2B, most trials involved one or two changes of direction. We emphasize that these criteria were selected a priori, are not based on their effect on the analyses below, and do not have a qualitative impact on the results.
Time normalization
In order to facilitate comparison across trials with large differences in reaction times, time was normalized in most of the analyses described below. In particular, the duration of every trial was sliced into 101 identical time bins, with t = 1 indicating the start position at (0,0), and t = 101 indicating the time a choice was recorded. Thus, the index t provides a measure of normalized time.
We have also carried out all of the analyses using absolute time and found similar but noisier qualitative results. We believe that this is due to sizable cross-subject differences in reaction times, which might reflect differences in underlying cognitive processing speeds. Such differences would render these analyses are problematic, because absolute time then reflects different stages of cognitive processing in different subjects. In contrast, this issue does not arise in the time-normalized analyses. For this reason, here we work with normalized time.
Trajectory analyses
Below, we report various types of trajectory analyses. These analyses come in two different types.
First, we estimate several linear regressions of how the trajectory angle at every normalized time point is affected by the attributes of the foods. The trajectory angle at time t provides a measure of the direction of movement between t and t+1, and is normalized such that -45° always indicates a direct movement towards the left item, 0° always indicates a movement straight upwards, and +45° always indicates a direct movement towards the right item. These regressions are estimated at the individual level, and then the relevant estimated coefficients are pooled across subjects.
Second, we also use the results from these regressions to identify the earliest (normalized) time at which various properties of the foods have a significant and lasting influence on the trajectories. This is done by carrying out a one-sided test of the hypothesis that the estimated regression coefficient of interest is significant at the 5% level, for each individual and time index. We use one-tailed tests because we are interested in when they become positively significant. The earliest time window at which the test is satisfied is then labeled as the earliest time at which the variable of interest has a significant positive impact on the mouse trajectory for that subject. Importantly, the test requires that the variable maintain its significance from that time point through the end of the trial. Group comparisons are then performed by carrying out two-sided t-tests on the relevant distribution of individual statistics.
For expositional reasons, further details on the trajectory analyses are provided in the relevant parts of the Results section.
RESULTS
To test the hypothesis that the relative speed with which taste and health are computed affects dietary self-control, it is necessary to have a good measure of how the influence of these attributes evolves over the decision process. Here we constructed such a measure by asking subjects to indicate their choice using a continuous mouse movement, with positions along the trajectory serving to measure the state of the choice process prior to the final decision. This is a critical aspect of our experiment because it allows us to identify, prior to the final decision, the time at which the taste and health attributes begin influencing choice. The method is justified as long as movements of the computer mouse are correlated, at every instant, with changes in the integrated value signal illustrated in Figure 1. In this case, if the trajectory of the mouse at time t is affected by health information, then we can conclude that the underlying relative value signal of interest is also being modulated by health at that time.
To see the power of this technique, consider a hypothetical example. Suppose that we look at the mouse trajectories for a given subject and find that they have the following two properties. First, the relative position between the left and right options, as measured by x-position, is significantly related to the relative taste rating (given by tasteR − tasteL) after 300 ms, but not before. Second, the x-position is also related to the relative health rating of the foods (given by healthR − healthL) after 800 ms, but not before. Then we could conclude that the taste attributes were processed by the choice circuitry 500 ms earlier than the health attributes. Furthermore, the technique allows us to test whether differences in the earliest time at which health and taste information are processed could explain differences in dietary self-control across individuals.
Paradigm validation
We began the analysis by carrying out several tests designed to address concerns about the validity of the paradigm.
One natural concern is that requiring subjects to indicate their choices with a mouse, instead of more common methods such as a button press, might affect the choices or the computations of the choice circuitry. In order to address this concern, we asked subjects to make otherwise identical choices using either the keyboard or the mouse, and then compared the behavior generated by both conditions. Figure 3A depicts the average choice curve for the group, which relates the relative value of the left item (measured independently by likingL − likingR) to the probability of choosing left. We found that the two cases led to indistinguishable choice curves (mean logistic slope mouse = -0.37, mean logistic slope keyboard = -0.33; p=0.22, t(27)=1.25, two-tailed). Figure 3B plots the reaction time curves as a function of choice difficulty (measured by |likingL − likingR|). Although mean reaction times were longer in the mouse condition (mouse mean = 1814 ms; keyboard mean = 1258 ms; t(27)=4.54, p=0.0001, two-tailed), likely due to the additional motor complexity of the mouse-tracking task, in both cases RTs decreased with choice difficulty, as measured by the absolute value of the liking rating differences (mouse mean linear regression slope = -0.036; keyboard mean linear regression slope=-0.051; p=0.18, t(27)=-1.36, two-tailed). This pattern is a common property of binary choice (Ashby, 1983; Luce, 1986; Milosavljevic, Malmaud, Huth, Koch, & Rangel, 2010; Ratcliff & Rouder, 1998; Rolls, Grabenhorst, & Deco, 2010), and a key prediction of the type of integrator models of decision-making discussed above. These results suggest that the nature of the choice process was not substantially altered by the use of mouse tracking.
Figure 3.
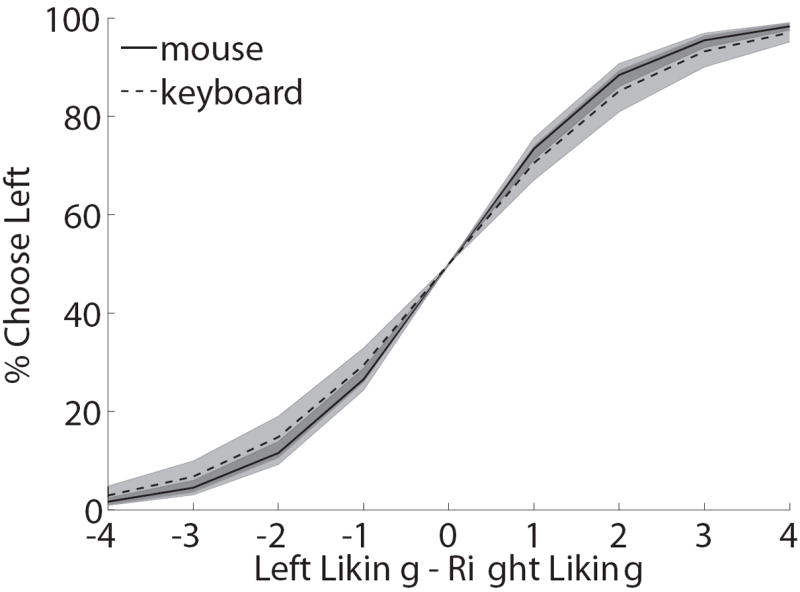
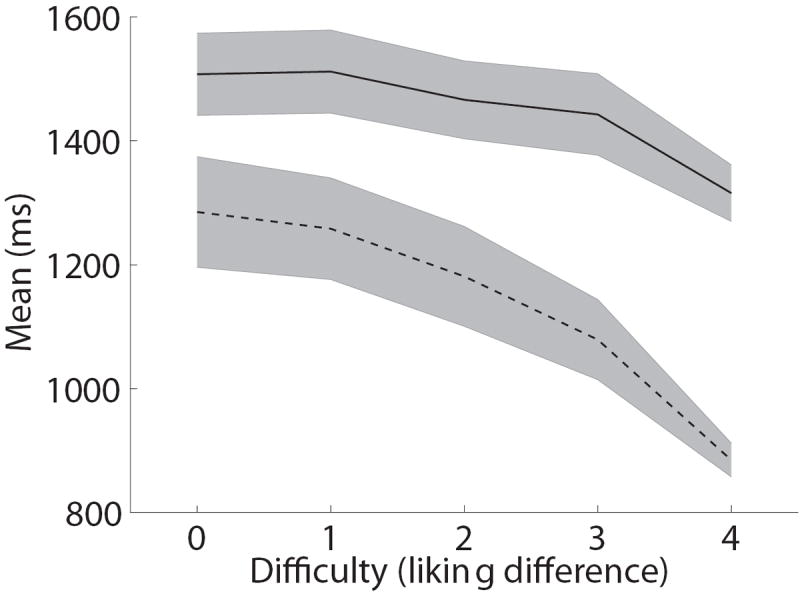
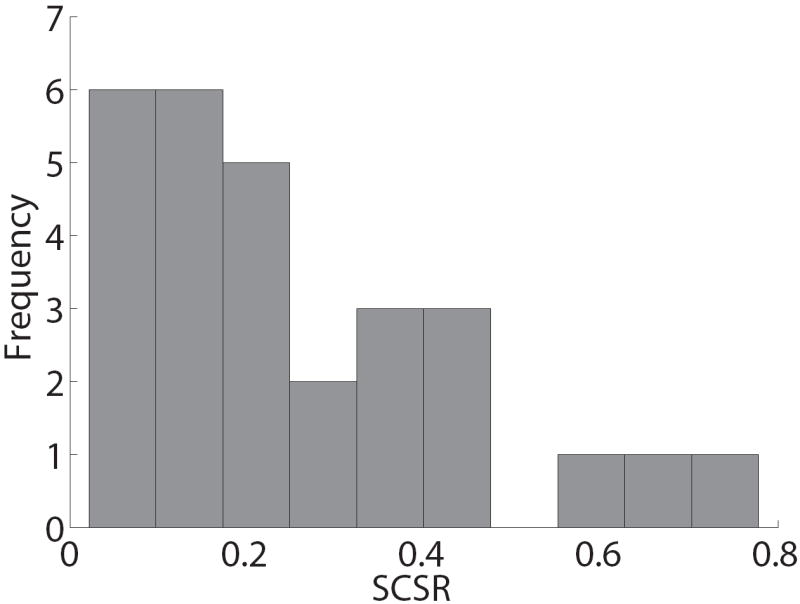
Paradigm validation. A) Psychometric choice curve for mouse and keyboard choice trials. B) Mean reaction time versus choice difficulty, as measured by |likingR − likingL|. A zero here indicates a difficult choice between two equally liked foods, and a four indicates an easy choice between foods with opposite liking ratings. C) Impact of relative food value (as measured by likingR − likingL) on the mouse’s angle trajectory, measured at each normalized time window. Error bands denote standard errors computed across subjects. D) Distribution of self-control success ratio (SCSR) across subjects.
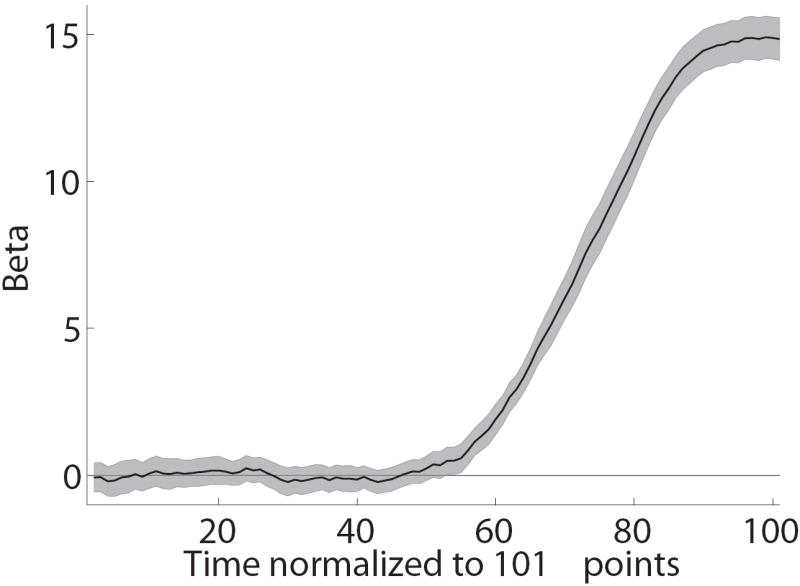
Another natural concern is that the mouse trajectories might not provide a good measure of the extent to which the properties of the foods are dynamically incorporated in the decision process. This could happen, for example, if individuals always made their decision before moving the mouse, and then made a very rapid straight movement to the chosen option. The paths depicted in Figure 2B suggest that this was not the case, but we also conducted a more rigorous test, which was constructed as follows. For each normalized time window (from t = 1 to t =101), and each individual, the local angle trajectory was regressed against the relative value of the two options (as measured by likingR − likingL). The estimated slope, plotted in Figure 3C for each time window, provides a measure of the extent to which the value information is influencing the choice process at different times. We found that, across the group, the earliest time at which the value information had a sustained, significant, effect on the trajectories, without ever returning to being not-significant, for the group was t = 56. Furthermore, the impact of value rose gradually over the course of the trial. In contrast, if individuals had made their choice before moving their mouse, and then had responded very rapidly with a straight trajectory, the time-course depicted in Figure 3C would look approximately like a step function. This suggests that the information about the choice options is incorporated gradually into the choice process, and that the magnitude of the effect could be measured with our methodology.
Finally, we tested if there was cross-subject variation in the ability to exercise dietary self-control. This is important since we are interested in looking at the extent to which individual differences in self-control can be explained by differences in the speed with which taste and health attributes are computed. To measure self-control success for each subject, we first divided trials into those that entailed a self-control challenge and those that did not. Challenge trials involved a choice between two foods in which one food had a higher health rating and the other had a higher taste rating. In this case, successful self-control occurred when the subject choose the healthier item, whereas choosing tastier item constituted a self-control failure. In contrast, in non-challenge trials one of the items had a higher rating in both dimensions, and thus there was no need to exercise self-control. Given this, we defined a subject’s self-control success ratio (SCSR) to be the fraction of challenge trials in which self-control was successfully exercised. Figure 3D depicts the distribution of SCSRs across the group, and shows that there was substantial variation across subjects (mean = 25%, range: 2-78%). There were no significant RT differences between challenge and non-challenge trials (challenge mean = 1782 ms; non-challenge mean = 1701 ms; t(27)=0.78, p=0.44, two-tailed), consistent with the hypothesis that both types of trials utilize a similar decision process.
Taste is reflected in the choice process earlier than health
We now address the first hypothesis of the study: Does taste information tend to influence the choice process earlier than health information?
To test this question, we examined how mouse angle trajectories across successive normalized time windows were weighted on taste and health information. For every subject and time window, we estimated a linear regression of the angle trajectory on relative taste (tasteR − tasteL) and relative health (healthR − healthL). The resulting estimated coefficients provide a measure of the extent to which each attribute influences the choice process at that time window. Figure 4A summarizes the effect of these regressions by plotting the mean time course of the estimated coefficients, as well as the times at which the distribution of estimates for the group first became significantly larger than zero without ever returning to being not-significant. As hypothesized, mouse trajectories were influenced by taste at significantly earlier time slices compared to health (taste: t = 55; health: t = 67; p<0.05 threshold, one-tailed). We carried out an additional test of the same hypothesis by estimating the earliest normalized time at which each attribute became significant, separately for each individual, and then comparing their distributions. We found that health never became a significant influence on the trajectory for 32% of subjects, whereas for taste this happened for zero subjects. Furthermore, as shown in Figure 4B we also found that the mean earliest time for a significant effect of health was later than the mean earliest time for taste (mean difference = 9.11, p=0.032, t(18)=-1.97, one-tailed).
Figure 4.
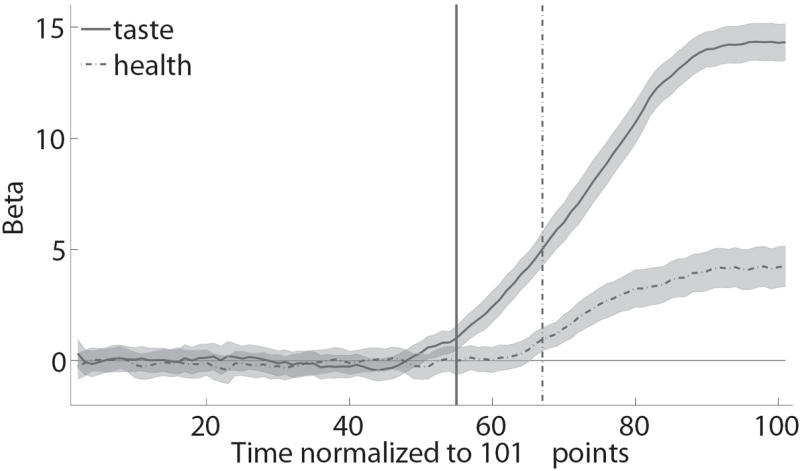
Average effect of taste and health attributes on mouse trajectories. A) Evolution of the effect of relative taste (given by tasteR − tasteL) and relative health (given by healthR − healthL) on the change in trajectory angle at each normalized time window. Lines denote group means. Error bands denote standard errors. Vertical lines are the earliest times at which each attribute becomes and remains significantly greater than zero. See text for details. B) Distribution of individual estimates of the earliest time at which each attribute significantly affects the trajectory.
Together, these results suggest that, on average, taste information began to influence the choice process about 9% earlier than health information. Given the average duration of the trials, this corresponded to an onset of health attribute processing by the choice circuitry approximately 195 ms later than the onset for taste.
Individual differences in dietary self-control are associated with differences in the relative speed at which taste and health attributes are computed
We next addressed the second hypothesis of the paper: Are individual differences in dietary self-control associated with differences in the relative speed at which the health and taste attributes are computed?
To answer this question, we began by comparing how taste and health information were reflected in the mouse trajectories for individuals with high versus low self-control, as defined using a median split of the SCSR statistic. As shown in Figure 5A, we found substantial differences across the groups. In particular, in the high self-control group, the paths for taste and health were quite similar and became significantly greater than zero at approximately the same time (health: t = 67; taste: t = 60). In contrast, for the low self-control group, the latency at which taste became significant was similar to that of the high self-control group (t = 56), but that for health occurred much later (t = 85). As before, we tested for the significance of these differences by estimating at the individual level the earliest time at which health attributes become significantly greater than zero, and then comparing the distributions. The normalized time at which taste and health became significant did not differ for high self-control subjects (mean health: t = 69.50; mean taste: t = 68.54; mean difference = -2.9; t(9)=-0.46, p=0.33, one-tailed), but they were significantly different in the low self-control group (mean health: t = 81.22; mean taste: t = 61.35; mean difference = -16, t(8)=-2.5, p=0.02, one-tailed).
Figure 5.
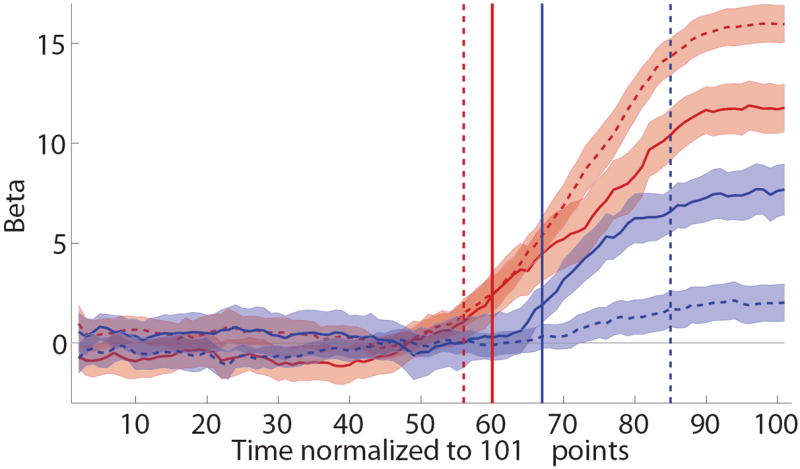
Individual differences in self-control. A) Evolution of the effect of relative taste and relative health on the mouse trajectory, computed separately for individuals with high and low self-control. Error bands denote standard errors. Vertical lines are the earliest times at which each attribute becomes significantly different than zero. Note that the health attribute never becomes significant for the low self-control group. B) Self-control success ratios against individual measures of the computational advantage of taste over health, as measured by the difference between the earliest time at which health becomes significant minus the earliest time at which taste becomes significant. Circles indicate subjects for whom both taste and health had a significant effect on trajectories before the end of the trial. Crosses indicate subjects for whom it did not. For those subjects, the value of the earliest time for health was set to t = 102. See text for details.
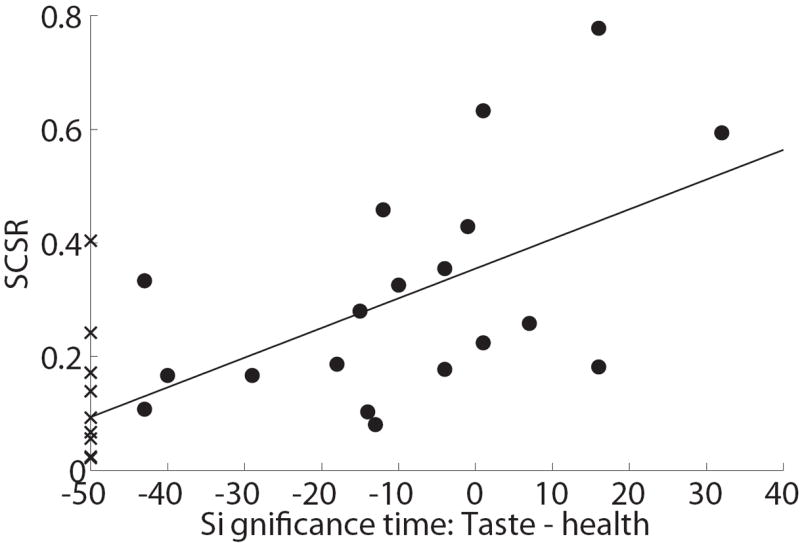
Figure 5B takes this analysis a step further. For each subject, we computed a measure of the “computational advantage” of taste, given by the earliest time at which taste significantly affected and continued to affect the trajectories minus the earliest time at which health did. We then estimated a linear regression of the SCSR measures of self-control against the individual measures of the ‘computational advantage’ for taste versus health. This regression tests the extent to which individual differences in self-control can be attributed to individual differences in the relative speed at which the health and taste attributes are processed. Since health never became significant for 32% of the subjects, we carried out the test in two different ways. In one case we assumed that, for the problem subjects, health first became significant at t = 102, one time point after the final time point, and estimated the regression using all of the subjects (linear regression slope = 0.005, p<0.0004, R2= 0.39). In the other case, we simply excluded these subjects, carrying out the regression using only the 67.9% of subjects for whom health became significant during the trial. This yielded a similar result (linear regression slope = 0.005, p=0.02, R2=0.29).
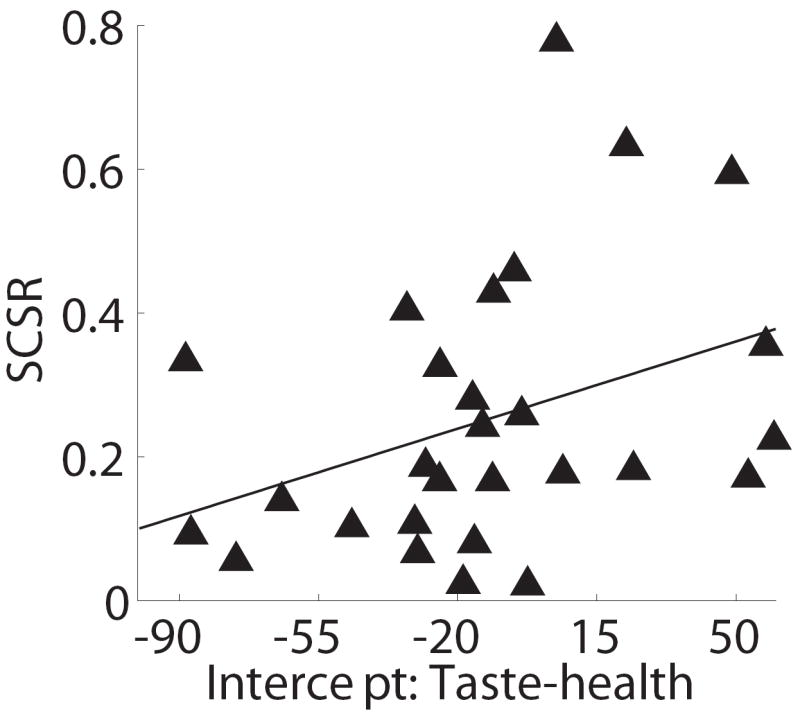
We also carried out an additional analysis to rule out a potential confound in these results. To understand the concern, suppose that health and taste begin to influence the true data generation process at the same instant, but that on average the weight given to taste in the instantaneous value signal being integrated is larger than the average weight given to health. In this case, if the noise associated with both signals is sufficiently similar, a test based on significance time will identify an earlier entrance for taste than health based purely on the ratio of the weight to the noise, and may falsely overestimate the difference in significant times. Furthermore, this potential bias would be correlated with the relative “true” weights of health and taste, and thus with the SSCR measure, which could lead to a spurious correlation. Figure 6 depicts the results of an analysis designed to control for this problem. For every subject and for every percentile value p between 10% and 90% we use the previous regression results to identify the time at which each of the attributes reaches and never drops below p% of its final magnitude. This leads to the plot in Fig. 6A, which depicts the speed at which health and taste reach different thresholds. We then fit a cubic polynomial to the estimates of each subject, separately for health and taste, and interpolate its value to the y-axis, which provides a measure of the earliest time at which each of the attributes begins and continues to influence the mouse trajectories. Note that this measure is free from the confound described above, and is fairly robust to noise. As shown in Figure 6B, we find that the differences in earliest significant time identified with the previous analysis are highly correlated with those identified with this new method (R2=0.51, p=0.006). Likewise, the alternative measure of the relative earliest times can still significantly predict a sizable fraction of the individual differences in self-control (Fig. 6C; R2=0.13, p=0.059).
Figure 6.
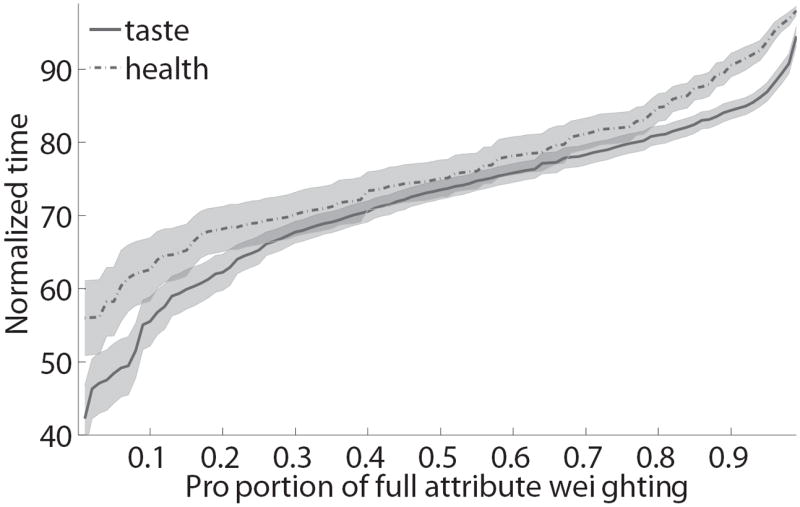
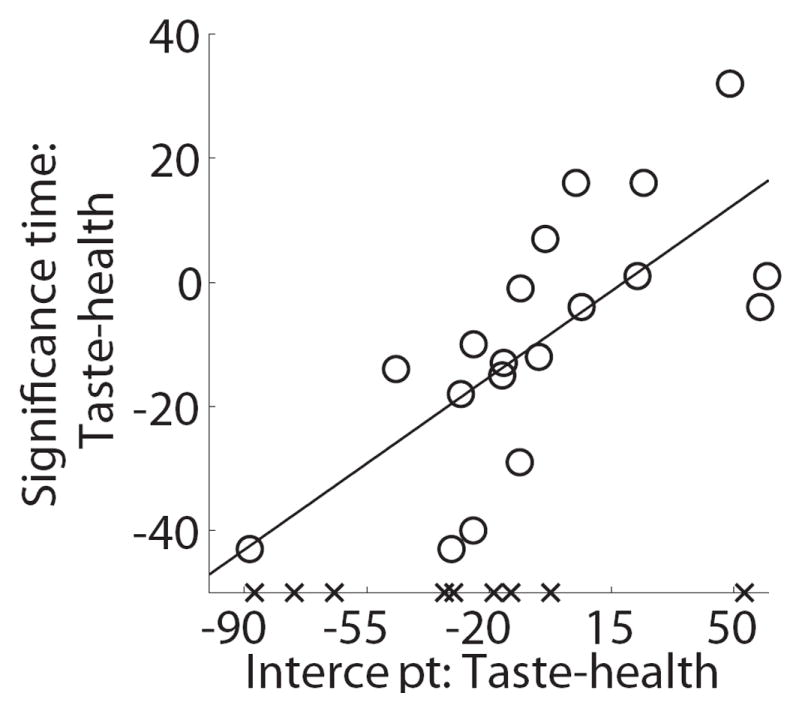
Control analysis. A) Estimated normalized time at which each attribute’s weighting on cursor trajectory had accumulated a percent of its final value. Error bands denote standard errors. B) Cross-subject scatter plot showing of the relationship between the two measures of the time advantage of taste over health attributes. Crosses indicate subjects for whom health did not have a significant effect on trajectories before the end of the trial. C) Cross-subject scatter plot showing the correlation between of self-control success ratios and the intercept-based measure of the time advantage for taste.
Together, these results suggest that a sizable fraction of individual differences in dietary self-control, on the order of 13-39%, might be attributable to differences in the relative speed at which the health and taste attributes are processed by the choice circuitry.
Relationship between relative computation time and attribute decision weights
The previous results suggest that the relative speed at which health and taste are computed is related to the ability to exercise dietary self-control. We conclude our analyses by carrying out a post hoc analysis to investigate further the nature of the relationship. This was done in two steps. First, Figure 7A depicts the extent to which differences in SCSRs are related to differences in the weights given to the taste and health attributes in the final decision. The plot was constructed as follows. For every subject we computed a logistic regression of the probability of choosing the right item against relative taste (tasteR − tasteL) and relative health (healthR − healthL). This provided individual estimates of the weights that each attribute received on the final decision. We then plotted the individual estimates against the SCSR, and for each type of attribute we carried out a linear regression of the SCSR measure against the individual estimates. Both attributes were highly significant and, on their own, explained a sizable fraction of the individual differences in self-control (health: p=0.0004, R2=0.39; taste: p=0.0004, R2=0.38).
Figure 7.
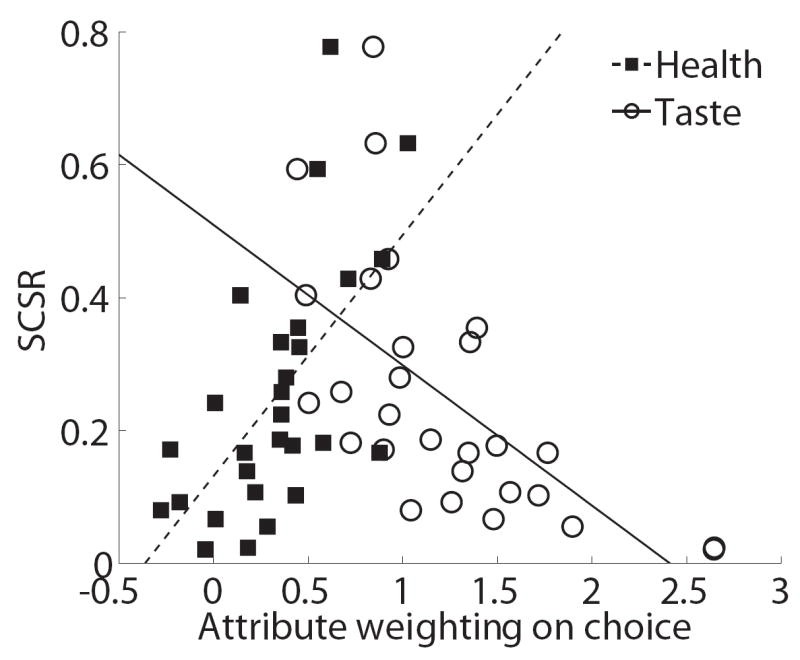
Relationship between final decision weights and speed of computation. A) Plot of the individual self-control success ratios versus the individual final decision weights for the health and taste attributes. Lines denote best linear fits for the regressions of SCSRs on each of the attribute weights, separately. B) Plot of relative final decision weights versus the “computational advantage” of taste, as measured by the earliest time at which taste significantly affects the trajectory minus the earliest time at which health does.
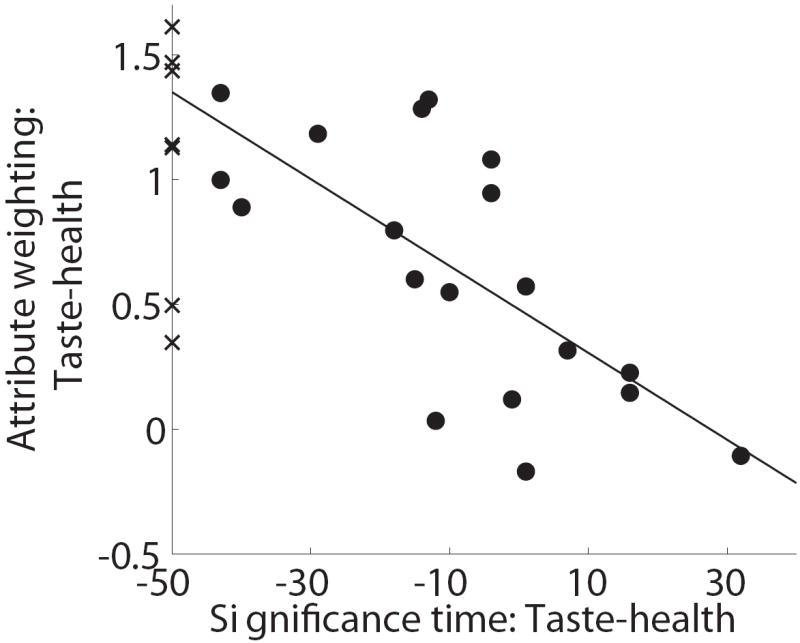
Second, we hypothesized that the final decision weights for taste and health are influenced by the speed with which the attributes were computed. This hypothesis is based on the idea that the earlier an attribute starts influencing the choice process, the longer it is integrated and thus the stronger its effect on the final choice. This hypothesis is consistent with the type of integrator decision models described in the Introduction. To test this hypothesis, we regressed the individual estimates of the final relative decision weight of health minus taste on the “computational advantage” of taste, as defined in the previous section. As shown in Figure 7B, we found that the two variables had a significant and sizable relation (slope = -0.02, p=0.001, R2=0.487).
Given these results, we also hypothesized post-hoc that the main mechanism through which the speed of attribute processing influences SCSR is by modulating the weight assigned to each attribute in the final choice. To test this hypothesis, we carried out a mediation analysis. The goal of mediation analysis (e.g., Baron and Kenny, 1986) is to identify the mechanism underlying the relationship between two variables through the inclusion of a third “mediator” variable. Using this method, we found that the final weight of taste was a significant mediator of taste’s time-to-significance, reducing path strength by 79.14%, and making taste’s time-to-significance not-significant for predicting SCSR (p=0.60). This was also true for the health coefficient, reducing path strength by 88.26%, and also making health’s time-to-significance non-significant for predicting SCSR (p=0.75). See Figure S2 for details.
Together, these results suggest that attributes that are computed earlier have a stronger weight in the final decision, likely by increasing the amount of time during which they are integrated into the decision. In particular, this suggests that initial delays in the computation of an attribute are not made up later on during the choice process, for example by a heavier weighting closer to the time of decision.
DISCUSSION
In this study we propose that dietary self-control failures can be traced back to relative differences in the speed with which the decision-making circuitry processes basic attributes like taste, versus more abstract attributes such as health. We find evidence that, on average, taste attributes are processed about 195 ms earlier than health attributes during the choice process. We also find that individual differences in dietary self-control are related to differences in the relative speed with which taste and health attributes are processed. In particular, we find that self-control decreases with increasing lag between the onset of taste and health information processing.
Since several alternative mechanisms are likely to be at work in dietary self-control (Baumeister & Vohs, 2004; Beaver et al., 2006; Hare et al., 2009; Harris, Hare, & Rangel, 2013; Hutcherson, Plassmann, Gross, & Rangel, 2012; Ikeda et al., 2010; Loewenstein, 1996; Muraven & Baumeister, 2000), we were surprised to find that between 13% and 39% of observed individual differences in self-control ability could be explained by differences in the relative speed with which taste and health attributes are processed. By comparison, previous studies have found that personality traits such as impulsivity or I.Q. can only explain, respectively, around 13% and 5% of individual differences in self-control (de Wit, Flory, Acheson, McCloskey, & Manuck, 2007; Mitchell, 1999; Shamosh & Gray, 2008; Steinberg et al., 2009).
Our results are consistent with basic ideas from a wide class of integrator models of decision making, including Decision Field Theory (Busemeyer & Townsend, 1993), the Drift-Diffusion Model (Ratcliff & McKoon, 2008), and the Leaky Competing Accumulator Model (Usher & McClelland, 2001). Despite technical differences, in all of these models decisions are made by dynamically integrating information for and against the different options (Bogacz, 2007; Rangel & Clithero, 2013). At every instant during the choice process, the decision circuitry receives instantaneous information about the attributes associated with each stimulus under consideration, and integrates them into a dynamic value signal that measures the relative value of the two options. A decision is made when the relative value signal becomes sufficiently large or sufficiently small. These models are an important benchmark for understanding self-control because they have been shown to account, with high quantitative accuracy, for psychometric choice data. Importantly, they predict that the earlier an attribute is processed, the longer it is integrated into the relative value measure, and thus the larger the weight that the attribute receives in the final decision. Thus, these models provide computational foundations for our findings.
Our study borrows heavily from the pioneering mouse-tracking literature, which has been used to study intertemporal choice (Dshemuchadse et al., 2013), visual search (Song & Nakayama, 2008), stereotyping (Freeman & Ambady, 2009), and psycholinguistics (Spivey et al., 2005). However, we use the mouse-tracking data in a different way. In particular, whereas most mouse-tracking papers focus on comparisons between the average paths generated by various experimental conditions, here we use regression analyses to identify the time at which different stimulus attributes begin influencing choice. (See Dshemuchadse et al., 2013; Scherbaum, Dshemuchadse, Fischer, & Goschke, 2010; Scherbaum, Dshemuchadse, Leiberg, & Goschke, 2013 for related uses of mouse-tracking data.)
Our study also suggests a potential mechanism by which the difficulty and abstractness of attributes may influence the choice process (Liberman & Trope, 2008). Rather than simply resulting in a weaker representation of attributes like health, as is sometimes assumed, the abstractness of attributes might also affect the speed with which they are processed. One limitation of our study is that we cannot disentangle the influence that processing difficulty and processing speed have in self-control. In fact, it is possible that in some contexts both effects might be correlated. Future work will be needed to tease apart the relative roles of these two mechanisms.
Several implications of these findings merit future investigation. First, these data suggest that slowing down decisions, even if only by adding a waiting period before choice, might increase the relative influence of abstract attributes like health on final choice. To see why, note that at longer decision times, there is a decrease in the fraction of time during which only the taste attribute is computed. Indeed, there is already a literature suggesting the influence of time pressure on choice (e.g. Reutskaja, Nagel, Camerer, & Rangel, 2011; Suter & Hertwig, 2011). Second, our results suggest that self-control could be improved by interventions that increase the relative speed with which health information is processed. Consistent with this, a previous study showed that simply cuing subjects to pay attention to health can improve dietary self-control (Hare, Malmaud, & Rangel, 2011). Third, these findings provide a rationale for regulating marketing practices that increase the relative ease with which abstract attributes such as health are processed. For example, prominently displaying health information such as calorie counts may allow more rapid integration of health attributes. Fourth, they provide a potential mechanism through which differences in cognitive abilities might affect self-control. For example, it might be the case that individuals with higher I.Q. are relatively faster at processing abstract attributes, such as health, which increases their self-control. Fifth, the relative speed of attribute processing might also play a role in other types of decisions in which basic and abstract information need to be combined. Potential examples include altruism, where information about the self might be calculated faster than information about others, and any decision involving discounting, where information about immediate rewards might be processed earlier than information about future rewards.
Supplementary Material
Acknowledgments
Financial support from NSF (AR, AR3.SELFCNTRL-1-NSF.ARR1), NSF-IGERT (NS), NIA (NS, AR, R21-AG038866-01), and the Lipper Foundation is gratefully acknowledged.
References
- Ashby FG. A biased random walk model for two choice reaction times. Journal of Mathematical Psychology. 1983;27(3):277–297. [Google Scholar]
- Baumeister RF, Vohs KD, editors. Handbook of Self-Regulation: Research, Theory, and Applications. New York: Guilford Press; 2004. [Google Scholar]
- Beaver JD, Lawrence AD, van Ditzhuijzen J, Davis MH, Woods A, Calder AJ. Individual differences in reward drive predict neural responses to images of food. J Neurosci. 2006;26(19):5160–5166. doi: 10.1523/JNEUROSCI.0350-06.2006. [DOI] [PMC free article] [PubMed] [Google Scholar]
- Bogacz R. Optimal decision-making theories: linking neurobiology with behaviour. Trends in Cognitive Sciences. 2007;11(3):118–125. doi: 10.1016/j.tics.2006.12.006. [DOI] [PubMed] [Google Scholar]
- Brainard DH. The Psychophysics Toolbox. Spat Vis. 1997;10(4):433–436. [PubMed] [Google Scholar]
- Busemeyer JR, Townsend JT. Decision field theory: a dynamic-cognitive approach to decision making in an uncertain environment. Psychol Rev. 1993;100(3):432–459. doi: 10.1037/0033-295x.100.3.432. [DOI] [PubMed] [Google Scholar]
- Dale R, Kehoe C, Spivey MJ. Graded motor responses in the time course of categorizing atypical exemplars. Mem Cognit. 2007;35(1):15–28. doi: 10.3758/bf03195938. [DOI] [PubMed] [Google Scholar]
- de Wit H, Flory JD, Acheson A, McCloskey M, Manuck SB. IQ and nonplanning impulsivity are independently associated with delay discounting in middle-aged adults. Personality and Individual Differences. 2007;42(1):111–121. [Google Scholar]
- Dshemuchadse M, Scherbaum S, Goschke T. How decisions emerge: action dynamics in intertemporal decision making. J Exp Psychol Gen. 2013;142(1):93–100. doi: 10.1037/a0028499. [DOI] [PubMed] [Google Scholar]
- Freeman JB, Ambady N. Motions of the hand expose the partial and parallel activation of stereotypes. Psychol Sci. 2009;20(10):1183–1188. doi: 10.1111/j.1467-9280.2009.02422.x. [DOI] [PubMed] [Google Scholar]
- Freeman JB, Ambady N, Rule NO, Johnson KL. Will a category cue attract you? Motor output reveals dynamic competition across person construal. J Exp Psychol Gen. 2008;137(4):673–690. doi: 10.1037/a0013875. [DOI] [PubMed] [Google Scholar]
- Hare TA, Camerer CF, Rangel A. Self-Control in Decision-Making Involves Modulation of the vmPFC Valuation System. Science. 2009;324(5927):646–648. doi: 10.1126/science.1168450. [DOI] [PubMed] [Google Scholar]
- Hare TA, Malmaud J, Rangel A. Focusing attention on the health aspects of foods changes value signals in vmPFC and improves dietary choice. J Neurosci. 2011;31(30):11077–11087. doi: 10.1523/JNEUROSCI.6383-10.2011. [DOI] [PMC free article] [PubMed] [Google Scholar]
- Harris A, Hare T, Rangel A. Temporally Dissociable Mechanisms of Self-Control: Early Attentional Filtering Versus Late Value Modulation. The Journal of Neuroscience. 2013;33(48):18917–18931. doi: 10.1523/JNEUROSCI.5816-12.2013. [DOI] [PMC free article] [PubMed] [Google Scholar]
- Hutcherson C, Plassmann H, Gross JJ, Rangel A. Cognitive regulation during decision-making shifts behavioral control between ventromedial and dorsolateral prefrontal value systems. Journal of Neuroscience. 2012 doi: 10.1523/JNEUROSCI.6387-11.2012. in press. [DOI] [PMC free article] [PubMed] [Google Scholar]
- Ikeda S, Kang M-I, Ohtake F. Hyperbolic discounting, the sign effect, and the body mass index. Journal of Health Economics. 2010;29(2):268–284. doi: 10.1016/j.jhealeco.2010.01.002. [DOI] [PubMed] [Google Scholar]
- Laibson D. Golden Eggs and Hyperbolic Discounting. The Quarterly Journal of Economics. 1997;112(2):443–478. [Google Scholar]
- Liberman N, Trope Y. The Psychology of Transcending the Here and Now. Science. 2008;322(5905):1201–1205. doi: 10.1126/science.1161958. [DOI] [PMC free article] [PubMed] [Google Scholar]
- Loewenstein G. Out of Control: Visceral Influences on Behavior. Organizational Behavior and Human Decision Processes. 1996;65(3):272–292. [Google Scholar]
- Luce RD. Response Times: Their Role in Inferring Elementary Mental Organization. Oxford: Oxford University Press; 1986. [Google Scholar]
- McKinstry C, Dale R, Spivey MJ. Action Dynamics Reveal Parallel Competition in Decision Making. Psychological Science. 2008;19(1):22–24. doi: 10.1111/j.1467-9280.2008.02041.x. [DOI] [PubMed] [Google Scholar]
- Milosavljevic M, Malmaud J, Huth A, Koch C, Rangel A. The Drift Diffusion Model can account for the accuracy and reaction time of value-based choices under high and low time pressure. Judgment and Decision Making. 2010;5(6):437–449. [Google Scholar]
- Mitchell SH. Measures of impulsivity in cigarette smokers and non-smokers. Psychopharmacology (Berl) 1999;146(4):455–464. doi: 10.1007/pl00005491. [DOI] [PubMed] [Google Scholar]
- Muraven M, Baumeister RF. Self-regulation and depletion of limited resources: does self-control resemble a muscle? Psychol Bull. 2000;126(2):247–259. doi: 10.1037/0033-2909.126.2.247. [DOI] [PubMed] [Google Scholar]
- O’Donoghue T, Rabin M. Doing It Now or Later. The American Economic Review. 1999;89(1):103–124. [Google Scholar]
- Rangel A. Regulation of dietary-choice by the decision-making circuitry. Nature Neuroscience. 2013 doi: 10.1038/nn.3561. [DOI] [PMC free article] [PubMed] [Google Scholar]
- Rangel A, Clithero J. The computation of stimulus values in simple choice. In: Glimcher PW, Fehr E, editors. Neuroeconomics: Decision Making and the Brain. Second. London: Academic Press; 2013. [Google Scholar]
- Ratcliff R, McKoon G. The diffusion decision model: theory and data for two-choice decision tasks. Neural Comput. 2008;20(4):873–922. doi: 10.1162/neco.2008.12-06-420. [DOI] [PMC free article] [PubMed] [Google Scholar]
- Ratcliff R, Rouder JN. Modeling Response Times for Two-Choice Decisions. Psychological Science. 1998;9(5):347–356. [Google Scholar]
- Reutskaja E, Nagel R, Camerer CF, Rangel A. Search Dynamics in Consumer Choice under Time Pressure: An Eye-Tracking Study. American Economic Review. 2011;101(2):900–926. [Google Scholar]
- Rolls ET, Grabenhorst F, Deco G. Choice, difficulty, and confidence in the brain. NeuroImage. 2010;53(2):694–706. doi: 10.1016/j.neuroimage.2010.06.073. [DOI] [PubMed] [Google Scholar]
- Scherbaum S, Dshemuchadse M, Fischer R, Goschke T. How decisions evolve: the temporal dynamics of action selection. Cognition. 2010;115(3):407–416. doi: 10.1016/j.cognition.2010.02.004. [DOI] [PubMed] [Google Scholar]
- Scherbaum S, Dshemuchadse M, Goschke T. Building a bridge into the future: Dynamic connectionist modeling as an integrative tool for research on intertemporal choice. Frontiers in Psychology. 2012;3 doi: 10.3389/fpsyg.2012.00514. [DOI] [PMC free article] [PubMed] [Google Scholar]
- Scherbaum S, Dshemuchadse M, Leiberg S, Goschke T. Harder than Expected: Increased Conflict in Clearly Disadvantageous Delayed Choices in a Computer Game. PLoS ONE. 2013;8(11):e79310. doi: 10.1371/journal.pone.0079310. [DOI] [PMC free article] [PubMed] [Google Scholar]
- Shamosh NA, Gray JR. Delay discounting and intelligence: A meta-analysis. Intelligence. 2008;36(4):289–305. [Google Scholar]
- Song J-H, Nakayama K. Target selection in visual search as revealed by movement trajectories. Vision Research. 2008;48(7):853–861. doi: 10.1016/j.visres.2007.12.015. [DOI] [PubMed] [Google Scholar]
- Spivey MJ, Grosjean M, Knoblich G. Continuous attraction toward phonological competitors. Proc Natl Acad Sci U S A. 2005;102(29):10393–10398. doi: 10.1073/pnas.0503903102. [DOI] [PMC free article] [PubMed] [Google Scholar]
- Steinberg L, Graham S, O’Brien L, Woolard J, Cauffman E, Banich M. Age differences in future orientation and delay discounting. Child Dev. 2009;80(1):28–44. doi: 10.1111/j.1467-8624.2008.01244.x. [DOI] [PubMed] [Google Scholar]
- Suter RS, Hertwig R. Time and moral judgment. Cognition. 2011;119(3):454–458. doi: 10.1016/j.cognition.2011.01.018. [DOI] [PubMed] [Google Scholar]
- Usher M, McClelland JL. The time course of perceptual choice: the leaky, competing accumulator model. Psychol Rev. 2001;108(3):550–592. doi: 10.1037/0033-295x.108.3.550. [DOI] [PubMed] [Google Scholar]
Associated Data
This section collects any data citations, data availability statements, or supplementary materials included in this article.