

Abstract
We employ a single-country dynamically-recursive Computable General Equilibrium model to make health-focussed macroeconomic assessments of three contingent UK Greenhouse Gas (GHG) mitigation strategies, designed to achieve 2030 emission targets as suggested by the UK Committee on Climate Change. In contrast to previous assessment studies, our main focus is on health co-benefits additional to those from reduced local air pollution. We employ a conservative cost-effectiveness methodology with a zero net cost threshold. Our urban transport strategy (with cleaner vehicles and increased active travel) brings important health co-benefits and is likely to be strongly cost-effective; our food and agriculture strategy (based on abatement technologies and reduction in livestock production) brings worthwhile health co-benefits, but is unlikely to eliminate net costs unless new technological measures are included; our household energy efficiency strategy is likely to breakeven only over the long term after the investment programme has ceased (beyond our 20 year time horizon). We conclude that UK policy makers will, most likely, have to adopt elements which involve initial net societal costs in order to achieve future emission targets and longer-term benefits from GHG reduction. Cost-effectiveness of GHG strategies is likely to require technological mitigation interventions and/or demand-constraining interventions with important health co-benefits and other efficiency-enhancing policies that promote internalization of externalities. Health co-benefits can play a crucial role in bringing down net costs, but our results also suggest the need for adopting holistic assessment methodologies which give proper consideration to welfare-improving health co-benefits with potentially negative economic repercussions (such as increased longevity).
Electronic supplementary material
The online version of this article (doi:10.1007/s10584-013-0881-6) contains supplementary material, which is available to authorized users.
Introduction
Cutting high and increasing greenhouse gas (GHG) emissions has proved an elusive goal on the international political agenda since the first Assessment Report of the Intergovernmental Panel on Climate Change (IPCC 1990).1 The most recent IPCC report found a high likelihood of a range of serious impacts at global mean temperature increases above 2 °C (IPCC 2007). This is likely to happen since future temperature rises will, most likely, fall within the interval of 2.0–4.5 °C over the course of this century (Roe and Baker 2007). Hence, there is a need for immediate global action. The need for global action is underlined by recent evidence suggesting that the current Copenhagen Accord commitments will be insufficient to maintain a medium (50–66 %) chance of achieving the 2 °C target (den Elzen et al. 2011), and that it will be virtually impossible to compensate in later years if actions are delayed until 2030 (den Elzen et al. 2010).
In response to the need for action, a vast inter-disciplinary literature has emerged on a range of economically-related aspects of climate change, including the costs of mitigation and adaptation, and the use of policy instruments such as carbon pricing and accelerated technological innovation (Stern 2007; Margulis and Dubeux 2011). The UK has committed itself through unilateral legislation (the 2008 Climate Change Act) to reduce GHG emissions by 80 % by 2050 relative to 1990 levels (DECC 2008). Preliminary estimates suggest that UK emissions had been reduced by around 23 % by 2010 (DECC 2012). This exceeds the formal 22 % reduction target for the first carbon budget period 2008–2012, but remains well below future targets (and some emissions have been ‘exported’ as a result of purchasing products from emerging economies such as China). A number of new UK mitigation initiatives are, therefore, needed in order to achieve the intermediate 60 % reduction target by 2030 and the final 80 % reduction target by 2050.
In this article, we use a single-country Computable General Equilibrium (CGE) model to assess sector-specific UK GHG mitigation strategies which can help to achieve the 60 % reduction target by 2030.2 It has previously been argued that some GHG mitigation interventions may result in substantial co-benefits to health (Haines et al. 2009). The current article focuses on such health-oriented strategies within three sectors: food and agriculture, urban transportation, and household energy. Existing macroeconomic CGE model studies have focused narrowly on health co-benefits of reduced local air pollution (Garbaccio et al. 2000; Li 2002; Dessus and O’Connor 2003. This article follows Haines et al. (2009) Jack and Kinney (2010) and Oppenheimer (2012) and applies an extended health co-benefits concept, which includes both health co-benefits from reduced air pollution and other health co-benefits due to, for example, a switch from urban car travel to physically active travel modes. We demonstrate that accounting for these additional health co-benefits within a holistic model approach has important policy implications.
We employ a conservative cost-effectiveness methodology with a zero net cost threshold. Previous macroeconomic cost-benefit studies have been criticized for assuming a trade-off between global warming mitigation initiatives and economic activity (van den Bergh 2010). In particular, they are criticized for putting monetary values on the benefits of GHG emission reductions, since the decision to avoid irreversible climate change should not rest on a trade-off between costs and potential economic benefits. We agree with this argument. Our analyses therefore focus, explicitly, on the cost-side, i.e. on the assessment of net costs (net of co-benefits) of achieving a given reduction in GHG emissions, without imposing a value on GHG emissions.
Four previously established UK household-level GHG mitigation scenarios with important health co-benefits are analysed: (1) one food and agriculture strategy scenario: ‘healthy diet’ (Friel et al. 2009); (2) two urban transport strategy scenarios: ‘cleaner cars’ and ‘active travel’ (Woodcock et al. 2009); and (3) one household energy efficiency strategy scenario: ‘household energy’ (Wilkinson et al. 2009).3 Based on measures of health co-benefits from the aforementioned studies, we derive dynamic sequences of health-related economic shocks (on labour supply, demographic composition, healthcare costs, and social security transfers) for a range of health outcomes, and use a dynamically-recursive CGE model to measure the health-related net cost reductions for our four GHG scenarios.
The rest of the article is structured as follows: Section 2 provides background information and reviews the existing literature; Section 3 presents the macroeconomic methodology for our analyses and discusses the measurement of health-related shocks; Section 4 presents the emission reduction scenarios; Section 5 presents the main results; and Section 6 presents the conclusions.
Background
In our view, selection of the most cost-effective and welfare-enhancing GHG emission mitigation initiatives should involve a holistic approach based on consideration of three decision-criteria: (1) achievement of the required overall target reduction, (2) inclusion of the most cost-effective initiatives (in terms of society income and material welfare), and (3) inclusion of initiatives which enhance human welfare the most (above and beyond material welfare from goods and services with well-established prices e.g. through increased longevity). As demonstrated in this article, there may be a trade-off between decision criteria 2 and 3. Such a trade-off is based on the presumption that there are elements of human welfare which cannot be properly quantified in economic terms—similar to the concepts underlying the Human Development Index (Anand and Sen 1994). This article focuses narrowly on measuring cost-effectiveness, but presents additional evidence on health indicators.
Previous single-country CGE model studies that incorporate health co-benefits have focused narrowly on health effects of changes in local air pollution due to demand-constraining carbon tax interventions (Garbaccio et al. 2000; Li 2002; Dessus and O’Connor 2003). Two of the single-country studies characterize health outcomes in terms of disease symptoms and evaluate them based on willingness-to-pay estimates (Garbaccio et al. 2000; Dessus and O’Connor 2003). A different approach was adopted by Li (2002), who measured the impact of morbidity and mortality effects on (1) labour supplies and (2) health-system costs, and evaluated the impact of these shocks within a CGE model. Our article relies on a similar approach, but imposes an extended set of morbidity and mortality impacts (on labour supply, demographic composition, health-system costs, and social security costs) for an extended range of diseases and injuries.
While the existing literature focuses narrowly on health co-benefits from reduced air pollution, the current article applies an extended health co-benefits concept (Haines et al. 2009; Jack and Kinney 2010; Oppenheimer 2012) which includes health co-benefits from reduced air pollution (for example, due to reduced fine particulate air pollution as a result of switching to low emission motorised vehicles) and health co-benefits which are additional to those from air pollution (for example, due to increased physical activity associated with a switch in transport mode from motorised vehicles to walking and cycling).4
The current article also includes both demand-constraining and technological mitigation interventions. Demand-constraining interventions lower GHG emissions through reduced demand (and production) of pollution-intensive goods and services without the introduction of new technologies. These interventions are typically implemented through the use of tax instruments (e.g. through a carbon tax) or, alternatively, through outright regulatory constraints. In either case, they create distortions which are costly to society, but they may also serve to internalize externalities and thereby lower costs to society. In contrast, technological interventions reduce GHG emissions and increase economic efficiency through the introduction of new technologies. Such interventions may require increased investment outlays, something which may lower (or reverse) the positive economic impact of their efficiency gains.
Database and simulation model5
Macroeconomic CGE model
Our economy-wide dynamically-recursive Computable General Equilibrium (CGE) model is based on the ‘IFPRI standard model’. This is a well-known and widely applied comparative static, single country, open economy, multi-sector CGE model, which is based on the fundamental axioms of profit-maximization among producers and utility maximization among households. Our UK CGE model was calibrated on the basis of a 2004 social accounting matrix. The standard model specification was expanded to account for household production of transport services and heating services and a set of factor updating equations was added to turn our static model into a dynamically-recursive model. A standard neo-classical model closure with flexible prices was used in all simulations.
Assessment methodology
Two types of assessment method were applied to evaluate the net cost of policy scenarios: (1) a standard methodology, and (2) a breakeven methodology. The standard methodology is based on standard factor accumulation and a simple comparison of policy simulations to the counterfactual growth path. Cost-effectiveness is achieved when the Net Present Value (NPV) of costs is less than co-benefits: NPV(costs) < NPV(co-benefits). In contrast, the breakeven methodology calculates the maximum (time-invariant) investment costs, which can be extracted from the UK economy and still remain consistent with an unchanged NPV of GDP over our 20 year time horizon (2011–2030). The breakeven methodology is targeted at policy scenarios with an investment element where there is uncertainty about the size of the future investment intervention but a good understanding of co-benefits. The breakeven investment cost is calculated as NPV(investment extraction) conditional on an unchanged NPV(GDP). All NPV calculations use a 3.5 % nominal discount rate (0.6 % real discount rate). The nominal discount rate was chosen to mirror low current yields on 20 year UK treasury bonds (2011: 2.9 %–4.1 % p.a.) (See annex A.3).
Health effects
For each scenario, age- and gender-specific calculations of disease burdens in terms of Years Lost due to Disability (YLD) and Years of Life Lost (YLL) were used to calculate implied changes to UK demographic composition, UK labour supplies, UK healthcare costs, and UK social security transfers for a range of illnesses. Gender and age-specific health effects (YLD/YLL) were determined by WHOs Comparative Risk Assessment (CRA) approach (see Woodcock et al. 2009; Friel et al. 2009; Wilkinson et al. 2009), and distributed over a 20 year time horizon assuming cause-specific time lags between exposure change and health effects (see Smith et al. 2013). The resulting dynamic patterns of health effects were used to derive (1) changes in demographic composition and effective labour force and (2) changes in social security transfers including reduced labour market benefits for working-age people and increased pension payments for pensioners with increased longevity. Furthermore, changes in disease burdens were used to measure changes in healthcare costs. (See Jarrett et al. 2012 and Smith et al. 2013 for details on the methodology).
Policy scenarios6
Details on the four policy scenarios underlying our three sector-specific UK GHG strategies are presented in the Box below. The household energy scenario was designed to achieve a UK-wide 50 % emission reduction target for the housing sector in 2030, while the two transport scenarios (active travel and cleaner cars) were designed to achieve a combined 60 % emission reduction for intra-urban transport for England and Wales. In contrast, the healthy diet scenario is only one among several elements of the overall strategy to achieve a 50 % emission reduction target for the UK food and agriculture sector.
Box. Policy Scenarios
| Healthy Diet | Active Travel | Household Energy | Cleaner Cars | |
| Description | Reduced meat and dairy consumption will improve UK health and lower UK livestock production and GHG emissions from ruminants. | A switch from car travel to active travel (walking and cycling) in urban areas will improve UK health and lower UK fossil fuel-based transport and associated GHG emissions. | Improved insulation and ventilation of the housing stock will improve indoor climate and thereby UK health and improve efficiency of fossil-fuel based heating and thereby lower GHG emissions. | A switch to more a more fuel-efficient car stock will improve UK health |
| Emission Targets | The healthy diet scenario was designed to achieve a 50 % emission reduction target for UK agricultural activities in 2030. The scenario builds on efficiency-improvements which are in the pipeline (not modelled). | The active travel scenario was designed to achieve a 38 % reduction in GHG emissions from the urban transport sector (with the cleaner cars scenario, this was designed to achieve a combined 60 % emission reduction target in urban areas in England and Wales in 2030.) | The household energy scenario was designed to achieve a 50 % emission reduction target for UK dwellings in 2030 | The cleaner cars scenario was designed to achieve an additional 35 % reduction in GHG emissions from the general transport sector (with the active travel scenario, this achieves a combined 60 % emission reduction target in urban areas in England and Wales in 2030). |
| Policy Targets (Demand-constraining) | 30 % reduction in household consumption of meat and dairy. | 41 % reduction in urban fossil-fuel based private transport in England and Wales. Implemented as a 15.6 % UK-wide reduction in private transport. | ||
| Policy Targets (Efficiency-enhancing) | Dynamic growth path of efficiency-gains in household heating (derived from UK CCC estimates) | 38 % UK-wide fuel-efficiency improvement for private cars | ||
| Economic Instruments (Tax) | Food Tax | Road Pricing Tax | ||
| Economic Instruments (Other) | Investment in household insulation and ventilation (derived from UK CCC estimates) | Investment in fuel-efficient cars (not fully specified) | ||
| Assessment Methodology | Standard | Standard | Standard and Breakeven | Breakeven |
| Temporal Implementation | Instantaneous | Instantaneous | Gradual | Gradual |
| (instantaneous efficiency gains from congestion externality) | (gradually increasing efficiency gains from energy model) | (linear increase in efficiency gains) | ||
| Externalities (Health) | Improved diets with reduced intakes of saturated fats and cholesterol leads to reduced disease burdens of ischaemic heart disease and stroke. | Increased physical activity leads to reduced disease burdens of diabetes, Alzheimers disease, hypertensive heart disease, ischaemic heart disease, cerebrovascular disease, breast cancer, colorectal cancer, and depression. Increased walking and cycling also leads to increased traffic-related injuries: Short- and long-term intracranial injuries, and spinal cord injuries. | Improved indoor temperatures and reduced particulate concentrations lead to reduced disease burdens of cardiovascular disease, depression, cardiopulmonary disease and lung cancers. Improved insulation also leads to health harms such as lung cancers (indoor radon concentrations), asthma (mould growth), and cerebrovascular disease and ischaemic heart disease (indoor concentrations of environmental tobacco smoke). | A new car pool with lower-carbon-emission motor vehicles reduces local air pollution in urban centres and thereby lowers disease burdens and, in some cases, premature deaths due to trachea, bronchus and lung cancers, hypertensive heart disease, ischaemic heart disease, cerebrovascular disease, inflammatory heart diseases, chronic obstructive pulmonary disease, asthma and other respiratory diseases. |
| Externalities (Other) | 16 % urban fuel-efficiency improvement for general (private and commercial) traffic due to reduced congestion. Implemented as 6 % UK-wide fuel-efficiency improvement for general traffic. | |||
| Note: See Annex B for more details on the scenario specifications. | ||||
Two scenarios reduce GHG emissions through demand-constraining taxes: a food tax on meat and dairy products (healthy diet) and a road pricing tax on urban transportation (active travel). The two remaining technological mitigation scenarios introduce new technologies through investment in improved housing insulation and ventilation (household energy) and fuel-efficient cars (cleaner cars), which lead to increased efficiency in household production of private transportation and heating services.
Three of our policy scenarios have well-defined economic instruments: healthy diet, active travel, and household energy. They are assessed using the standard methodology. The household energy scenario is also assessed using the breakeven methodology, since there is some uncertainty surrounding the scale of estimated efficiency improvements and required investment outlays. The cleaner cars scenario is not associated with a specific investment scheme for new fuel-efficient cars, and is therefore only evaluated using the breakeven methodology.
The temporal implementation of our four scenarios differs between (1) instantaneous implementation of tax-based scenarios and (2) gradual implementation of investment-based scenarios. Although our active travel scenario requires complementary investment in infrastructure for pedestrians and cyclists (the costs of which are assumed to be neutralized by reduced road maintenance costs), instantaneous implementation for our tax-based scenarios seems like a reasonable first approximation for illustrative purposes.
While the tax instruments are mostly applied to achieve demand-reductions, the road pricing tax serves the double purpose of (1) reducing transport demand and (2) reducing urban congestion. Hence, it leads to the internalization of a congestion externality, and thereby improves fuel-efficiency of the existing car stock. The road pricing tax is therefore a special instrument which has both distortionary and efficiency-enhancing effects on economic outcomes without introducing new technologies.
Finally, the measurement of health externalities differs between our four scenarios with (1) focus on non-air pollution health co-benefits (NA-P H-CB) in the three scenarios with well-defined economic instruments and (2) focus on local air pollution health co-benefits (LA-P H-CB) in the final cleaner cars scenario. It was decided to maintain this dichotomy in order to keep a focus on the significance of NA-P H-CB, but also to investigate the relative (lack of) of LA-P H-CB in the cleaner cars scenario (which is likely to be a pointer for all our scenarios).
Results
Standard assessment analyses of the three scenarios with well-defined economic instruments and focus on NA-P H-CB are reported in Section 5.1, while breakeven assessments of the two investment-based scenarios are reported in Section 5.2. Health-related shock values are given in Table 1 and imposed on the CGE model (together with efficiency gains, investment costs, and required demand constraints, see the Box above) to derive results for our analyses.
Table 1.
Health-related Shocks (million £; NPV in 2010 prices)
| Individual Scenarios | ||||
|---|---|---|---|---|
| Healthy Diet | Active Travel | Cleaner Cars | Household Energy | |
| 1. Public Budget Net Savings a | 2,435 | 15,010 | 18 | −37 |
| 1a. Social Security Net Savingsa | −716.4 | −911.6 | −60.6 | −80.4 |
| Social Security Savings (labour force) | 11.8 | 123.5 | 4.1 | 17.6 |
| + Social Security Savings (dependents) | −728.2 | −1,035.1 | −64.7 | −98.1 |
| 1b. Healthcare Costs Averteda | 3,151.9 | 15,921.8 | 78.5 | 43.0 |
| 2. Total Labour Force Change b | 48,948 | 95,174 | 5,420 | 10,375 |
| 3. Total Population Change b | 184,669 | 256,229 | 16,708 | 24,238 |
| 4. YLD (accumulated years)b | 12,014 | 110,906 | 4,338.2 | 8,867 |
| 4a Working age change | 4,554 | 49,083 | 1,605.3 | 6,927 |
| 2a Labour force change | 3,322 | 35,204 | 1,163.3 | 4,938 |
| 4b Dependents change | 7,460 | 61,823 | 2,732.9 | 1,940 |
| 5. YLL (accumulated years)b | 184,669 | 256,229 | 16,708.1 | 24,238 |
| 5a Working age change | 62,635 | 83,106 | 5,855.4 | 7,544 |
| 2b Labour force change | 45,626 | 59,970 | 4,257.0 | 5,436 |
| 5b Dependents change | 122,033 | 173,122 | 10,852.7 | 16,694 |
Indicators are linked as follows 1 = 1a + 1b; 2 = 2a + 2b; 3 = 5 = 5a + 5b; 4 = 4a + 4b
NB: aNet Present Value over 2011–2030 (million £); bAccumulated years over 2011–2030 without discounting
Standard assessments
The economic impact of NA-P H-CB is analysed in the first sub-section, while wider macroeconomic impacts are analysed in the second sub-section. Results are presented in Table 2.
Table 2.
Standard Assessment (£ million/£ per capita; NPV in 2010 prices)
| Individual Scenarios | ||||
|---|---|---|---|---|
| Healthy Diet | Active Travel | Household Energy | ||
| Macro Effects | ΔGDP (2011–2030) total effect a | −95,861 | −169 | −24,601 |
| ΔGDP (2011–2030) decomposition (marginal effects) a,e | −95,778 | 15,533 | −24,575 | |
| - Tax distortions | −100,437 | −49,044 | ||
| - Internalization of externalities | 45,723 | |||
| - New technologies | 24,408 | |||
| - Investment costs | −49,431 | |||
| - Health co-benefitsf | 4,659 | 18,854 | 448 | |
| ΔPer Capita GDP b | ||||
| - 2015 | −77.2 | −12.6 | 1.9 | |
| - 2020 | −78.7 | −7.6 | −20.4 | |
| - 2030 | −69.1 | 9.6 | −46.6 | |
| ΔFactor Returns (2030) c | ||||
| - Land Return | −4.55 % | −0.22 % | −0.25 % | |
| - Unskilled wages | −1.49 % | −0.97 % | −0.15 % | |
| - Skilled wages | −1.04 % | −0.64 % | −0.20 % | |
| - Capital Return | −1.28 % | −0.59 % | 0.41 % | |
| ΔTax Rates (2030) d | ||||
| - Food Tax | 25.9 % | |||
| - Road Pricing Tax | 29.1 % | |||
| - Household Income Tax | −0.64 % | −0.57 % | 0.04 % | |
| Health co-benefits | ΔGDP (2011–2030) a,f | 4,659 | 18,854 | 448 |
| ΔPer Capita GDP b,f | ||||
| - 2015 | −1.72 | 0.75 | 0.06 | |
| - 2020 | −0.57 | 7.19 | −0.04 | |
| - 2030 | 1.85 | 22.67 | −0.60 | |
NB: aNet Present Value over 2011–2030 (million £); bNet Present Value of value in 2015, 2020, and 2030 (£ per capita); cPercentage changes in 2030; dPercentage-point changes in 2030; eThe marginal effects of the individual parts of the ΔGDP decomposition were measured relative to the counterfactual. The sums of marginal effects differ from the total effects due to interaction terms. Interaction terms are particularly strong in the active travel scenario, where the 16 % efficiency gain for urban traffic (due to reduced congestion) only applies to the remaining 59 % of urban traffic volumes (after the 41 % demand reduction); fThe health co-benefits are marginal effects produced from the health-related shocks in Table 1
Economic impact of non-air pollution health co-benefits
NA-P H-CB effects, additional to those from air pollution, are particularly important for the active travel scenario. Increased physical activity, associated with increased walking and cycling, leads to significant estimated reductions in disease burdens for chronic diseases such as diabetes, Alzheimer’s disease, and depression with other notable contributions from ischaemic heart disease, cerebrovascular disease, and breast and bowel cancer. Among the health-related shocks (Table 1), the potential UK public sector deficit reduction (£15.0bn) is the net result of reduced health-system costs (£15.9bn) and higher social security transfers (£0.9bn) (increased pensions slightly outweigh reduced benefit payments to working age people). Combined with a larger effective labour force due to increased physical activity (95,000 person-years or 4,750 workers per year), this leads to an £18.9bn increase in GDP during 2011–30 (Table 2). These macroeconomic gains from NA-P H-CB are, together with efficiency gains from the internalized congestion externality, large enough to cover the gross GDP loss of the active travel scenario (See Fig. 1 below).
Fig. 1.
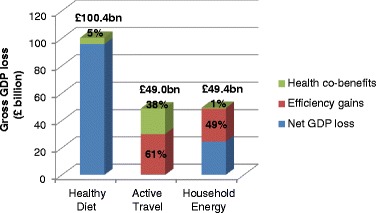
Gross GDP loss, health co-benefits and efficiency gains (£ billion; NPV in 2010 prices). Note: Numbers refer to gross GDP losses (£bn); %-terms refer to scenario-specific marginal reductions in GDP losses due to ‘health co-benefits’ and ‘efficiency gains’; The large negative interaction term for the active travel scenario (see Table 2; Note e) was balanced by a similar reduction in ‘efficiency gains’ for that scenario
NA-P H-CB are less important for the two remaining healthy diet and household energy scenarios. The largest health co-benefits come with the introduction of healthy diets, where reduced animal source saturated fat intake (with substitution by plant source polyunsaturated fatty acids) may significantly lower the disease burden of ischaemic heart disease and lead to an estimated £4.7bn increase in GDP (Table 2). The household energy scenario has smaller health co-benefits, and results in a combined £450 m GDP gain. The latter estimate is on the low side as, for example, common mental disorder (depression) attributable to alleviation of winter indoor cold, was assumed to apply for only the first season. In general, our co-benefits estimates are conservative since benefits will continue to accumulate beyond our 20 year time horizon (due to the time lag between exposure change and health impact, which may be as much as 30–40 years for lung cancer risk).
Apart from the variation in economic impacts, there are wide differences in morbidity (YLDs) and mortality (YLLs) health co-benefits across scenarios (Table 1). These alternative welfare indicators show that morbidity effects are particularly important for the active travel scenario (30 % of total Disability Adjusted Life Years (DALYs), where DALYs = YLDs + YLLs), while mortality-effects are particularly important for the healthy diet scenario (>90 % of total DALYs). This is due to differences in modelled diseases. The active travel scenario (with a focus on increased physical activity) has a particularly strong impact on chronic diseases such as diabetes, Alzheimer’s disease, and depression, while the healthy diet scenario (with a focus on reduced intakes of saturated fat and cholesterol) mainly affects diseases for which periods of disability may be relatively short lived (e.g. a myocardial infarction in the case of ischaemic heart disease).
The relatively large numbers of DALYs saved in the healthy diet (and household energy) scenarios show that macroeconomic indicators cannot stand alone. This is further underlined by the impact of health co-benefits on GDP per capita which is (1) negative in the short and medium term for healthy diet, (2) negative in the medium and long term for household energy, and (3) positive for active travel (Table 2; lower part). The negative results for the former scenarios are not surprising since they reflect substantial increases in life expectancy. The highly welfare improving survival of large groups of people into old age turns into a welfare reduction measured by GDP per capita (since it increases the denominator in the GDP per capita calculation). Hence, this points to the need for a broader and more holistic assessment approach, which properly values welfare-improving health co-benefits with potentially negative economic repercussions (such as increased longevity).
Macroeconomic impact of UK GHG scenarios
Having detailed the positive macroeconomic impacts of NA-P H-CB, we now consider the wider macroeconomic effects of our three scenarios with well-defined economic instruments. Table 2 and Fig. 1 indicate that the healthy diet scenario is likely to be the most costly to implement. The scenario relies on demand-constraining mitigation and tax distortions which raise gross UK costs above £100bn over our 20 year time horizon, or £96bn net of health co-benefits. Technological mitigation in the household energy scenario is less costly with an estimated net welfare loss of around £25bn, while the active travel scenario (with internalization of a congestion externality and substantial health co-benefits) is close to being cost-neutral. In general, we find that mitigation scenarios will probably need to include efficiency-enhancing elements (either through internalisation of externalities or through introduction of new technologies) and significant health co-benefits in order to reduce societal costs and approach cost-effectiveness.
For the healthy diet scenario, a high food tax on animal products (26 % in 2030) is required to achieve the desired reduction in consumption of meat and dairy products (Table 2).7 The large tax distortions and increasing survival of the population leads to substantial GDP per capita reductions: £77, £79 and £69 in the short, medium and long terms (Table 2). NA-P H-CB only cover 5 % of gross GDP losses (Fig. 1). The implementation of a food tax on animal products may allow the government to reduce household income tax rates by >0.6 %-points in the long term, but real household incomes are likely to be substantially reduced by lower factor returns (due to food tax distortions). National production of processed meat and dairy industries is reduced by >17 %, and lay-offs are likely to spill over into livestock and other processed food sectors (Fig. 2). At the same time, less closely related sectors such as extraction industries may benefit from reduced wages and increase production. This ‘leakage’ of carbon emissions emphasizes the need for economy-wide strategies to reduce total GHG emissions.
Fig. 2.
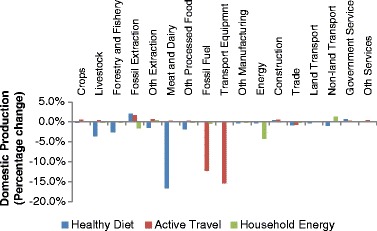
Domestic Production (Percentage change in 2030)
While the healthy diet scenario is likely to be quite costly by itself, it only represents one element of our food and agriculture strategy; the other element being the introduction of new abatement technologies such as improved efficiency of livestock farming, improved land use and manure management, and decreased dependence on fossil-fuel inputs (see annex B). Since these technological elements are not modelled, our overall GHG strategy for food and agriculture is likely to be much less costly. This is further supported by the fact that policy-induced shifts in preferences may substantially reduce societal costs by switching demand away from animal products towards consumption of high-yielding fruit and vegetable products.
In the active travel scenario, the demand-constraining intervention also creates distortions (due to the introduction of a road pricing tax). The resulting welfare loss is however balanced by the internalization of a congestion externality and by strong NA-P H-CB from increased walking and cycling. The analysis underscores that internalization of externalities and health co-benefits have the potential to balance significant societal costs of demand-constraining mitigation interventions. Overall, NA-P H-CB cover 38 % of gross GDP losses (£49bn) for the active travel scenario (Table 2; Fig. 1). NA-P H-CB therefore play a major part in eliminating net costs for the active travel scenario, and ensuring cost-effectiveness for our overall urban transport strategy (see discussion in Section 5.2).
A high road pricing tax (29 % in 2030) is required to achieve the desired reduction in urban motor vehicle transportation (Table 3). This may allow the government to reduce household income tax rates by >0.5 %-points in the long term, but tax distortions are likely to reduce factor returns and lower household income levels (similar to the food tax). The negative factor returns are reflected in declining GDP per capita over the short and medium terms: −£13 and −£8 (Table 2; upper part). However, GDP per capita becomes positive in the long term (+£10) due to rising health co-benefits (from reduced disease burdens of chronic diseases, mainly). At the sector level, reduced private transportation lowers domestic production of transport equipment and fossil fuels (Fig. 2), but re-allocation of demand again leads to leakages of GHG emissions to other production sectors.
Table 3.
Breakeven Assessment (£ million; NPV in 2010 prices)
| Individual Scenarios | ||
|---|---|---|
| Cleaner Cars | Household Energy | |
| ΔPotential Investment Costs (2011–2030) total effects a | 142,252 | 26,121 |
| ΔPotential Investment Costs (2011–2030) decomposition (marginal effects) b | 142,255 | 26,121 |
| - New technologies | 141,999 | 25,651 |
| - Health co-benefitsc | 256 | 470 |
NB: aNet Present Value over 2011–2030 (million £); bThe marginal effects of the individual parts of the Potential Investment Costs decomposition were measured relative to the counterfactual. The sums of marginal effects differ slightly from the total effects due to minor interaction terms; cThe health co-benefits are marginal effects produced from the health-related shocks in Table 1
The household energy scenario requires significant reallocation of investment to the construction sector and thereby crowds out investment which could be used productively elsewhere. By itself, crowding-out of productive investment leads to a £49bn GDP loss (Table 2). However, health co-benefits (£450 m) and energy efficiency gains (£24.4bn) cover around 50 % of gross society costs (Fig. 1). The recovery rate is expected to be much higher if account is taken of health and energy efficiency gains over the lifetime of the housing improvements, beyond 2030. Hence, the initial net costs of the UK household energy efficiency strategy will, in all likelihood, be eliminated over the very long term.8
The GDP per capita effects of the household energy scenario are initially positive (£2) as relatively cheap insulation and ventilation investment in the initial phases yields proportionally high gains in efficiency (Table 2). In addition the mental health impacts of this scenario brings immediate gains to those affected, increasing healthcare savings and productive labour supply (but by relatively small amounts). In the medium and long terms, GDP per capita effects, however, become negative (−£20 and −£47 respectively) as efficiency measures with longer repayment periods are introduced (including solid wall insulation and glazing replacement).
Sensitivity analyses9
We undertook multiple sensitivity analyses: instantaneous vs. staggered implementation, variation in discount rates, and variation in demand elasticities. The analyses indicate that GDP losses for the healthy diet scenario vary substantially with staggered policy implementation (−55 %), discount rates (up to −28 %), and demand elasticities (up to +38 %). Similarly, GDP losses for the household energy scenario vary substantially with discount rates (up to −42 %), and demand elasticities (up to +79 %). However, the qualitative nature of our results is unchanged. For the active travel scenario, NA-P H-CB continue to account for a major share of gross GDP losses, and the net GDP impact remains close to zero under all circumstances except for one specific sensitivity analysis: When UK urban fossil fuel-based private transportation is a luxury good, the active travel scenario becomes cost-effective (up to +4.1bn £). Hence, our sensitivity analyses confirms that NA-P H-CB play a key role in reducing net costs and ensuring cost-effectiveness for the active travel scenario.
Breakeven simulations
The breakeven simulations of the two investment-based technological cleaner cars and household energy scenarios indicate that the introduction of efficiency-enhancing new technologies allows for substantial investment outlays. The household energy scenario remains cost-effective as long as investment costs are kept below £26bn; £142bn for the cleaner cars scenario. The results also suggest that NA-P H-CB account for £250–£500 m; less than one per cent of gross co-benefits in the cleaner cars scenario. Hence, our technological mitigation interventions generally result in small NA-P H-CB, while the recovery of potential investment outlays mainly stems from efficiency improvements.
As demonstrated in the previous section, the cleaner cars scenario is likely to be cost-effective within our 20 year time horizon, while the household energy scenario only becomes cost-effective in the very long term. A UK network for electric cars is yet to be developed and hybrid cars remain comparatively costly. Nevertheless, the implementation of the cleaner cars scenario may well be attained through a general change in attitudes towards hybrid and smaller fossil fuel-based vehicles at little additional or possibly even at lower (investment and maintenance) costs to car owners. This is all the more likely as the hybrid car technology is likely to become cheaper and more accessible for the average car buyer over time. Cheaper cars also come with the risk of creating rebound effects which may lower GHG emissions impact. Alternative (and potentially more costly) ways to implement the scenario includes graduated car taxation or outright regulation of car standards. In any case, with an overall breakeven investment cost estimated at £142bn, the UK cleaner cars scenario—and by the same token, the overall UK urban transport strategy with the cost-neutral active travel scenario—is very likely to be cost-effective.
Conclusion
Our urban transport strategy represents a desirable way to help achieve the sector-specific 2030 UK target for GHG emission reductions and at the same time reap significant health co-benefits. Non-air pollution health co-benefits play a key role in reducing net costs and ensuring cost-effectiveness. Moreover, while local air pollution health co-benefits are small in our scenario, they should be substantially higher if electric vehicles were widely adopted. Our analyses also suggest that increased active travel leads to significant increases in longevity. Since these welfare-improving health co-benefits may be hard to quantify in economic terms, this points to the need for adopting a more holistic assessment methodology for GHG strategies, which properly values the positive welfare impact of health co-benefits with negative economic repercussions (such as increased longevity).
Our evidence suggests that demand-constraining interventions by themselves may carry high costs. This was exemplified by the healthy diet scenario, where the introduction of a distortionary food tax leads to significant welfare losses. Our broader UK food and agriculture strategy, which includes additional technological improvements such as improved efficiency of livestock farming and decreased fossil-fuel inputs, should however carry smaller net costs (especially if supported by policy-related changes in consumer preferences leading to substitution with other ‘lower carbon’ and healthier foods). The importance of technological mitigation interventions was exemplified by our household energy efficiency strategy, where health effects were small but efficiency-improvements from improved insulation and ventilation reduced societal costs of implementation by almost 50 %. With continuing health effects and efficiency gains over the lifetime of the housing improvements, our UK household energy efficiency strategy should become cost-effective over the very long term, beyond our 20 year time horizon.
Overall, we find evidence of important health co-benefits, additional to those from reduced air pollution, in spite of the conservative assumptions of our approach. Health co-benefits may well continue to increase beyond our 20 year time horizon due to long lag periods between policy implementation and health effects such as Alzheimers disease and some cancers. Underestimation of health effects is likely to be especially pronounced in our household energy scenario, where realistic phasing-in of the investment programme occurs throughout our 20 year time period and various health outcomes are characterised by long lag times. Interventions during the final years of the programme therefore contribute little (or nothing) towards the health co-benefits. We may also have underestimated some of the individual health co-benefits. For example, we conservatively assumed that depression was only reduced for 1 year by improved home insulation and warmer homes. We also found some leakage of carbon emissions to other production sectors. This emphasizes the need for economy-wide strategies to reduce total GHG emissions.
Based on our conservative approach to measuring health co-benefits and cost-effectiveness, and considering the inherent uncertainties surrounding the measurement of investment requirements and behavioural tax incentives, we conclude that the mix of sector-specific UK GHG strategies, required to achieve future emission targets, is likely to include elements which may not necessarily be cost-effective over our 20 year time horizon. This should however not deter policy makers from making the right decisions and implementing the necessary policies—preferably with a holistic focus on strategies which achieves minimum society costs and maximum health cobenefits.
Electronic supplementary material
(DOCX 103 kb)
Acknowledgments
Funded by the UK Department of Health Policy Research Programme.
Footnotes
Although a more accurate term would be “greenhouse pollutants”, we employ the widely used term “greenhouse gases” to refer to all anthropogenic climate-active atmospheric species including both gases and aerosols.
The indicative 2030 target for UK emission reductions is 46 % relative to 2009 levels and 60 % relative to 1990 levels (CCC 2010). Hence, our sector-specific 50 %–60 % target reductions relative to 1990 levels (which were established before the most recent target release) are slightly less ambitious compared to the official overall target.
The scenarios were originally developed as contingent scenarios, designed to achieve emission targets without consideration of general equilibrium spillover effects and potential leakages to other sectors and abroad. We find that such leakages are important, and this emphasizes the need for specifying sector-specific scenarios within broader economy-wide strategies to reduce total GHG emissions.
In this article, the term ‘air pollution’ is used to refer to outdoor air pollution. Health co-benefits from reduced/increased in-door concentrations of fine particulate matter/radon are therefore referred to as ‘non-air pollution’ health co-benefits in the discussion of the household energy scenario.
For details, see Annex A.
For details, see Annex B.
The required tax increase varies with imposed demand elasticities (see sensitivity analyses in Annex C).
Previous reports have found that most of the household energy conservation measures which are analysed in this article, are cost-effective and have expected payback times of 15–40 years depending on the intervention for average dwellings (Henderson 2007; Morrell 2010). It is therefore highly likely that our proposed 2011–30 housing energy investment strategy with 0–19 year payback times will reach the breakeven point before 2040 and certainly before 2050. It also follows that the adoption of an expanded time horizon to allow for the 20–30 year repayment periods which the UK government’s’Green Deal’ is based on (DECC 2011), would, in all likelihood, confirm that UK home insulation schemes represent cost-effective ways of reducing UK GHG emissions over the very long term.
For details, see Annex C.
References
- Anand S, Sen AK. Human Development Index: Methodology and Measurement. Human Development Report Office Occasional Papers No 12. New York: UNDP; 1994. [Google Scholar]
- CCC (2010) The Fourth Carbon Budget. Reducing Emissions through the 2020s. Committee on Climate Change. London, UK. http://www.theccc.org.uk/reports/fourth-carbon-budget. Accessed 23 Oct 2012
- DECC (2008) UK Climate Change Act 2008. Chapter 27. Department of Energy and Climate Change, UK. http://www.legislation.gov.uk/ukpga/2008/27/contents. Accessed 23 October 2012
- DECC (2011) What measures does the Green Deal cover? Department of Energy and Climate Change, UK. http://www.decc.gov.uk/publications/basket.aspx?FilePath=What+we+do%2fSupporting+consumers%2fgreen_deal%2f1734-what-measures-does-the-green-deal-cover.pdf&filetype=4#basket. Accessed 23 October 2012
- DECC (2012) UK greenhouse gas emissions, final figures. Department of Energy and Climate Change, UK. http://www.decc.gov.uk/en/content/cms/news/pn12_008/pn12_008.aspx. Accessed 23 October 2012
- den Elzen MGJ, van Vuuren DP, van Vliet J. Postponing emission reductions from 2020 to 2030 increases climate risks and long-term costs. Clim Chang. 2010;99:313–20. doi: 10.1007/s10584-010-9798-5. [DOI] [Google Scholar]
- den Elzen MGJ, Hof AF, Roelfsema M. The emissions gap between the Copenhagen pledges and the 2C climate goal: Options for closing and risks that could widen the gap. Global Environ Chang. 2011;21:733–43. doi: 10.1016/j.gloenvcha.2011.01.006. [DOI] [Google Scholar]
- Dessus S, O’Connor D. Climate policy without tears: CGE-based ancillary benefits estimates for Chile. Environ Resour Econ. 2003;25:287–317. doi: 10.1023/A:1024469430532. [DOI] [Google Scholar]
- Friel S, Dangour AD, Garnett T, Lock K, Chalabi Z, Roberts I, Butler A, Butler CD, Waage J, McMichael AJ, Haines A. Public health benefits of strategies to reduce greenhouse-gas emissions: food and agriculture. Lancet. 2009;374:2016–25. doi: 10.1016/S0140-6736(09)61753-0. [DOI] [PubMed] [Google Scholar]
- Garbaccio RF, Ho MS, Jorgenson DW (2000) The health benefits of controlling carbon emissions in China. http://www.oecd.org/environment/climatechange/2053233.pdf. Accessed 23 October 2012
- Haines A, McMichael AJ, Smith KR, Roberts I, Woodcock J, Markandya A, Armstrong BG, Campbell-Lendrum D, Dangour AD, Davies M, Bruce N, Tonne C, Barrett M, Wilkinson P. Public health benefits of strategies to reduce greenhouse-gas emissions: overview and implications for policy makers. Lancet. 2009;374:2104–14. doi: 10.1016/S0140-6736(09)61759-1. [DOI] [PubMed] [Google Scholar]
- Henderson J (2007) Delivering cost effective carbon saving measures to existing homes. BRE report. Client report number 239–552. Prepared for Department for Environment, Food and Rural Affairs, UK. http://www.decc.gov.uk/assets/decc/11/about-us/science/4074-delivering-cost-effective-saving-measures-to-homes.pdf. Accessed 23 October 2012
- IPCC (1990) IPCC first assessment report. Intergovernmental Panel on Climate Change. http://www.ipcc.ch/publications_and_data/publications_and_data_reports.shtml#1. Accessed 23 October 2012
- IPCC (2007) IPCC fourth assessment report: Climate change 2007. Intergovernmental Panel on Climate Change. http://www.ipcc.ch/publications_and_data/publications_and_data_reports.shtml#1. Accessed 23 October 2012
- Jack DW, Kinney PL. Health co-benefits of climate mitigation in urban areas. Curr Opin Environ Sustain. 2010;2:172–77. doi: 10.1016/j.cosust.2010.06.007. [DOI] [Google Scholar]
- Jarrett J, Woodcock J, Griffiths U, Chalabi Z, Edwards P, Roberts I, Haines A. Effect of increasing active travel in urban England and Wales on costs to the National Health Service. Lancet. 2012;379:2198–2205. doi: 10.1016/S0140-6736(12)60766-1. [DOI] [PubMed] [Google Scholar]
- Li JC. Including the feedback of local health improvement in assessing costs and benefits of GHG reduction. Rev Urban Reg Dev Stud. 2002;14:282–304. doi: 10.1111/1467-940X.00058. [DOI] [Google Scholar]
- Margulis S, Dubeux CBS (2011) The economics of climate change in Brazil: costs and opportunities. FEA-USP, Sao Paolo. http://www.usp.br/nereus/?p=1664. Accessed 23 October 2012
- Morrell P (2010) Low Carbon Construction. Innovation and Growth Team. Final Report. HM Government, UK. http://www.bis.gov.uk/assets/BISCore/business-sectors/docs/l/10-1266-low-carbon-construction-IGT-final-report.pdf. Accessed 23 October 2012
- Oppenheimer M. Climate change impacts: accounting for the human response. Clim Chang. 2012 [Google Scholar]
- Roe GH, Baker MB. Why is climate sensitivity so unpredictable. Science. 2007;318:629–32. doi: 10.1126/science.1144735. [DOI] [PubMed] [Google Scholar]
- Smith RD, Keogh‐Brown M, Jensen HT, Chalabi Z, Dangour A, Davies M, Edwards P, Garnett T, Givoni M, Griffiths U, Hamilton I, Jarrett J, Roberts I, Wilkinson P, Woodcock J, Haines A (2013) The macroeconomic impact of health co‐benefits associated with climate change mitigation strategies. Working paper. London School of Hygiene and Tropical Medicine. http://researchonline.lshtm.ac.uk/1217046/1/Smith_et_al_WP_2013_macro-economic_effects_of_health_co-benefits.pdf. Accessed 17 September 2013
- Stern . The economics of climate change. The Stern Review: Cambridge University Press; 2007. [Google Scholar]
- van den Bergh JCJM. Safe climate policy is affordable—12 reasons. Clim Chang. 2010;101:339–385. doi: 10.1007/s10584-009-9719-7. [DOI] [Google Scholar]
- Wilkinson P, Smith KR, Davies M, Adair H, Armstrong BG, Barrett M, Bruce N, Haines A, Hamilton I, Oreszczyn T, Ridley I, Tonne C, Chalabi Z. Public health benefits of strategies to reduce greenhouse-gas emissions: household energy. Lancet. 2009;374:1917–29. doi: 10.1016/S0140-6736(09)61713-X. [DOI] [PubMed] [Google Scholar]
- Woodcock J, Edwards P, Tonne C, Armstrong BG, Ashiru O, Banister D, Beevers S, Chalabi Z, Chowdhury Z, Cohen A, Franco OH, Haines A, Hickman R, Lindsay G, Mittal I, Mohan D, Tiwari G, Woodward A, Roberts I. Public health benefits of strategies to reduce greenhouse-gas emissions: urban land transport. Lancet. 2009;374:1930–43. doi: 10.1016/S0140-6736(09)61714-1. [DOI] [PubMed] [Google Scholar]
Associated Data
This section collects any data citations, data availability statements, or supplementary materials included in this article.
Supplementary Materials
(DOCX 103 kb)