

Abstract
This unit introduces RAMPAGE (RNA Annotation and Mapping of Promoters for the Analysis of Gene Expression), a method that harnesses highly specific sequencing of 5′-complete complementary DNAs to identify transcription start sites (TSSs) genome-wide. Although TSS mapping has historically relied on the detection of 5′-complete cDNAs, current genome-wide approaches typically have limited specificity, and provide only scarce information regarding transcript structure. RAMPAGE allows for highly stringent selection of 5′-complete molecules, thus allowing base-resolution TSS identification with a high signal-to-noise ratio. Paired-end sequencing of medium-length cDNAs yields transcript structure information that is essential to interpreting the relationship of TSSs to annotated genes and transcripts. As opposed to standard RNA-seq, RAMPAGE explicitly yields accurate and highly reproducible expression level estimates for individual promoters. Moreover, this approach offers a streamlined 2- to 3-day protocol that is optimized for extensive sample multiplexing, and is therefore adapted for large-scale projects. This method has been applied successfully to human and Drosophila samples, and should in principle be applicable to any eukaryotic system.
This unit presents a protocol for RAMPAGE (RNA Annotation and Mapping of Promoters for the Analysis of Gene Expression), a method for the genome-wide identification of transcription start sites (TSS) and the quantification of promoter activity (Batut et al., 2012). RAMPAGE is based on the synthesis of 5′-complete complementary DNAs (cDNAs) from eukaryotic total RNA samples, and their sequencing on Illumina high-throughput platforms.
Previous methods for high-throughput sequencing of 5′-complete cDNAs have failed to achieve high specificity for TSS identification, and often provide only scarce sequence information in the form of 20- to 30-base “tags” (Ni et al., 2010; Valen et al., 2009). This makes their alignment to reference genomes problematic, especially when it comes to the study of repeat sequences, and yields no information regarding transcript structure. This is a major pitfall, as transcript connectivity is essential to revealing the nature of the products transcribed from individual promoters. Transcript connectivity is also key to understanding relationships between functionally related elements, such as alternative promoters.
The approach we describe here (Figure 1) achieves greatly increased TSS specificity through the combination of two orthogonal enrichment strategies, namely template-switching (Hirzmann et al., 1993) and cap-trapping (Carninci et al., 1996). Template-switching makes use of unique properties of certain reverse-transcriptase enzymes to add adaptor sequences to the end of 5′-complete cDNAs, while cap-trapping is based on the biotinylation and pulldown of capped RNA molecules and their associated 5′-complete cDNAs. A streamlined protocol permits the completion of the full procedure in 2-3 days, and the addition of sequence barcodes very early in the workflow allows for very efficient multiplexing, by allowing most of the procedure to be performed on large pools of samples. The resulting libraries are suitable for paired-end sequencing on Illumina platforms (GAII, HiSeq, MiSeq), the length of sequences being only limited by the capabilities of the platform.
Figure 1. RAMPAGE library preparation protocol.
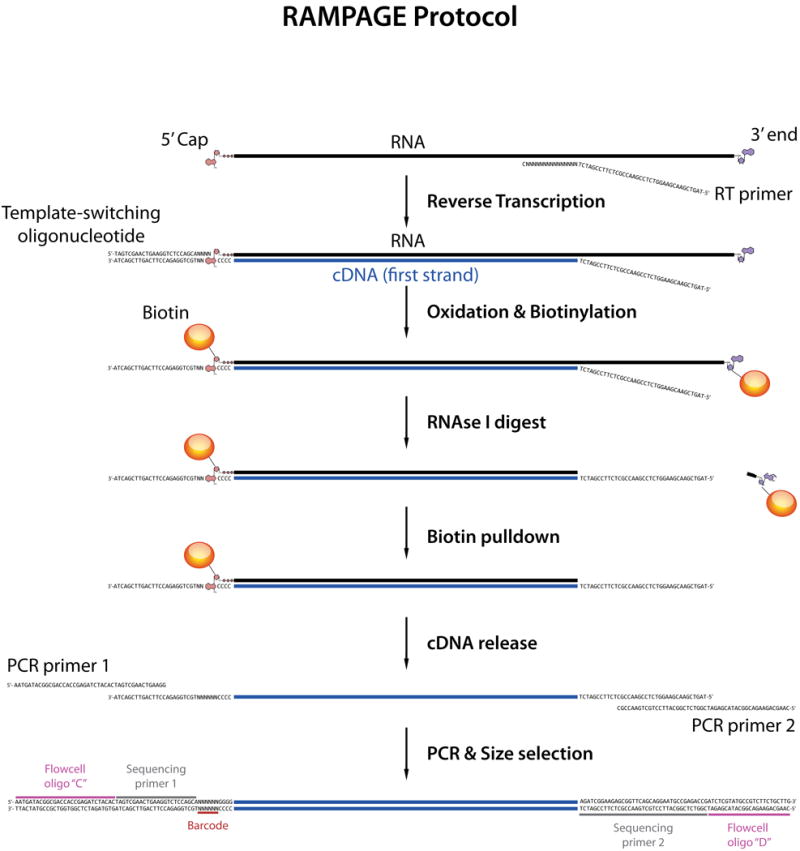
Ribosome-depleted RNA is reverse-transcribed with random primers bearing an Illumina adaptor sequence overhang. In the conditions used, the RT enzyme will often add a few non-templated C's when it reaches the 5′ end of the template, especially if the template is capped. The template-switching oligo (TSO), which has 3 riboguanosines at its 3′, can hybridize to the terminal C's. This prompts RT to switch templates, and add the TSO sequence at the end of the newly synthesized cDNA. The TSO bears the other Illumina adaptor sequence: therefore, after RT, 5′-complete cDNAs are amplifiable, whereas non-5′-complete molecules are not. The next few steps implement the cap-trapping strategy: riboses with 2′ and 3′ free hydroxyl groups are oxidized and biotinylated, and single-stranded portions of RNA are digested by RNAseI. This leaves biotin groups only at the 5′ ends of capped transcripts hybridized to 5′-complete cDNAs, which can then be recovered on streptavidin-coated beads. After PCR amplification and size selection, the cDNAs selected by these 2 orthogonal strategies can be directly sequenced on Illumina platforms.
Basic Protocol: Preparation of 5′-complete cDNAs for paired-end sequencing
Reagents & Consumables
Terminator digest
-
–
Terminator (TEX) enzyme (Epicentre, 40U, Cat # TER51020)
Reverse-transcription
-
–
SuperScript III Reverse-transcriptase (Invitrogen, 4 × 10,000U, Cat # 18080-085)
-
–
First strand buffer (comes with SuperScript III)
-
–
DTT 100mM (comes with SuperScript III)
-
–
10mM dNTP mix (Invitrogen, 100μl, Cat # 18427-013)
-
–
Betaine 5M Sigma-Aldrich, Cat # B0300-1VL)
-
–
D(-)-Sorbitol (Wako Pure Chemical Industries, 25g, Cat # 194-03752)
-
–
D(+)-Trehalose dihydrate (Sigma-Aldrich, 25g, T9531-25G)
-
–
Sorbitol/Trehalose solution must be prepared as described in Recipe 1.
-
–
96-well 200μl reaction plates
Quantitative PCR:
-
–
Power SYBR Green premix (Applied Biosystems, 1×5ml, Cat # 4367659)
-
–
96-well 200μl optical plates (Applied Biosystems, Cat # N801-0560)
-
–
Optical 96-well plate covers (Applied Biosystems, Cat # 4311971)
Agencourt RNAClean XP purification:
-
-
Agencourt RNAClean XP Kit (Beckman Coulter, 40 mL, Cat # A63987)
Agencourt AMPure XP purification:
-
-
Agencourt AMPure XP Kit (Beckman Coulter Inc., 60 mL, Cat # A63881)
Diol Oxidization:
-
-
Sodium periodate (NaIO4) ≥99.8% (Sigma-Aldrich, 5g, Cat # 311448-5G)
-
-
NaOAc 3M, pH 5.5 (Ambion, 100 mL, Cat # AM9740)
-
-
Tris-HCl 1M, pH7.4 (Sigma-Aldrich, 100 mL, Cat # T2194-100ML)
Biotinylation:
-
–
Biotin hydrazide long arm (Vector Labs, 50mg, Cat # SP-1100)
-
–
Sodium Citrate (Sigma-Aldrich, 500g, Cat # S1804-500G)
RNAse I digestion:
-
–
RNAse I (5-10 U/μl) (Promega, 1,000U, Cat # M4261)
-
–
EDTA 0.5M, pH8.0 (Ambion, 100 mL, Cat # AM9260G)
Cap-trapping:
-
–
MPG Streptavidin beads (PureBiotech LLC, 2mL (20mg), Cat # MSTR0502)
-
–
E. coli tRNA Type XX (Sigma-Aldrich, 500U, Cat # R1753-500UN). Must be DNAse-treated as described in Support Protocol 1.
-
–
NaCl 5M (Ambion, 100mL, Cat # AM9760G)
-
–
NaOH Solution, 10M in H2O (Sigma-Aldrich, 100mL, Cat # 72068-100ML)
PCR amplification:
-
–
Ex Taq Hot Start polymerase (Clontech, 250U, Cat # RR006A)
Miscellaneous:
-
–
H2O Molecular biology grade (Sigma-Aldrich, 100ml, Cat # 95284-100ML)
-
–
HCl 36.5-38%, Molecular Biol. grade (Sigma-Aldrich, 100ml, Cat # H1758-100ML)
-
–
Glycerol (Sigma-Aldrich, 100ml, Cat # G5516-100ML)
-
–
SDS (Sigma-Aldrich, 500ml, Cat # G05030-500ML-F)
-
–
High-recovery tubes 1.7 mL (Axygen, Case of 10 × 250, Cat # MCT-175-L-C)
-
–
High-recovery tubes 0.2 mL (Axygen, Pack of 1,000, Cat # PCR-02-L-C)
-
–
RNAse-free pipette tips (1,000, 200, 20μl)
Synthetic oligonucleotides
All ordered from IDT. Purification procedure: standard desalting. Synthesis scale 100 nmol, unless otherwise specified.
Template switching oligos:
rampage_TS_**
5′- TAGTCGAACTGAAGGTCTCCAGCANNNNNNrGrGrG
The 6 N's of the sequence correspond to the library identification barcodes.
The “**” part in the name is reserved for barcode numbers.
(!) The last 3 residues must be riboguanosines.
Order as 250 nmol RNA oligo batches.
See “Sequence barcodes” section below for a list of barcodes and technical details.
RT primer:
rampage_RT
5′-TAGTCGAACGAAGGTCTCCGAACCGCTCTTCCGATCT(N)15
Final PCR primers:
rampage_F
5′- AATGATACGGCGACCACCGAGATCTACACTAGTCGAACTGAAGG
rampage_R
5′-CAAGCAGAAGACGGCATACGAGATCGGTCTCGGCATTCCTGCTGAACCGCTCTTCCGATCT
Sequencing primers:
-
Custom Read 1 sequencing primer (rampage_r1):
5′- TAGTCGAACTGAAGGTCTCCAGCA
-
Illumina Read 2 sequencing primer (SBS8):
5′- CGGTCTCGGCATTCCTGCTGAACCGCTCTTCCGATCT
Sequence barcodes
A set of 40 6-base barcodes were designed, with the requirements of a GC content between 20 and 80% and a minimum Hamming distance (i.e., number of differing positions) of 3 between any 2 barcodes in the set. This second requirement ensures that even barcodes with one sequencing error can still be unambiguously identified, thus maximizing the proportion of barcodes recovered while minimizing the risk of barcode misassignment. The sequences of these 40 barcoded oligos are listed in Supplementary File 1.
Equipment
Thermal cycler (Biorad)
Magnet (96-well plates)
Magnet (microcentrifuge tubes)
Bioanalyzer (Agilent)
Bioanalyzer RNA Nano chip kit (Agilent)
Bioanalyzer DNA High Sensitivity chip kit (Agilent)
Quantitative PCR system (e.g., Applied Biosystems 7300 real-time PCR system)
Degradation of 5′-monophosphate RNAs (Terminator digest)
Start from 5μg total RNA (in ≤10μl H2O), DNAseI-treated. (Note: We have successfully reduced starting amounts to 2-3μg of input per sample when pooling multiple libraries after the reverse-transcription step.) The quality of the RNA should be checked at that point by running a Bioanalyzer RNA Nano chip – RNA integrity is absolutely crucial to generate high-quality libraries.
-
Place the sample (5μg in 10μl) in a high-recovery 200μl PCR tube (or 96-well place if processing many samples). Denature the RNA for 5 min at 65°C in a thermal cycler. Immediately place on a cold block cooled down to 4°C on ice for 2 min (alternatively, the sample can be placed on an ice-water mix).
Proper denaturation is important for degradation efficiency, as secondary structures can protect transcripts from digestion.
- Prepare the digestion mix (20μl total):
Total RNA 10μl (5μg) TEX buffer A 2μl TEX (1U/μl) 3μl H2O 5μl Incubate 90min at 30°C in a thermal cycler.
-
Purify the digested RNA sample by RNACleanXP cleanup, roughly as per manufacturer's protocol. Briefly:
-
-
Add 30μl of RNACleanXP and mix thoroughly by vortexing or pipetting.
-
-
Precipitate for 5 min at room temperature.
-
-
Place on a magnet for 3 min and carefully remove the supernatant.
-
-
Wash twice with 100μl freshly prepared ethanol 70%.
-
-
Air-dry for 2 min (but without completely drying out the beads)
-
-
Elute with 9μl H2O, resuspend beads well by pipetting, incubate 3 min at room temperature.
-
-
Place on the magnet for 3-5 min (until the beads are well separated) and recover 7.5μl of supernatant.
It is recommended at this point to assess the extent of ribosomal RNA degradation by running the samples on a Bioanalyzer RNA Nano chip.
-
-
Reverse-transcription
-
5Prepare the reverse-transcription (RT) mix:
TEX-treated RNA 7.5μl rampage_RT oligo (400μM) 1μl rampage_TS_** oligo (4mM) 1μl -
6
Denature for 10 min at 65°C. Immediately place on an ice-cold metal block for 2 min.
Proper denaturation is important for reverse-transcription efficiency, as secondary structures can diminish the processivity of the enzyme.
-
7Add the RT reaction mix:
Invitrogen 1st strand buffer 7.5μl dNTPs mix 1.9μl Sorbitol/Trehalose mix 7.5μl DTT (100mM) 1.9μl Betaine (5M) 5.6μl SuperScript III RT (200U/μl) 4μl -
8Incubate in a thermal cycler with the following program:
4°C 10″ 22°C 1 min 42°C 30 min 75°C 15 min 4°C Hold -
9
RNACleanXP cleanup: Add 65μl RNACleanXP, wash twice with 150μl 70% EtOH, elute with 42μl H2O, recover 40μl.
Samples can be stored at -20°C at this point. Carefully prevent degradation, though: RNA integrity still matters at this point.
Library quantification & pooling (Facultative)
As library-specific sequence barcodes are added during RT, it is possible to pool samples at this stage. Accurate quantification of individual libraries is important to ensure equal representation of all libraries in the pool. We favor a quantitative PCR (qPCR)-based assay to perform this quantification.
-
10
Prepare 10-fold dilutions series from 10-1 to 10-3 for each sample. Prepare a longer series of dilutions from 100 to 10-5 for one of the libraries (chosen randomly), to generate a standard curve.
-
11
Distribute 2μl of each of these dilutions to individual wells of an optical qPCR 96-well plate (run each reaction in duplicates).
Add qPCR mix (per reaction):rampage_F primer (10μM) 0.8μl rampage_R primer (10μM) 0.8μl Ex Taq buffer SYBR Green mix 10μl RoxII reference dye 0.4μl H2O 6.0μl qPCR program:95°C 2 min 55°C 10″ 68°C 2 min 95°C 15″ 65°C 10″ 68°C 2 min Repeat the last 3 steps (italics) another 38 times (40 cycles total)
-
12
Pool all libraries in equimolar amounts based on qPCR quantification. Aim for a total amount corresponding to 30-50μg of starting material (total, non-TEX treated RNA).
-
13
Reduce the total sample volume through an RNACleanXP precipitation step. Add the RNACleanXP suspension in a beads-to-sample volume ratio of 1.8:1, and follow the procedure described in step 9. Elute with 42μl H2O and recover 40μl.
5′ Cap oxidization
In this step, periodate is used to oxidize ribose residues that bear free 2′ and 3′ hydroxyl groups. All riboses in 3′ terminal nucledotides, as well as those in 5′ cap structures, are affected.
-
14
Prepare 250mM NaIO4 solution: dissolve 26.7mg NaIO4 in 500μl H2O.
This solution should always be prepared fresh. In addition it is light-sensitive, and should be kept covered in aluminum foil, on ice.
-
15
Add 2 μl of 1M NaOAc, pH 4.5 to RNA/cDNA solution.
The pH of this solution is critical.
-
16
Add 2 μl of 250mM NaIO4 and mix well. Incubate on ice in the dark (or in foil) for 45 min.
-
17
Stop the reaction by adding 2μl of 40% glycerol. Mix well by pipetting. Add 14μl of 1M Tris-HCl, pH 8.5. Mix well by pipetting.
-
18
RNACleanXP cleanup: Add 105μl beads suspension, wash 2× with 200μl EtOH 70%, elute with 40μl H2O.
5′ Cap biotinylation
Ribose residues whose 2′ and 3′ hydroxyls have been oxidized to aldehydes in the previous step can be biotinylated by reaction with biotin hydrazide.
-
19
Prepare 15mM biotin solution by dissolving 4.2mg biotin hydrazide in 750μl H2O. Biotin does not dissolve well in water: vortex for 20-30 min at room temperature while covered in aluminum foil.
Always prepare fresh. Solution should be kept at all times on ice, covered in foil.
-
20
Add 4μl of 1M NaCitrate, pH 6.0. Add 13.5μl of 15mM biotin solution and mix well by pipetting.
-
21
Incubate at room temperature for 14-15 hours in the dark (cover with foil).
No cleanup after this step: directly proceed to RNAseI digest.
RNAseI digest
-
22Prepare RNaseI mix. Per reaction:
1M Tris-HCl, pH 8.5 6 μl 0.5M EDTA, pH 8.0 1 μl RNaseI (10U/μl) 5 μl -
23
Add RNaseI mix (12μl) and mix well by pipetting. Incubate 30 min at 37°C.
When pooling many libraries you can extend the incubation time to 60 min,
-
24
Incubate 5 min at 65°C and immediately place on ice for 2 minutes.
-
25
RNACleanXP cleanup: Add 125μl beads suspension, wash 2× with 200μl EtOH 70%, elute with 40μl H2O.
Streptavidin pulldown (“Cap-trapping”)
-
26
During RNaseI digest and cleanup, prepare magnetic streptavidin beads as follows:
-
-
Resuspend beads suspension by vortexing vigorously
-
-
Transfer 100μl of suspension to a new 1.7ml tube
-
-
Add 1.5μl of 20 μg/μl E. coli tRNA and mix well
-
-
Incubate 30 min at RT (vortex every 3 min to resuspend the beads)
-
-
-
27
Prepare wash buffers:
Buffers can be stored at RT for several months.
Wash Buffer 1Reagents Volume Final concentration 5 M NaCl 45 ml 4.5 M 0.5 M EDTA, pH 8.0 5 ml 50 mM Total 50 ml Wash Buffer 2Reagents Volume Final concentration 5 M NaCl 3 ml 0.3 M 0.5 M EDTA, pH 8.0 0.1 ml 1 mM H2O 46.9 ml Total 50 ml Wash Buffer 3Reagents Volume Final concentration 0.5 M EDTA, pH 8.0 0.1 ml 1 mM 10% SDS 2 ml 0.4% 1 M NaOAc, pH6.1 25 ml 0.5 M 1 M Tris-HCl, pH 8.5 1 ml 20 mM H2O 21.9 ml Total 50 ml Wash Buffer 4Reagents Volume Final concentration 0.5 M EDTA, pH 8.0 0.1 ml 1 mM 1 M NaOAc, pH6.1 25 ml 0.5 M 1 M Tris-HCl, pH 8.5 0.5 ml 10 mM H2O 24.4 ml Total 50 ml -
28
Finish preparing the beads:
-
-
Place streptavidin beads on magnetic stand for 3 min and remove supernatant
-
-
Add 50μl Buffer 1, resuspend beads well by pipetting, separate on magnetic stand, remove supernatant. Repeat a 2nd time.
-
-
Resuspend beads in 80μl Buffer 1
-
-
-
29
Add 80μl of beads suspension to the RNAseI-treated sample. Incubate 30 min at room temperature (mix by gentle vortexing every 3 min).
-
30
Place on magnetic stand for 5 min and discard supernatant.
-
31
Wash with buffer 1: add 150μl buffer 1, resuspend beads well by pipetting, place on magnetic stand for 3 min, discard supernatant.
-
32
Wash with buffer 2 (same procedure).
-
33
Wash twice with buffer 3.
-
34
Wash twice with buffer 4. Make sure the supernatant is completely removed.
-
35
Elution from the beads:
-
-
Dispense 12μl of 1M Tris-HCl, pH 7.0 to a new tube and keep on ice
-
-
Add 65μl of 50mM NaOH to the RNA/cDNA-bound beads. Mix well by pipetting.
-
-
Incubate for 10 min at room temperature. Vortex gently every 2-3 min.
-
-
Place on magnetic stand for 3 min.
-
-
Transfer supernatant to the tube containing Tris-HCl pH 7.0.
-
-
-
36
AMPureXP cleanup: add 130μl beads suspension, precipitate 5 min, wash 2× with 200μl EtOH 70%, air-dry for 2 min, elute with 73μl H2O.
PCR amplification
-
37Prepare the PCR reaction mix as follows:
Template 73μl Ex Taq buffer 10μl dNTPs (2.5mM) 8μl rampage_F (10μM) 4μl rampage_R (10μM) 4μl Ex Taq HS (5U/μl) 1μl PCR program:95°C 1 min 15″ 55°C 10″ 68°C 2 min 95°C 15″ 65°C 10″ 68°C 2 min Repeat the last 3 steps another 14 times (16 cycles total) 68°C 5 min
Size selection by differential precipitation
Make sure you actually recover exactly 100μl from the PCR: the exact volumes and ratios determine the size selection range and the efficiency of recovery.
-
38
First precipitation: Precipitate (and remove) large inserts
AMPureXP-to-sample ratio: 0.52: 1
-
-
Add 52μl AMPureXP to 100μl of PCR reaction product
-
-
Precipitate 5 min, place on magnet 3 min
-
-
Transfer the supernatant to a new tube and discard the beads.
-
-
-
39
Second precipitation: Precipitate & recover medium inserts, discard short ones
AMPureXP-to-sample ratio: 0.70 : 1
-
-
Prepare “beads-enriched” AMPureXP suspension:
Transfer 80μl AMPureXP suspension to new tube
Place on magnet for 3 min and discard 60μl of supernatant
Resuspend beads well in the remaining 20μl
-
-
Add 18μl of this enriched suspension to the supernatant from the first round of precipitation and mix well
-
-
Precipitate 5 min, separate on magnet, discard supernatant
-
-
Wash 3× with 300μl EtOH 70% & air-dry until no ethanol remains (but do not overdry the beads)
-
-
Elute with 20μl H2O, incubate 5 min at room temperature, recover supernatant.
-
-
Quality control & Quantification
-
40
Run the final library on a Bioanalyzer High Sensitivity DNA chip for quality control and preliminary quantification. Follow the manufacturer's instructions. Run the undiluted samples as well as 10-1 and 10-2 dilutions, to make sure at least one measurement will fall within the dynamic range of the assay. Expected size range: ∼ 300-1000bp.
-
41
Adjust the concentration of the library to 10nM.
-
42
Sequence on an Illumina platform (GAII, HiSeq, MiSeq). Paired-end run, read length as desired. Loading concentration as recommended by the manufacturer for the platform of choice.
Sequencing primers: Read 1: rampage_r1 (custom primer)
Read 2: SBS8 (standard Illumina)
Recipe 1: Sorbitol/Trehalose (3.3M/0.66 M) stock solution preparation
Materials
-
–
D(-)-Sorbitol (Wako Pure Chemical Industries, 25g, Cat # 194-03752)
-
–
D(+)-Trehalose dihydrate (Sigma-Aldrich, 25g, T9531-25G)
-
–
RNAse-free water (molecular biology grade)
Equipment
-
–
50 ml centrifuge tubes
-
–
RNAse-free, autoclavable glass bottle (100 ml)
-
–
Autoclave
Add 2ml of RNAse-free water in a 50ml tube.
Weigh 8.02g of trehalose directly into the tube.
Add 3ml of water and mix.
Weigh 17.8g of sorbitol directly into the tube.
Add 5.5ml of water and mix.
Add water to a total volume of solution of 30ml and mix well.
Transfer to an RNAse-free glass bottle and autoclave at 121°C for 30 min.
Store at room temperature in 1.5ml aliquots protected from light with aluminum foil. This solution can be kept for up to 6 months.
Support Protocol 1: tRNA stock solution preparation
This RNA will be used to saturate non-specific interactions of RNA molecules with the streptavidin-coated beads. It needs to be carefully DNAse-treated, protease-treated, and purified prior to this. Aliquots of purified tRNA can be stored for later use.
Materials
-
–
E. coli tRNA Type XX (Sigma-Aldrich, 500U, Cat # R1753-500UN).
-
–
DNAse RQ1 (Promega, 1,000U, Cat # M6101)
-
–
Proteinase K (NEB, 60 mg, Cat # P8102S)
-
–
RNACleanXP (Agencourt)
-
–
Ethanol 70%
Equipment
-
–
Microcentrifuge
-
–
Heating block (for 1.5 mL tubes)
-
–
1.5 mL tubes
- In a 2ml microcentrifuge tube, dissolve the tRNA in water and prepare the DNAse digestion mix:
tRNA 30mg H2O 400μl RQ1 DNAse buffer 45μl DNAse RQ1 (1U/μl) 30μl Incubate at 37°C for 2 hours.
- Add to the mix:
0.5M EDTA 10μl 10% SDS 10μl Proteinase K (10mg/ml) 10μl Incubate at 45°C for 30 min.
-
RNACleanXP cleanup:
-
-
Add 900μl of RNACleanXP suspension and mix well.
-
-
Precipitate for 5 mins at room temperature.
-
-
Place on magnet for 5-10 mins (until the solution is clear).
-
-
Discard the supernatant and wash 3 times with 1.8ml of 70% ethanol. Remove the ethanol.
-
-
Centrifuge for a few seconds to bring all remaining ethanol to the bottom of the tube and place back on magnet for 1 min.
-
-
Remove any remaining ethanol.
-
-
Air-dry for 3 mins.
-
-
Elute with 1.5ml water, mix well by pipetting, incubate at room temperature for 5 mins, place on magnet for 5-10 mins (until the solution is clear).
-
-
Recover the supernatant.
-
-
Store in small aliquots (e.g., 100μl) at -20°C for up to a year.
Support Protocol 2: Data Analysis
-
Alignment of cDNAs to the reference genome
For speed and accuracy, we use the STAR software (Dobin et al., 2012). However, any short-read aligner capable of spliced alignment of paired-end Illumina data would in principle be suitable. The library identification barcode (first 6 bases of read 1) as well as the reverse-transcription primer sequence (first 15 bases of read 2) have to be trimmed off prior to mapping. Since a few ‘Gs’ are added at the very 5′ during the cloning procedure, it is important that the aligner be able to automatically trim off these non-genomic bases during mapping. The STAR algorithm and others have this capability.
-
Filtering of uniquely mapping reads
The aim of this step is to exclude from the analysis any reads for which the locus of origin cannot be unambiguously determined due to limited sequence information or genomic repeats.
-
Collapsing of PCR duplicates
PCR duplicates must be removed to improve both the specificity of peakcalling and the accuracy of transcript quantification. Collapsing is performed based on full alignment coordinates (start, end, splice sites). To avoid over-collapsing, we use the sequence of the RT primer as a pseudo-random single-molecule barcode. Indeed, since this long oligo often primes RT with mismatches, cDNAs derived from distinct RNA molecules often have different RT primer sequences.
-
Determination of the density of cDNA 5′ ends at all genomic positions
For each cDNA sequence, record the genomic position to which the 5′-most base of the cDNA aligns. For the whole dataset, this is best represented as an intensity (“wiggle”) file.
-
Determination of the coverage by downstream reads at all genomic positions
Extract the alignment coordinates of all downstream reads from the full alignments. Then for each genomic position, record the number of downstream reads that cover it. For the whole dataset, this is best represented as an intensity (“wiggle”) file.
-
Peakcalling (using data from steps 4 & 5)
We use a sliding window algorithm that, for each position in the genome, assesses the statistical enrichment of 5′ signal within a window surrounding that position. The background distribution used to test significance is a negative binomial (the dispersion parameter can be optimized for each dataset). The coverage by downstream reads in the same window is used to subtract a pseudo-count from the 5′ signal, and thus render significance harder to achieve at highly transcribed exonic positions (please see Commentary section for further explanation). Neighboring significant windows are fused into peaks, which are then trimmed at the edges down to the first base with signal.
-
Attribution of individual TSCs to annotations (using data from 3 & 6)
TSCs can be attributed to annotated genes if reads that initiate within them also overlap annotated exons. We usually require 2 independent (collapsed) cDNAs to support that association. In case of ties (one TSC linked to more than one annotation), all associations supported by 5-fold fewer reads (or less) than the strongest association are removed. Among other things, this filters out spurious associations to downstream genes due to run-off transcription from the appropriate (upstream) gene.
-
Quantification of 5′ end signal over individual TSCs (using data from 4 & 6)
Count the number of 5′ tags covering each TSC.
-
Normalization of expression values for sequencing depth
For this purpose, we consider the “total transcriptome” of interest to be the ensemble of all transcripts in the sample that initiate within any of the TSCs called as statistically significant. Therefore, we normalize the expression value of each TSC to the sum of the expression values of all TSCs. This normalized measure of expression is usually reported in reads per million (RPM).
-
Reconstruction of partial transcript models
For each TSC, we extract all cDNAs that have their 5′ end within its boundaries (on the same strand), and convert the alignments to BAM format. Then, each of these “bundles” of reads is run through Cufflinks (Trapnell et al., 2010) to generate transcript models.
Commentary
Background Information
The detection and mapping of 5′-complete cDNAs has long been the method of choice to identify transcription start sites at high resolution, traditionally by primer extension assays or by cap-trapping and Sanger sequencing (Carninci et al., 1996). The advent of high-throughput sequencing platforms has created the opportunity for new methods that could perform the same task on a genome-wide scale. Additionally, massively parallel sequencing allows for transcript quantification through the counting of cDNA fragments, as is done for instance in standard (shotgun) RNA-seq (Wang et al., 2009). But compared to shotgun RNA-seq, the 5′-complete cDNA sequencing approach has the critical advantage of explicitly preserving TSS-specific information, thus faithfully delineating the expression profiles of individual promoters.
Other methods for 5′-complete cDNA sequencing have been developed previously (Ni et al., 2010; Plessy et al., 2010; Valen et al., 2009), but provide only limited specificity for TSS detection (Batut et al., 2012). Most of these only allow for the sequencing of short sequence tags, which renders mapping to reference genomes very problematic. Moreover, this dearth of sequence information prevents evidence-based assignment of novel promoters to annotated genes. Few protocols allow for paired-end sequencing of medium-sized cDNA fragments (Ni et al., 2010; Plessy et al., 2010), and those protocols offer the poorest TSS specificity (Batut et al., 2012). Additionally, all these protocols are cumbersome and often require large amounts of input material, which makes both their application to rare samples and their parallelization problematic (Batut et al., 2012).
With RAMPAGE, we present a protocol that achieves highly specific 5′-complete cDNA preparation and allows for paired-end sequencing to the full capability of current Illumina platforms. Input material requirements are on the order of 2-5μg of total RNA, which is easily manageable for most samples. Additionally, sample multiplexing greatly improves the throughput of the library preparation process though the addition of sequence barcodes very early in the protocol, which allows almost the entire process to be carried out on large pools of samples in a single tube.
Finally, it is important to stress the portability of this protocol: by substituting the proper adaptor sequences, it should be readily feasible to adapt it for sequencing on other platforms. This is a notable advantage, as new technologies offering significantly greater read lengths are beginning to emerge.
Recommendations for RAMPAGE Data Analysis
From our experience with RAMPAGE, we have designed an integrated data processing workflow that makes extensive use of the unique features of the data to enhance the accuracy and quality of the analysis. Basic processing has proven, in our experience, to be an important contributor to the quality of the output of RAMPAGE assays. As a guide to readers and potential users of the technique, we are describing in some detail in Support Protocol 1 the approach we have chosen to take. This description covers all analysis steps – from raw sequencing data to TSS clusters, expression level estimates and partial transcript models.
The most distinctive part of our pipeline is a novel peakcalling algorithm for TSS cluster finding that implements several noise-filtering strategies to improve our ability to discriminate between true TSSs and background signal. As with all biochemical assays, biologically relevant signal must be distinguished from a background that may have multiple possible origins. Moreover, the vast majority of eukaryotic promoters does not display transcription initiation at a single position, but instead allows initiation at multiple sites. The precise length and shape of these TSS clusters (TSCs) vary between promoters, from sharp (one or a few nucleotides) to broad (≥100 nucleotides) (Carninci et al., 2006). Therefore, previous analyses of 5′-complete cDNA sequencing data have usually made some attempt at grouping individual TSSs into functionally meaningful local clusters (Carninci et al., 2006; Ni et al., 2010; Plessy et al., 2010). Elaborating on this existing work, we devised a novel approach to identify TSCs, which we define operationally as regions of statistically significant clustering of cDNA 5′ ends. Critically, our peakcalling algorithm was designed to make extensive use of paired-end information and to correct for several sources of noise inherent to 5′-complete cDNA sequencing.
Firstly, the null (“background”) distribution of signal per genomic position is expected to be overdispersed due to at least two technical factors. Failures of reverse-transcriptase to processively reach the very 5′ end of its template will be more likely at specific sites of a given transcript (e.g., strong secondary structures), and PCR duplicates generated during the library preparation process can randomly distort the signal at individual positions. Both effects will lead to the raw data seeming more “peaky” than the actual landscape of transcription initiation is. To attenuate these effects, we make use of an overdispersed statistical distribution (negative binomial) to model background signal, and we remove PCR duplicates from our datasets prior to peakcalling. For our purposes, we define PCR duplicates as read pairs that share similar alignment coordinates (start, end, splice sites) and an identical reverse-transcription primer sequence (which we use as a pseudo-random single-molecule barcode).
Secondly, non-5′-complete cDNAs represents another source of background, which will manifest itself mostly over exons. This type of background is complex, because the amount of non-specific signal depends on transcript abundance. In the absence of an appropriate correction, these artifacts will yield many false-positive TSCs over highly expressed transcripts. Taking advantage of paired-end sequence information, we make use of the fact that coverage by downstream sequencing reads (i.e., the 3′-most portion of our cDNAs) can provide us with an estimate of transcript abundance at internal (non-TSS) positions. We model background from incomplete cDNAs as linearly proportional to transcript abundance as measured by downstream read coverage. We have shown this approach, however imperfect it might seem, to greatly improve our ability to distinguish between true TSSs and spurious internal signal (Batut et al., 2012).
These specially designed features were incorporated into a sliding window algorithm that scans the whole genome and assesses the significance of local signal enrichment given the null distribution. Downstream read coverage in the same window is used to correct for local transcript abundance, by subtracting from the raw 5′ end signal a pseudocount proportional to this coverage. After FDR correction (Benjamini-Hochberg), enriched windows in close proximity to each other are merged into peaks, and those are subsequently trimmed at the edges down to the first base with signal.
This assay provides extensive information about transcript structure and connectivity, which allows us to connect TSCs to annotated genes based on rigorous experimental determination of cDNA structure. This is crucial point, since the complex transcriptional architectures of eukaryotic genomes (Djebali et al., 2012; Kapranov et al., 2007) make the promoter-transcript relationships at many loci otherwise difficult to decipher. Additionally, we take advantage of the fact that the downstream portions of our cDNA inserts are distributed over broad regions of the targets to gain knowledge about medium-range transcript connectivity. In the current implementation of our workflow, reads from individual TSCs are processed through Cufflinks to produce partial transcript models.
Critical Parameters & Troubleshooting
Low TSS specificity
Sample quality is crucial to the success of the assay. RNA degradation leads to a higher contribution of non-5′-complete cDNAs in the libraries, thus reducing TSS specificity. We strongly recommend checking RNA quality by running the samples on Bioanalyzer RNA Nano chips before starting library preparation, and using only the highest quality samples.
Poor TSS specificity may also be due to RNA degradation during the library preparation process, which may be linked to RNAse contamination. It is critical that all tubes, pipettes, reagents and work surfaces be RNAse-free, at that gloves be worn at all times.
Finally, it is also possible that low TSS specificity could be caused by incomplete RNAse I digest (steps 22-24). This would lead to the capture of non-5′-complete cDNAs through the pulldown of remaining biotin groups at the 3′ end of transcripts. Increasing RNAse I digestion time should be considered.
High ribosomal RNA content
An unusually high rRNA content in the final libraries (over 10-15% of reads) would typically indicate a low-efficiency Terminator (TEX) digest (steps 2-3). Analysis of the samples on a Bioanalyzer RNA Nano (or Pico) chip after TEX digest and cleanup should show a near-complete disappearance of rRNA peaks. If rRNA peaks are still prominent, it may be necessary to increase the incubation time for this step. Proper denaturation of the samples prior to TEX digest is also critical, as the processivity of this enzyme is affected by secondary structures. Samples should be denatured for a full 5 mins at 65°C and then cooled down to 4°C within seconds, as renaturation before the addition of enzyme would have adverse effects.
Shifted library insert size distribution
When preparing libraries from human or Drosophila RNA, final product sizes are typically distributed broadly between 300 and 1,000 bp. Although we cannot exclude that samples from other species may yield different insert sizes, a likely cause of strongly skewed distributions would be a failure of the size selection procedure (steps 38-39). This could result from inaccurate pipetting – the suspension-to-sample ratios are critical – or from the AMPureXP suspension being contaminated or otherwise altered. Alternatively, abnormally short insert sizes could be due to RNA degradation before or during the library preparation process (see “low TSS specificity” paragraph above).
Low pass-filtering rate for sequencing lane
We have recently observed low pass-filter rates despite acceptable cluster densities, and this seems to be related to new Illumina analysis pipeline algorithms or parameters. This is likely due to the stretch of 3-4 G's after the library ID barcode (bases 7-8 of read 1): for these few cycles, all clusters across the flow cell incorporate the same base, and this compromises cluster calling and/or base calling. We have significantly improved the results by spiking in 10-15% phiX and using a separate control lane on the flowcell (either phiX control, or anything with roughly homogeneous base composition: genomic DNA, exome…).
Anticipated Results
When starting from 5μg of total RNA from human or Drosophila samples, one should usually expect a final concentration of 10-40 nM (total volume 20μl), with a broad size distribution spanning the 300-1,000 bp range. From our experience with D. melanogaster samples, 70-80% of reads should map uniquely to the dm3 reference genome. When compared to Flybase r5.32 annotations, over 90% of uniquely mapped reads (median across annotations) that fall within an annotated transcript are within +/-150bp of the annotated TSS.
Time Considerations
When handling few samples and not pooling them, the procedure typically takes 2 full days. All steps through the setup of the biotinylation reaction (first 21 steps) can be performed on day 1, the biotinylation reaction itself can be incubated overnight, and all other steps can easily be performed on day 2. If processing and pooling many samples, the procedure is more comfortably split between 3 days: all steps through reverse-transcription (step 9) on day 1, steps from qPCR quantification to setup of the biotinylation reaction (step 21) on day 2, all remaining steps on day 3. It is also possible, for convenience, to store the samples at -20°C after any RNACleanXP or AMPureXP cleanup step.
Supplementary Material
References
- Batut P, Dobin A, Plessy C, Carninci P, Gingeras TR. High-fidelity promoter profiling reveals widespread alternative promoter usage and transposon-driven developmental gene expression. Genome Res. 2012 doi: 10.1101/gr.139618.112. [DOI] [PMC free article] [PubMed] [Google Scholar]
- Carninci P, Kvam C, Kitamura A, Ohsumi T, Okazaki Y, Itoh M, Kamiya M, Shibata K, Sasaki N, Izawa M, Muramatsu M, Hayashizaki Y, Schneider C. High-efficiency full-length cDNA cloning by biotinylated CAP trapper. Genomics. 1996;37:327–336. doi: 10.1006/geno.1996.0567. [DOI] [PubMed] [Google Scholar]
- Carninci P, Sandelin A, Lenhard B, Katayama S, Shimokawa K, Ponjavic J, Semple CAM, Taylor MS, Engstrom PG, Frith MC, Forrest ARR, Alkema WB, Tan SL, Plessy C, Kodzius R, Ravasi T, Kasukawa T, Fukuda S, Kanamori-Katayama M, Kitazume Y, Kawaji H, Kai C, Nakamura M, Konno H, Nakano K, Mottagui-Tabar S, Arner P, Chesi A, Gustincich S, Persichetti F, Suzuki H, Grimmond SM, Wells CA, Orlando V, Wahlestedt C, Liu ET, Harbers M, Kawai J, Bajic VB, Hume DA, Hayashizaki Y. Genome-wide analysis of mammalian promoter architecture and evolution. Nature Genetics. 2006;38:626–635. doi: 10.1038/ng1789. [DOI] [PubMed] [Google Scholar]
- Djebali S, Davis CA, Merkel A, Dobin A, Lassmann T, Mortazavi A, Tanzer A, Lagarde J, Lin W, Schlesinger F, Xue C, Marinov GK, Khatun J, Williams BA, Zaleski C, Rozowsky J, Roder M, Kokocinski F, Abdelhamid RF, Alioto T, Antoshechkin I, Baer MT, Bar NS, Batut P, Bell K, Bell I, Chakrabortty S, Chen X, Chrast J, Curado J, Derrien T, Drenkow J, Dumais E, Dumais J, Duttagupta R, Falconnet E, Fastuca M, Fejes-Toth K, Ferreira P, Foissac S, Fullwood MJ, Gao H, Gonzalez D, Gordon A, Gunawardena H, Howald C, Jha S, Johnson R, Kapranov P, King B, Kingswood C, Luo OJ, Park E, Persaud K, Preall JB, Ribeca P, Risk B, Robyr D, Sammeth M, Schaffer L, See LH, Shahab A, Skancke J, Suzuki AM, Takahashi H, Tilgner H, Trout D, Walters N, Wang H, Wrobel J, Yu Y, Ruan X, Hayashizaki Y, Harrow J, Gerstein M, Hubbard T, Reymond A, Antonarakis SE, Hannon G, Giddings MC, Ruan Y, Wold B, Carninci P, Guigo R, Gingeras TR. Landscape of transcription in human cells. Nature. 2012;489:101–108. doi: 10.1038/nature11233. [DOI] [PMC free article] [PubMed] [Google Scholar]
- Dobin A, Davis CA, Schlesinger F, Drenkow J, Zaleski C, Jha S, Batut P, Chaisson M, Gingeras TR. STAR: ultrafast universal RNA-seq aligner. Bioinformatics. 2012;29:15–21. doi: 10.1093/bioinformatics/bts635. [DOI] [PMC free article] [PubMed] [Google Scholar]
- Hirzmann J, Luo D, Hahnen J, Hobom G. Determination of Messenger-Rna 5′-Ends by Reverse Transcription of the Cap Structure. Nucleic Acids Research. 1993;21:3597–3598. doi: 10.1093/nar/21.15.3597. [DOI] [PMC free article] [PubMed] [Google Scholar]
- Kapranov P, Willingham AT, Gingeras TR. Genome-wide transcription and the implications for genomic organization. Nat Rev Genet. 2007;8:413–423. doi: 10.1038/nrg2083. [DOI] [PubMed] [Google Scholar]
- Ni T, Corcoran DL, Rach EA, Song S, Spana EP, Gao Y, Ohler U, Zhu J. A paired-end sequencing strategy to map the complex landscape of transcription initiation. Nat Methods. 2010 doi: 10.1038/nmeth.1464. [DOI] [PMC free article] [PubMed] [Google Scholar]
- Plessy C, Bertin N, Takahashi H, Simone R, Salimullah M, Lassmann T, Vitezic M, Severin J, Olivarius S, Lazarevic D, Hornig N, Orlando V, Bell I, Gao H, Dumais J, Kapranov P, Wang H, Davis CA, Gingeras TR, Kawai J, Daub CO, Hayashizaki Y, Gustincich S, Carninci P. Linking promoters to functional transcripts in small samples with nanoCAGE and CAGEscan. Nat Methods. 2010 doi: 10.1038/nmeth.1470. [DOI] [PMC free article] [PubMed] [Google Scholar]
- Trapnell C, Williams BA, Pertea G, Mortazavi A, Kwan G, van Baren MJ, Salzberg SL, Wold BJ, Pachter L. Transcript assembly and quantification by RNA-Seq reveals unannotated transcripts and isoform switching during cell differentiation. Nat Biotechnol. 2010;28:511–515. doi: 10.1038/nbt.1621. [DOI] [PMC free article] [PubMed] [Google Scholar]
- Valen E, Pascarella G, Chalk A, Maeda N, Kojima M, Kawazu C, Murata M, Nishiyori H, Lazarevic D, Motti D, Marstrand TT, Tang MHE, Zhao X, Krogh A, Winther O, Arakawa T, Kawai J, Wells C, Daub C, Harbers M, Hayashizaki Y, Gustincich S, Sandelin A, Carninci P. Genome-wide detection and analysis of hippocampus core promoters using DeepCAGE. Genome Research. 2009;19:255–265. doi: 10.1101/gr.084541.108. [DOI] [PMC free article] [PubMed] [Google Scholar]
- Wang Z, Gerstein M, Snyder M. RNA-Seq: a revolutionary tool for transcriptomics. Nat Rev Genet. 2009;10:57–63. doi: 10.1038/nrg2484. [DOI] [PMC free article] [PubMed] [Google Scholar]
Associated Data
This section collects any data citations, data availability statements, or supplementary materials included in this article.