Abstract
Nonadditivity in protein–ligand affinity data represents highly instructive structure–activity relationship (SAR) features that indicate structural changes and have the potential to guide rational drug design. At the same time, nonadditivity is a challenge for both basic SAR analysis as well as many ligand-based data analysis techniques such as Free-Wilson Analysis and Matched Molecular Pair analysis, since linear substituent contribution models inherently assume additivity and thus do not work in such cases. While structural causes for nonadditivity have been analyzed anecdotally, no systematic approaches to interpret and use nonadditivity prospectively have been developed yet. In this contribution, we lay the statistical framework for systematic analysis of nonadditivity in a SAR series. First, we develop a general metric to quantify nonadditivity. Then, we demonstrate the non-negligible impact of experimental uncertainty that creates apparent nonadditivity, and we introduce techniques to handle experimental uncertainty. Finally, we analyze public SAR data sets for strong nonadditivity and use recourse to the original publications and available X-ray structures to find structural explanations for the nonadditivity observed. We find that all cases of strong nonadditivity (ΔΔpKi and ΔΔpIC50 > 2.0 log units) with sufficient structural information to generate reasonable hypothesis involve changes in binding mode. With the appropriate statistical basis, nonadditivity analysis offers a variety of new attempts for various areas in computer-aided drug design, including the validation of scoring functions and free energy perturbation approaches, binding pocket classification, and novel features in SAR analysis tools.
Introduction
Nonadditivity in protein–ligand binding is the basic factor that complicates structure–activity relationship (SAR) analysis: If the effect of adding a specific substituent to position A depends on the presence of another substituent in position B, no simple SAR picture à la “the scaffold series requires a small hydrophobic substituent in position A” or “the scaffold series requires a donor in position B” can be drawn. Nonadditivity indicates that behind the simple 2D chemical drawings, there are more complex physical processes going on and molecular interaction types change due to the combination of substituents. It is tempting to interpret nonadditivity as some kind of interaction between the substituents, but which interaction types should we expect at which level of nonadditivity? Here we attempt to shed light on the chemical features that lead to nonadditivity and lay the statistical basis to systematically analyze nonadditivity in drug design.
So far, nonadditivity in drug design has only been analyzed anecdotally and for single SAR series. A lot of work on nonadditivity has come from the Klebe group at the University of Marburg: Klebe and co-workers have analyzed a series of thrombin inhibitors and found that a loss in residual mobility, as observed in X-ray structures, can explain the nonadditivity observed.1 In another study combining ITC experiments and X-ray structure analysis, Klebe and co-workers have shown that for combinations of two R-groups, the water structure around thermolysin inhibiting peptides adapts in a very nonadditive way.2 In a comprehensive study on intramolecular hydrogen bonds, Kuhn et al. showed that nonadditive effects on physicochemical properties such as permeability, solubility, and logD can be explained with intramolecular hydrogen bonds.3 In another study, Kuhn et al. propose cooperative effects between mutually polarizing hydrogen bonds and other molecular interactions in interaction networks as a reason for nonadditivity.4 Hilpert et al. show that nonadditivity can result from a complete rearrangement inside the binding pocket.5 Lübbers et al. present a nice example where nonadditivity comes from the interaction of two substituents that do not fit into a small subpocket at the same time.6 Leung et al.7 and Schönherr and Cernak8 discuss “magic methyl” cases, compound pairs where the addition of a single methyl has a strongly beneficial effect on protein–ligand binding. Many of these cases can be rationalized with the methyl introducing a different conformation, which would lead to nonadditive effects for other substituents that upon introduction of the methyl point into different parts of the binding pocket. These examples indicate that nonadditivity should not be considered as a problem but rather as a key SAR feature that indicates changes in binding modes.
In biochemistry, additivity and cooperativity of ligand binding has been a long-standing topic.9−13 Cooperativity has extensively been studied for oxygen binding to hemoglobin, where the oxygen affinity of the four subunits depends on how many other subunits already have oxygen bound.14,15 In this system, there is a clear cooperative effect, since the hemoglobin ligands always bind to the same binding site in different subunits. In physical organic chemistry, nonadditivity as measured in chemical double mutant cycles has been used to quantify the interaction energy between functional groups.16−19 Key for the analysis of these experiments is that the relative orientation of the complexes remains the same for all complexes—only then differences in interaction energies can directly be interpreted as functional group interaction energies. For drug–protein complexes, this is rarely the case due to the complexity of the underlying macromolecular binding events.
Nonadditivity also poses problems to most automated SAR analysis approaches. Many approaches require additivity of functional group contributions: classic linear QSAR models, standard Matched Molecular Pair Analysis and Free-Wilson Analysis will clearly not work, if the effect of adding a substituent depends on the presence or absence of other substituents.20−22 Nonlinear machine learning approaches such as random forests or support vector machines are in principle capable of representing nonlinear relationships. Most scoring functions are not able to capture nonadditive effects within mutually reinforcing hydrogen bond networks and the water structure4—further improvement of these methods will therefore critically depend on a deeper understanding of nonadditivity. If we manage to understand the physical reasons for nonadditivity, we may be able to develop new ligand-based analysis schemes. For example, it might be very helpful if affinity data sets could be divided into subsets where all scaffolds have the same binding mode. Then, standard 2D methods may work on the subsets with much improved accuracy. However, achieving this goal requires an understanding of the factors that cause nonadditivity in structure–activity relationships.
In recent work, Klebe et al. have shown that flat SARs can contain strong nonadditivity in terms of the enthalpy–entropy profile.23 In this work, we focus on analyzing nonadditivity in the free energy of binding, since this still is the major criterion for ligand optimization. Further, understanding enthalpy–entropy effects is certainly more complex than understanding the free energy of binding, since small changes in protein conformations can have large effects on the enthalpy–entropy profile.24 Once the factors that drive entropy-enthalpy profiles are better understood, nonadditivity analysis can be extended to the entropy–enthalpy domain of molecular interactions.
The remaining paper is structured in three parts: First, we define the basics for the quantification of nonadditivity. Second, we theoretically analyze the impact of experimental uncertainty on the distribution of calculated nonadditivity on a whole SAR table and compare our findings to nonadditivity distributions observed in real data sets. This allows us to develop a tool to distinguish between real nonadditivity and artifacts from assay noise. Third, we analyze all well-characterized cases with strong nonadditivity, which are very unlikely to be caused by experimental uncertainty, on a structural level to develop an overview of the molecular origins of extreme nonadditivity.
Methods
Assembly of Double Transformation Cycles
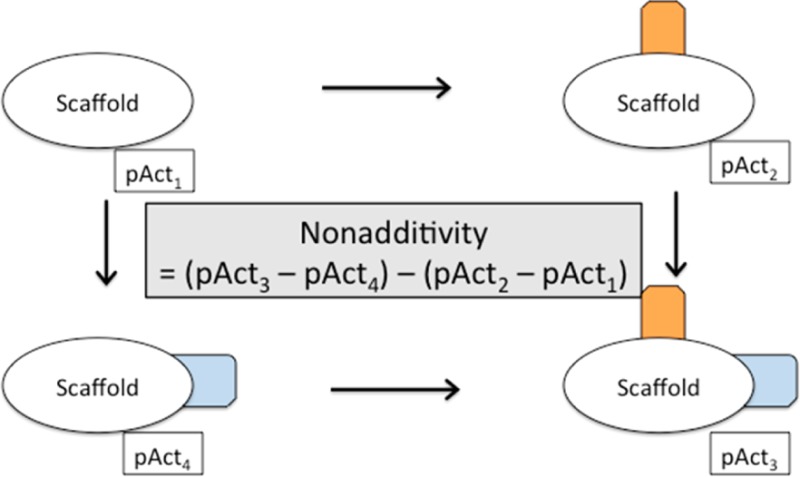
Nonadditivity can be determined from chemical double transformation cycles.17 Double transformation cycles consist of four molecules with the same scaffold and known binding affinity that are linked by two chemical transformations. A double transformation cycle is schematically shown in Figure 1.
Figure 1.
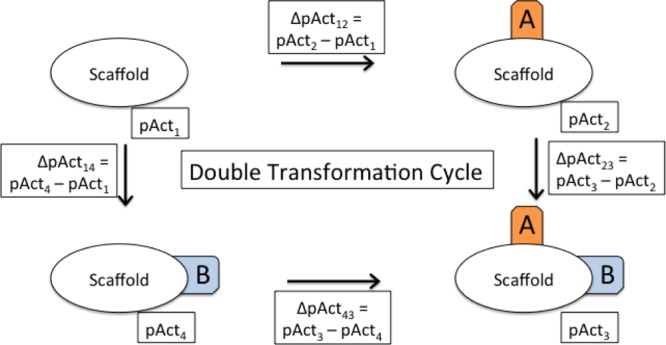
Schematic view of a double transformation cycle. Each cycle consists of four molecules with a common scaffold and all possible combinations of changing two substituents A and B (here indicated in orange and blue). The activities of the individual compounds are pAct1–4; the activity differences between two compounds are denoted by ΔpActnm.
If the effect of adding substituent B depends on the presence or absence of substituent A, the transformations are nonadditive. Nonadditivity can be quantified as the difference in change of affinity between adding substituent A in the presence and in the absence of substituent B. Since this is a closed thermodynamic cycle, it is the same as the difference of the change of affinity between adding substituent B in the presence and in the absence of substituent A. Mathematically, nonadditivity can be calculated as a single number according to
The sign of the nonadditivity will depend on the ordering of the molecules within the cycle. If the two transformations involve adding two substituents to a position where there has been a hydrogen before, the compound with the fewest heavy atoms can be placed in the upper left corner and the compound with the most heavy atoms in the lower right corner. Then, the sign of the calculated nonadditivity can be interpreted as positive or negative cooperativity. However, in general there will be a lot of transformations where one functional group is either moved or exchanged for another one. In such cases, there is no natural ordering within the cycles any more and the sign cannot be interpreted in terms of positive or negative cooperativity.
We implemented a python program that extracts all nonadditivity cycles from a given data set. It is based on python and the RDKit25 implementation of the Matched Molecular Pair Analysis (MMPA) Algorithm by Hussain and Rea.26 The matched pairs are the basis for the cycles where matched pair transformation connects two similar molecules. The Hussain and Rea MMPA implementation also yields transformations where linkers are exchanged. For further analysis after creating the full set of cycles, we removed all linker exchanges where the number of heavy atoms between the connecting atoms changes, since those are very likely to change the ligand geometry and nonadditivity should be expected for those cases. Note that cycles are assembled in a way that all four compounds have been measured in the same assay and have the same activity type so that pKi and pIC50 are not mixed. The code can use both the ChEMBL database27,28 and data sets in .txt file format as input. For the results presented here, we used version 18 of the ChEMBL database. Before assembling the cycles, we cleaned up the data by removing unrealistically high or low activity values, strange units, and measurements with a target confidence score below 4, as has been published before.29−33
Retrieval of Related X-ray Structures
We added a connection to the Protein Data Bank (PDB)34 that allows extracting X-ray structures with the same protein and similar ligands. The protein targets are matched via the Uniprot ID.35 Similarity is defined as the Tanimoto Coefficient (TC) between the current molecule and the small molecule ligand for a given protein target.36 The TC is calculated based on the standard RDKit Fingerprints25 that index very similar fragments as the classical Daylight Fingerprints. This approach allows to automatically link SAR data from ChEMBL to available X-ray structures that contain similar or identical ligands.
Expected Uncertainty Distribution for Nonadditivity Cycles
The nonadditivity distribution due to experimental uncertainty can be estimated according to the following considerations: If each measured value pActmeas is composed of a true value pActtrue and some experimental uncertainty εuncertainty
the overall nonadditivity can be calculated as
 |
Assuming that the experimental uncertainty of each individual measurement is drawn from the same normal distribution
the standard deviation of the contribution of the experimental uncertainties to the observed nonadditivities can be calculated using the addition rule for standard deviations (covariances need not be considered since the covariance between two random vectors is zero):
 |
The contribution of experimental uncertainty to the observed nonadditivities is thus twice as large as the contribution of the experimental uncertainty to the individually measured values. In order to quantitatively model the effect of experimental uncertainty, we need an estimate of the uncertainty of the individual activity values. Kramer et al. have previously estimated the experimental uncertainty of heterogeneous public pKi data to be 0.54 log units.31 For homogeneous pKi and pIC50 data, the uncertainty has been estimated to be around 0.2 log units.37 These are rather general estimates that should be replaced by more assay-specific data if available. Since better estimates are not available for most of the published data, we will use an estimated experimental uncertainty of 0.2 log units in the remaining analysis. If future studies show that the real experimental uncertainty is higher or lower, the calculations done here can easily be adapted.
We implemented a program that automatically extracts all nonadditivity cycles from a given SAR table or all ligand data for a specific target from CHEMBL. This program can be found in the Supporting Information.
Structural figures have been produced using maestro,38 and statistical plots have been created with R.39
Results
We extracted nonadditivity cycles for all CHEMBL targets with more than 1000 ligands that either have a Ki or IC50 value assigned. Overall, this yielded 44 519 nonadditivity cycles for 157 targets. For 14 607 of those cycles, there is at least one cocrystal structure available where the ligand has a similarity of 0.6 or greater to one of the compounds in the cycle. The number of nonadditivity cycles per target differs greatly, which reflects the number of compounds, and the number of SAR analogs that have been tested experimentally.
Distribution of Nonadditivity within the ChEMBL SAR Data
With an experimental uncertainty of 0.2 log units, the nonadditivity distribution due to noise on a full SAR data sets is expected to look like a Gaussian distribution with a mean of zero and a standard deviation of 0.4 log units. Figure 2 shows the theoretical nonadditivity distribution due to experimental uncertainty, and the real distribution of nonadditivities of all double transformation cycles for cytochrome P450 3A4 (CYP3A4, 63 cycles), human ether-a-go-go related gene product (hERG, 132 cycles), and Factor Xa (9FXa, 24 cycles) pKi data, extracted from CHEMBL18.
Figure 2.
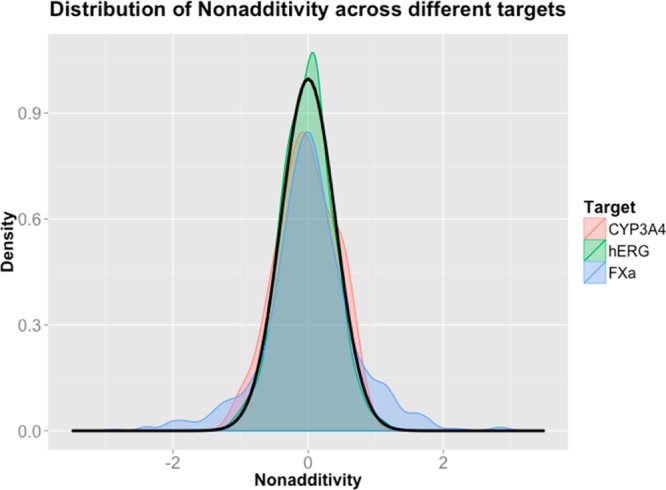
Theoretical nonadditivity distribution expected from an experimental uncertainty of 0.20 log units (black line), and real nonadditivity distribution for all CYP3A4 (red), hERG (green), and Factor Xa (blue) Ki data extracted from CHEMBL. Double transformation cycles have only been created for compounds that have all been measured in the same assay matched by ChEMBL assay IDs.
Figure 2 shows that most of the observed nonadditivity of the CYP3A4, hERG, and Factor Xa data sets can be explained with experimental uncertainty. In particular, the major peak in the middle of all three distributions can fully be explained by experimental uncertainty. While there might be some real nonadditivity in the cycles making up the majority of the data, it is impossible to identify any nonadditivity due to the experimental uncertainty. Only in the tails of the distributions that deviate from the normal distribution, in particular for Factor Xa, there are some cycles that cannot be explained by experimental uncertainty.
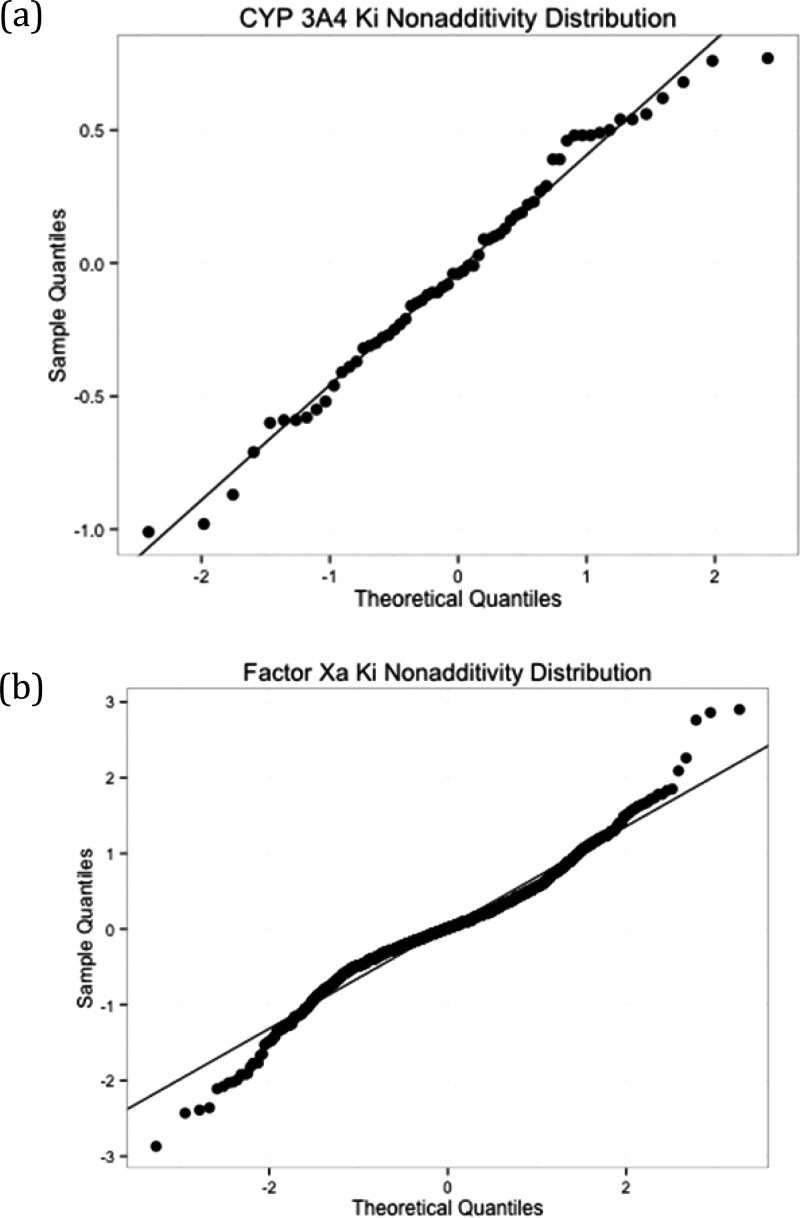
As a nonadditivity analysis tool, the deviation from normality can be visualized with normal probability plots.40 In normal probability plots, the observed quantile distribution is compared to an expected quantile distribution from a normal distribution. Deviations from a normal distribution can be seen as points deviating from the diagonal line. Figure 3 shows normal probability plots for the observed nonadditivities of the CYP3A4 data and the Factor Xa data.
Figure 3.
Normal probability plots for observed (a) CYP3A4 and (b) Factor Xa Ki nonadditivities. Note the different scaling of the x- and y-axes in both plots.
Figure 3 shows that while CYP3A4 nonadditivities fit quite well to a single normal distribution, stronger Factor Xa nonadditivities can clearly not be explained with a single normal distribution due to experimental uncertainty. Therefore, while there is statistical evidence for biochemical phenomena that lead to nonadditivity for Factor Xa data, there is little evidence for such phenomena in CYP3A4 Ki data, despite the apparent nonadditivity of some cycles at the extremes of the distribution.
Different targets show very different nonadditivity profiles. In Figure 4, we compare the nonadditivity profiles for MAO-B (1372 cycles), hERG, and MMP-2 (1538 cycles) data extracted from CHEMBL18.
Figure 4.
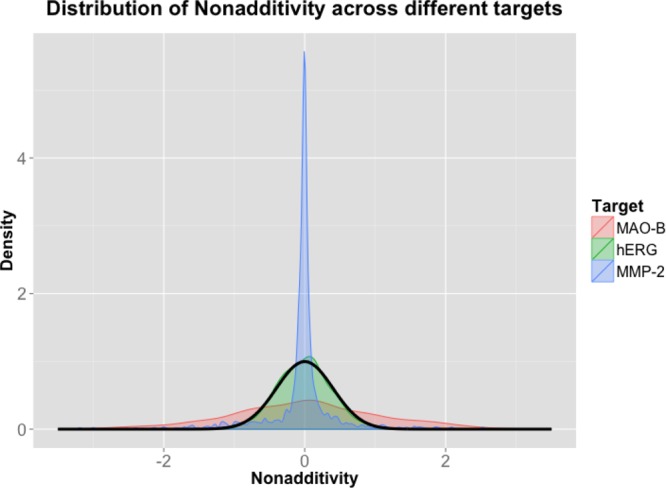
Nonadditivity profiles for MAO-B, hERG, and MMP-2. The black line indicates the nonadditivity distribution expected due to experimental uncertainty (σ = 0.20 log units).
Figure 4 shows that the nonadditivity profiles can differ a lot for different data sets. For MMP2, there is a very narrow central peak indicating perfect additivity of substituent contributions and many individual nonadditivities that do not follow a central Gaussian. On the other side, MAO-B nonadditivities follow a single very broad Gaussian. The differences in the central peaks may be explained by different experimental uncertainties due to different assay qualities. However, there might also be biochemical factors rooted in the nature of the different binding sites that lead to very different nonadditivity profiles. This raises the question how nonadditivity relates to promiscuity and the structure and dynamics of binding sites.41,42 Comparing the nature of the binding sites to the respective nonadditivity profiles may yield very important insights into binding site classes. Nonadditivity analysis provides the means to quantify those differences, which is not possible otherwise.
Structure-Based Analysis of Strong Nonadditivity
In the previous part, we have shown that only a small fraction of the nonadditivities should actually be interpreted, since we are not able to distinguish small nonadditivities from assay noise. In order to get an idea about the structural factors that cause nonadditivity, we decided to systematically inspect those double transformation cycles with strong nonadditivity and structural information. From the above prepared data set, we retained all cycles with a nonadditivity >2.0 log units and at least one cocrystal structure with a ligand similarity TC > 0.95. We found that for our purpose of understanding structural factors that lead to nonadditivity, structural interpretation is hardly possible if the highest similarity is below 0.95. The threshold of 2.0 log units is motivated by the 5σ rule, which is often used in physics as threshold for real discoveries (for example in the first announcement of the discovery of the Higgs Boson): if the experimental uncertainty of the individual measurement is 0.2 log units, σ of the nonadditivity distribution due to noise is 0.4 log units, and 2.0 log units is 5σ. The probability of observing a 5σ event by chance is roughly one in 3.5 million.
Overall, this process yielded 79 cycles for 24 distinct scaffold series on 20 different targets. Upon further inspection, we removed nine different scaffold series for four different reasons: Four of those series contained covalently binding ligands. We decided not to interpret the binding data for those ligands, since we cannot be sure that the reported IC50 data really represented equilibrium values. Three series were discarded due to errors in the data, including one of the covalently binding series. Two scaffold series were discarded since despite a TC of 0.95, the cocrystallized ligand was too different in the regions of interest to start generating any reasonable structural hypothesis. Finally, one series was discarded because of a discrepancy between the ligand published in the original publication and the model deposited at the PDB. We also checked the electron density for the ligand and the binding site of all X-ray structures where this was available and found sufficient electron density support for all modeled ligand poses analyzed in this contribution. A table summarizing all 79 cycles can be found in the Supporting Information.
We inspected the original publications and the PDB structures for the remaining 15 cycles to generate structural hypothesis that could explain the observed nonadditivity in SAR data. In five cases, the available X-ray structures showed that there can be alternative orientations of the central scaffold. Such findings imply that the ligands can completely reorient, depending on the substitution patterns. A complete reorientation of the scaffold can lead to strong nonadditivity, since the substituents then interact with completely different subpockets, yielding different contributions to the free energy of binding. Figure 5 shows an example for such a case: a set of estrogen receptor β ligands with an indenone scaffold, published by Malamas et al.43
Figure 5.
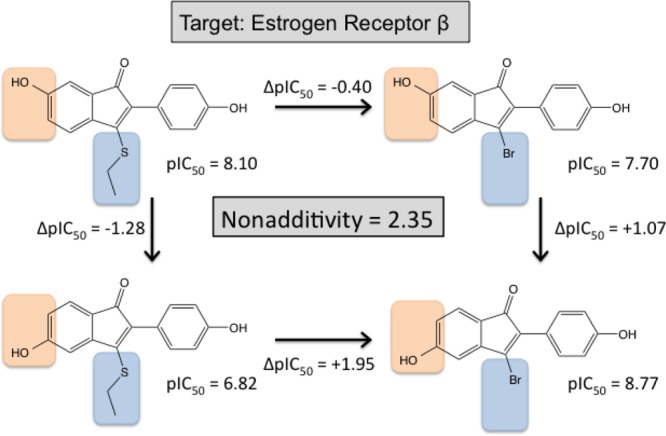
Double transformation cycle for 1H-inden-1-one derivatives binding to the estrogen β receptor.43
Here, the two highly nonadditive transformations are a shift of an aromatic hydroxy group by one position and an exchange of a thioethyl by a bromine. Shifting the hydroxy group on the thioethyl substituted indenone changes the pIC50 by 1.28 log units, whereas the same hydroxy shift changes the pIC50 on the bromine substituted scaffold by 1.07 log units in the other direction. From the same publication, there are also some more double transformation cycles with other similar scaffolds that show strong nonadditivity. The overlay of two estrogen receptor β X-ray structures (PDBID 1U3S(43) and 1U3Q(43)) with similar ligands that feature a benzisoxazole scaffold shows that the benzisoxazoles can be oriented in two completely different ways inside the binding pocket, as shown in Figure 6. If the indenone scaffolds are also completely reoriented due to different substitutions, nonadditivity can easily be explained: Within the different orientations, the bromine/thioethyl groups are exposed to different subpockets, form different molecular interactions, and therefore give very different contributions to the observed free energy of binding.
Figure 6.
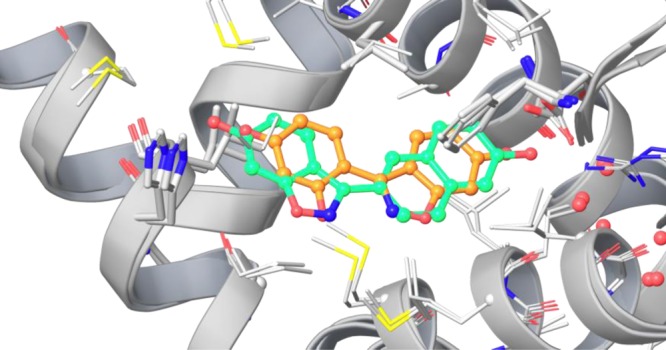
Alternative orientation of two benzisoxazole-based estrogen receptor β ligands (ligand in 1U3S green, 1U3Q orange).
In five other cases, there is evidence for either a direct interaction or a receptor-mediated interaction or concurrency between the substituents. An example for such a case (Figure 7) is a set of 2-aminobenzo[a]quinolizine based Dipeptidyl Peptidase IV (DPP-IV) inhibitors, published by Lübbers et al.6
Figure 7.
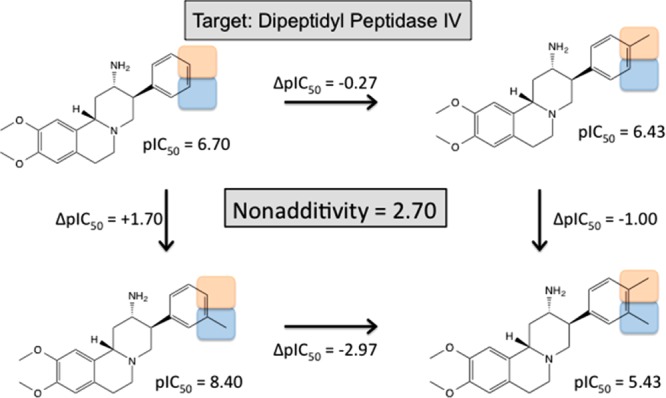
Double transformation cycle for aminobenzo[a]quinolizine derivatives binding to dipeptide peptidase IV (DPPIV).6
In this cycle, the transformations involve the introduction of two adjacent methyl groups in meta and para position of a terminal phenyl ring. Addition of the meta methyl group only increases the binding affinity by 1.70 log units. Addition of the para methyl group only decreases the binding affinity slightly by 0.27 log units. Addition of the meta methyl in the presence of the para methyl decreases the binding affinity by 1.00 log units. This nonadditive effect can be explained with the available X-ray structures, which have among others been generated to investigate this unexpected SAR phenomenon (see Figure 8).
Figure 8.
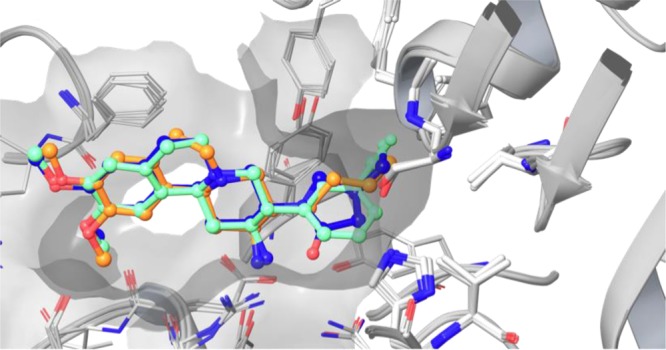
Alignment of three different aminobenzo[a]quinolizine based inhibitors (3KWJ44 green; 3KWF(45) blue; 3OC0(45) orange) in the DPP-IV binding pocket. The surface of the binding pocket is shown in gray, illustrating that a small meta substituent (CF substituent shown in green) optimally fills the S1 pocket.
The phenyl ring points into the apolar S1 pocket. A methyl group in meta position nicely fills the remaining space. The phenyl ring has to reorient slightly to enable accommodation of the methyl group in para position in the S1 pocket, leading to a subtle decrease in binding affinity. Since both methyl groups compete for the same space, the double-substituted compound is too large for the S1 pocket and this in turn leads to a strong decrease in binding affinity.
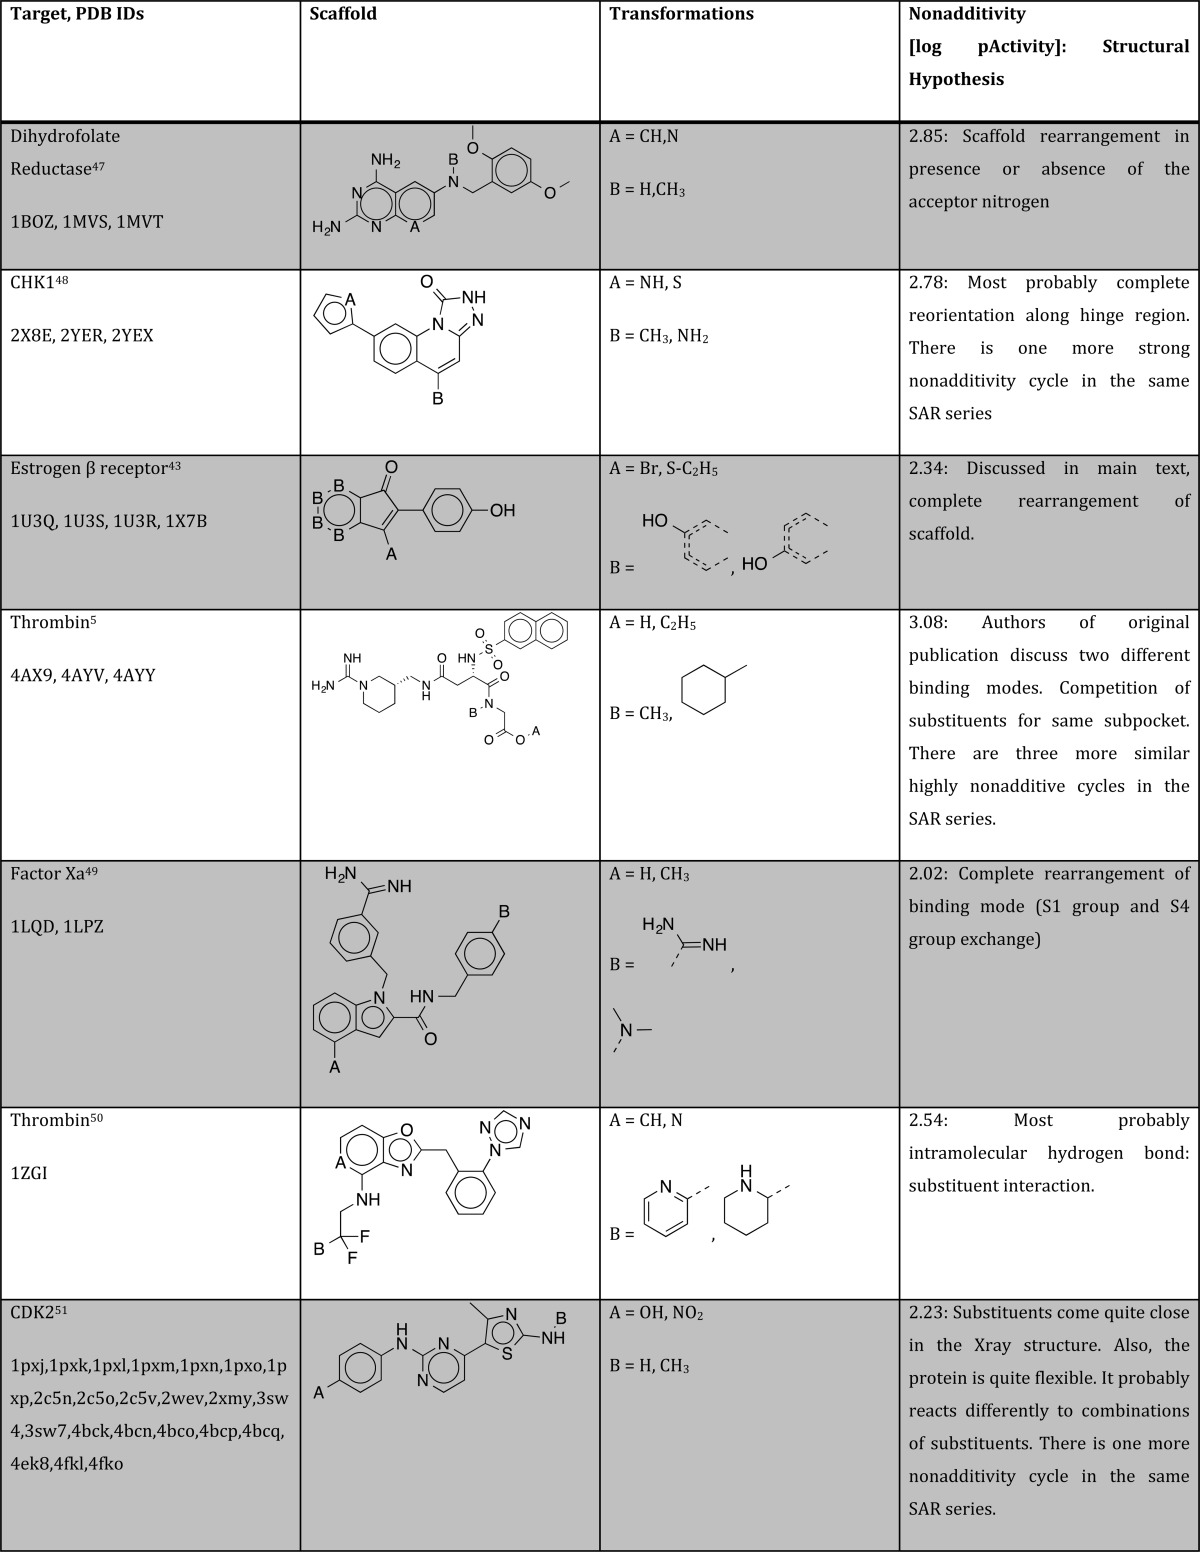
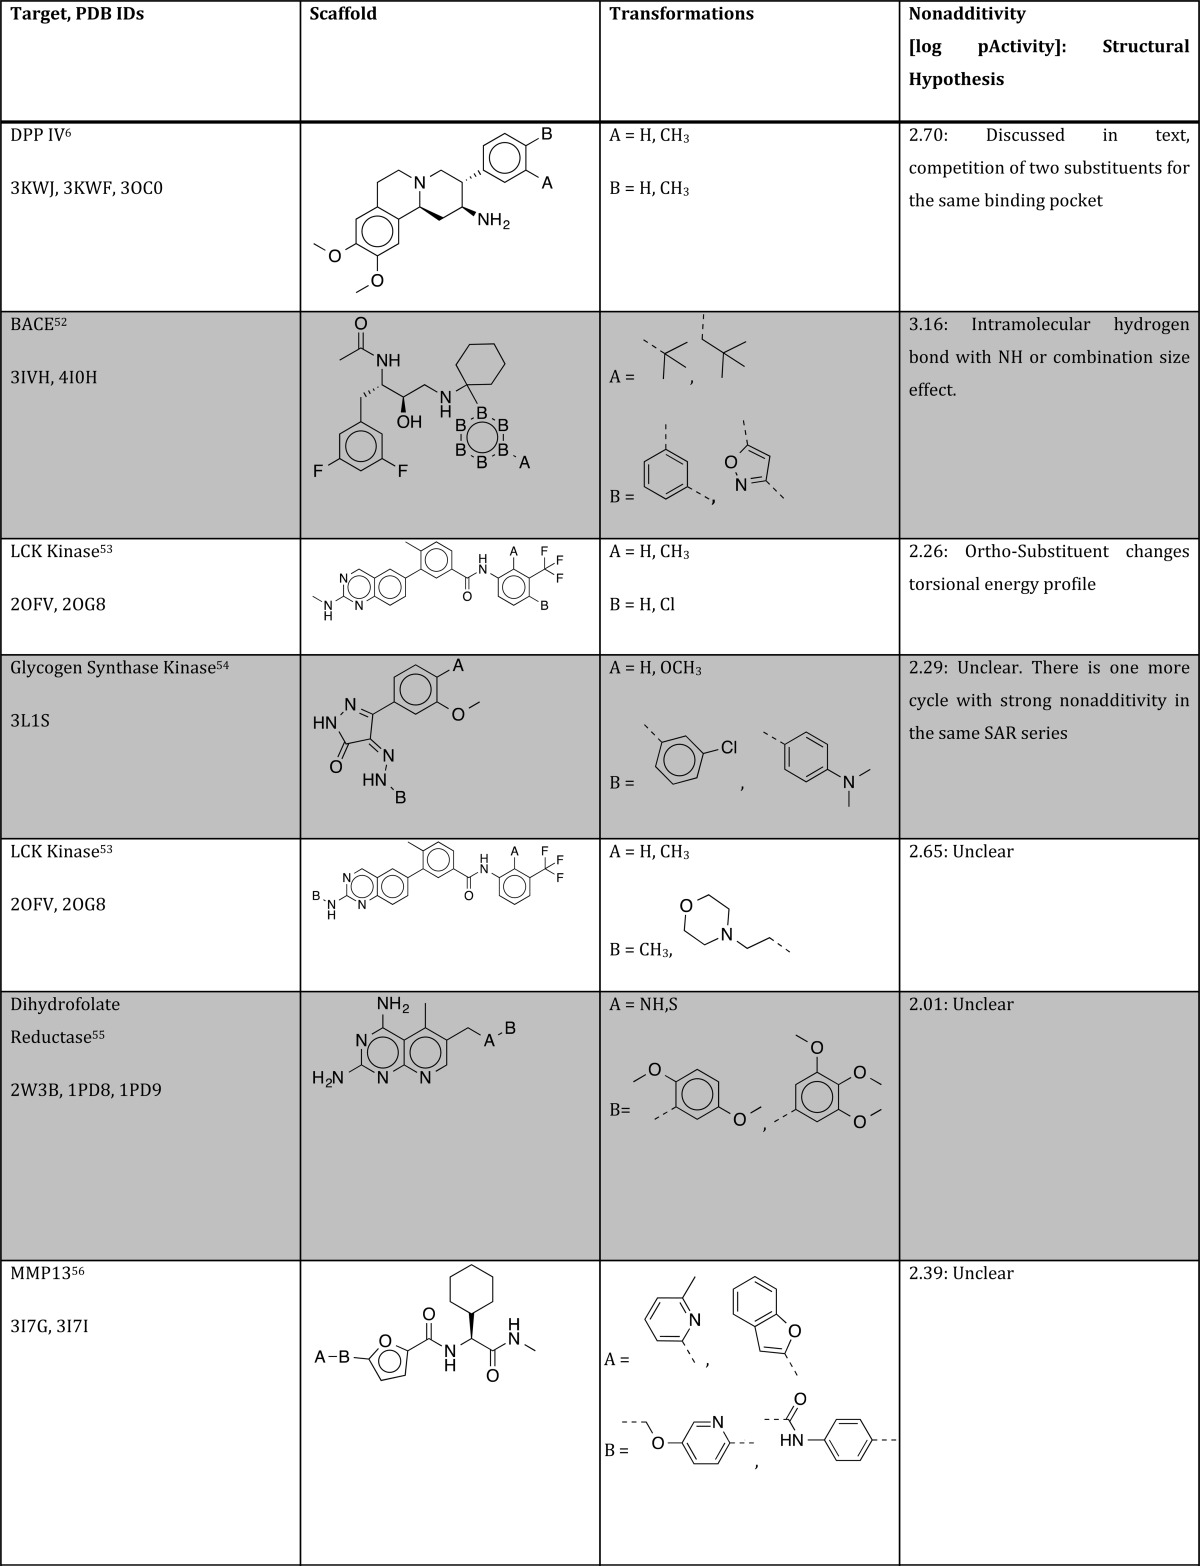
In the five remaining cases, there are helpful X-ray structures available, but we were not able to come up with a strong hypothesis by investigating the structures and studying the original literature. These cycles are particularly interesting for analyzing by advanced computational methods such as free energy perturbation (FEP)46 that could explain the observed nonadditivities. A summary over all cycles with strong nonadditivity and good X-ray structure coverage is given in Table 1.
Table 1. Summary of Structural Hypothesis to Explain Strong Nonadditivity for Different Protein/Ligand Systems.
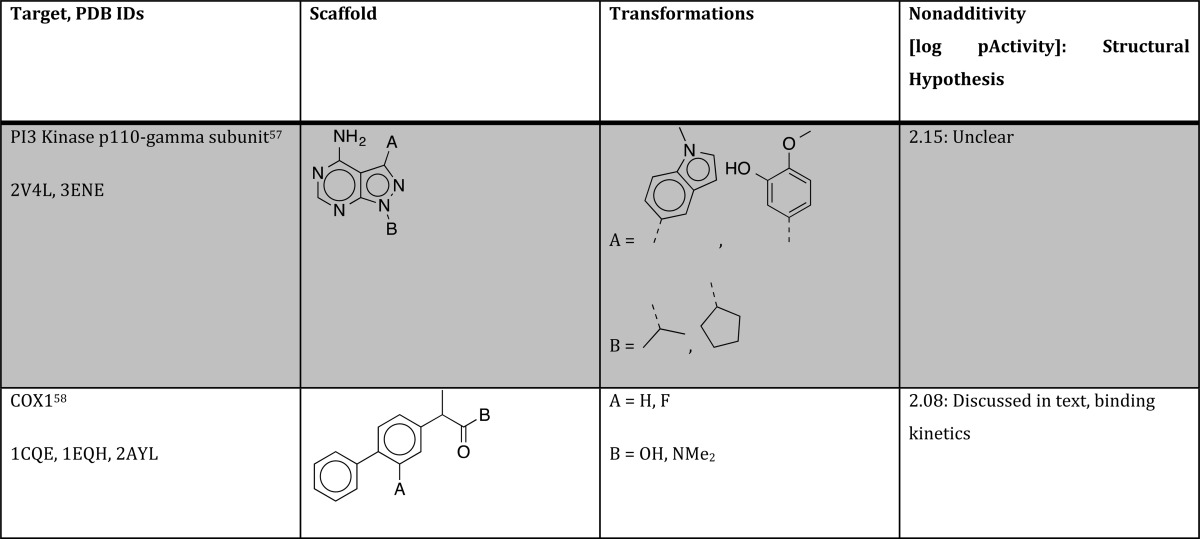
Studying the original publications of cycles with strong nonadditivities, we found one more nontrivial reason that may often remains undiscovered: slow tight binding behavior for some but not all ligands of a specific series. In a study of biprofen derivatives as COX-1 inhibitors, Gupta et al. found a highly nonadditive behavior that comes with a fluorine substitution of the central phenyl ring (turning biprofen into flubiprofene) and transformation of the carboxylic acid into a tertiary amide,58 as shown in Figure 9.
Figure 9.
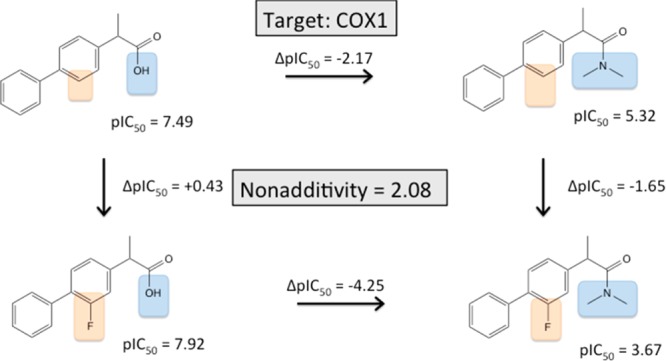
(Flu-)biprofen derivatization into a tertiary amide leads to highly nonadditive SAR data.
Adding a fluorine to the central ring system increases COX-1 binding by 0.43 log units. However, when the acid is transformed into an amide, the same fluorine substitution decreases the binding affinity by 1.65 log units. The authors found that the investigated carboxylic acids show a time-dependent inhibition mode, whereas amides and esters do not show this. In additional experiments, the authors could establish that the carboxylic acids show a two-state binding behavior, with the fast formation of a preequilibrium, followed by a slow inactivation. When the pKi for the fast formation of the preequilibrium is measured separately (biprofen pKi = 6.89, flubiprofen pKi = 6.0) and compared to the pIC50 values for the tertiary amides, the strong nonadditivity almost completely disappears. This shows that strong nonadditivity may not only indicate structural changes and concurrencies, but also identify assay anomalies that require deeper analysis.
Discussion
Nonadditivity is a key SAR feature that indicates important changes within the ligand series. Therefore, the analysis and interpretation of nonadditivity is a crucial step for rational drug design, which relies on three-dimensional rationalization of SAR. Up to now, nonadditivity has been analyzed anecdotally, but we believe that nonadditivity analysis should become a standard tool in the medicinal chemist’s toolbox. With the statistical basics introduced here to distinguish real nonadditivity from apparent nonadditivity due to assay noise, this is now possible in a statistically rigorous way.
In most situations, it is not possible to distinguish weak nonadditivity from assay noise—therefore, it is mandatory to compare the observed nonadditivity to the nonadditivity expected due to noise. Knowing the level of experimental uncertainty is crucial for nonadditivity analysis. Here, we assume a normally distributed experimental uncertainty with a standard deviation of 0.2 log units. While this probably overestimates the true uncertainty for very well established assays with many repeat measurements, in some cases it for sure also underestimates the true uncertainty. It is therefore very important to improve our understanding of experimental uncertainty by regular independent repeat measurements and a deeper scientific analysis of the roots of uncertainty. Once the uncertainty is known, normal probability plots can be a practical help in identifying the double transformation cycles that show real nonadditivity and deserve more detailed investigation.
Biochemically, there can be different phenomena that lead to nonadditivity in SAR data. In previous works, loss of residual mobility, nonadditive rearrangements in the water network, and intramolecular hydrogen bonds have been named among others. In our analysis of double transformation cycles with nonadditivities >2.0 log units, we found evidence that complete structural rearrangements and substituent interactions can explain ten out of the 15 cycles. In a recent study on a series of Endothiapepsin inhibitors, Klebe and co-workers showed that chemically closely related compounds can have rather different binding poses.59 Structural rearrangements can explain otherwise inconclusive SAR and might occur much more frequently than is usually expected. In the other five cases, the available X-ray structures do not give a clear hint toward a single biochemical reason that could explain these cases of extreme nonadditivity. This is not due to the absence of a good reason but most probably due to the absence of a convincing set of experimental or computational results that can explain the nonadditivity. It should also be kept in mind that the combination of transformations can have nonadditive effects on solubility, and impurities or degradation can also cause apparent nonadditivity. We cannot control such effects in this retrospective study and hope such reasons have been ruled out in literature data, but these basic quality control checks are among the first things to be done if possible.
There is a tight analogy between activity cliffs60,61 and cases with strong nonadditivity (which could also be called additivity cliffs): While activity cliffs indicate the formation of key interactions, strong nonadditivity indicates that key interactions are changing due to the presence/absence of other substituents. Strong nonadditivity is a 2D indicator for a dynamic 3D behavior. If the key substitutions that cause a change in conformation are properly understood, it possibly allows dividing a SAR data sets into subsets that have the same orientation inside the binding pocket.
Computational models could be of great help here, and future development of these can benefit from the strong nonadditivity examples: In order to be useful, FEP approaches should be able to model the strong nonadditivity, if direct or indirect substituent interactions are involved. Note that 2 log units nonadditivity, which at room temperature corresponds to a difference of roughly 2.8 kcal/mol in binding free energy, is way above 1 kcal/mol, which is often cited as the difference threshold that can be described by higher-level computational methods.62 If the scaffolds completely reorient, docking/scoring approaches should be able to predict the correct pose. From a different perspective, strong nonadditivity cycles represent ideal test cases for the validation and further development of scoring functions and FEP approaches, since the effects of a lot of interactions cancel out in the cycles and only very few interactions lead to major differences in affinity.
Free Wilson analysis does not work in the presence of strong nonadditivity, since it relies on the same contribution from the same substituent in all cases. If a ligand exposes the same substituent to different subpockets, based on the presence or absence of other substituents, the contribution to the free energy of binding may differ dramatically depending on the subpocket. However, if the reason for nonadditivity is understood and the SAR data sets can be divided in subgroups for the different binding modes, Free Wilson Analysis should work within the different subgroups. For example, a ligand could have two distinct orientations inside the binding site. This would show up as a bimodal distribution in the increments for substitutions in specific positions. If there are bimodal distributions for specific substituents and the partner substituents that cause a rearrangement are known, the overall data sets can be split into orientation A and orientation B and Free Wilson Analysis might then work again for the split sets. For such situations, the most important task will be to identify key substituents that trigger rearrangements of the binding pose.
Knowledge of the experimental uncertainty plays a central role in nonadditivity analysis, since uncertainty can cause a substantial amount of apparent nonadditivity, in particular if many double transformation cycles are analyzed. If the experimental uncertainty in the data is neglected or underestimated, there is a risk that structural reasons for nonadditivity are searched where in fact there are none. This leads to a waste of human and/or computational resources and data overinterpretation.
The nonadditivity profile of specific targets contains features that may be very interesting for further analysis. On the one hand, it may be possible to estimate the experimental uncertainty of a set of experiments from the width of the central peak in the nonadditivity profile. This might be an elegant way to obtain this very important number, which can otherwise only be obtained from independently repeated measurements that are often not available. On the other hand, the nonadditivity profile may be characteristic for the nature of the binding site. In our analysis, promiscuous targets such as hERG and CYP3A4 show a lot less nonadditivity than for example Factor Xa or MMP2. Whether this is due to the fact that targets such as hERG or CYP3A4 have much more continuum-like binding sites that do not fit Ehrlich’s lock-and-key concept63 is a topic for future studies.
With the statistical basics defined in this work, nonadditivity can systematically be analyzed in SAR data sets. The more nonadditivity comes into the focus of SAR analysis, the more we will learn about structural features that cause nonadditivity. Most of the existing structural information for cycles with strong nonadditivity has been generated to explain the nonadditivity observed. However, in the other cases, strong nonadditivity is often not discussed in the primary publications, leaving a central part of the SAR unexplained. If automated nonadditivity analysis becomes a standard tool, the risk of missing key SAR information from nonadditivity cycles will be decreased. Following the 5σ rule, we have here concentrated on those 15 cycles where we are very sure that we do not interpret assay noise. However, this threshold can probably be set at a lower point, revealing much more nonadditivity cycles with structural information which can give valuable information for rational drug design. With the growing number of data in X-ray structure and bioactivity databases, there will be even more possibilities for systematic nonadditivity analysis in the future.
Summary
Strong nonadditivity is an important SAR feature that can provide hints toward structural rearrangements or substituent concurrencies and interactions. Therefore, nonadditivity analysis is an integral part of the SAR analysis toolbox. Experimental uncertainty can have a strong impact on the observed nonadditivity. It needs to be taken into account when searching for strong nonadditivities, otherwise there is a non-negligible risk of overinterpreting assay artifacts.
We have analyzed double transformation cycles with nonadditivity >2.0 log units for which there was sufficient structural information available. For five cycles, we found that there is good evidence that a complete rearrangement of the ligand in the binding site causes the nonadditivity. For five other cycles, we found that there is good evidence that direct or indirect substituent interactions cause the observed nonadditivity. For the remaining five cycles, we did not find a clear structural hint toward what is going on, and further calculations and analyses need to be done to reveal the source of nonadditivity.
Since nonadditivity is such a fundamental and important SAR pattern, we expect that there will be a lot more detailed analyses about the biochemical sources of nonadditivity and how we can use them in future drug design. Herein, we provide the basic statistical and cheminformatic methods for further exploration of this emerging field in medicinal chemistry.
Acknowledgments
This work was supported in part by the Austrian Science Fund FWF project P23051 “Targeting Influenza Neuraminidase”.
Supporting Information Available
Program used to generate the double transformation cycles and an excel sheet with all double transformation cycles. This material is available free of charge via the Internet at http://pubs.acs.org.
Author Present Address
§ Small Molecule Research, Fa. Hoffmann–La Roche Ltd., Roche Innovation Center Basel, 4070-Basel, Switzerland.
The authors declare no competing financial interest.
Supplementary Material
References
- Baum B.; Muley L.; Smolinski M.; Heine A.; Hangauer D.; Klebe G. Non-Additivity of Functional Group Contributions in Protein–Ligand Binding: A Comprehensive Study by Crystallography and Isothermal Titration Calorimetry. J. Mol. Biol. 2010, 397, 1042–1054. [DOI] [PubMed] [Google Scholar]
- Biela A.; Betz M.; Heine A.; Klebe G. Water Makes the Difference: Rearrangement of Water Solvation Layer Triggers Non-Additivity of Functional Group Contributions in Protein–Ligand Binding. ChemMedChem 2012, 7, 1423–1434. [DOI] [PubMed] [Google Scholar]
- Kuhn B.; Mohr P.; Stahl M. Intramolecular Hydrogen Bonding in Medicinal Chemistry. J. Med. Chem. 2010, 53, 2601–2611. [DOI] [PubMed] [Google Scholar]
- Kuhn B.; Fuchs J. E.; Reutlinger M.; Stahl M.; Taylor N. R. Rationalizing Tight Ligand Binding through Cooperative Interaction Networks. J. Chem. Inf. Model. 2011, 51, 3180–3198. [DOI] [PMC free article] [PubMed] [Google Scholar]
- Hilpert K.; Ackermann J.; Banner D. W.; Gast A.; Gubernator K.; Hadvary P.; Labler L.; Mueller K.; Schmid G. Design and Synthesis of Potent and Highly Selective Thrombin Inhibitors. J. Med. Chem. 1994, 37, 3889–3901. [DOI] [PubMed] [Google Scholar]
- Lübbers T.; Böhringer M.; Gobbi L.; Hennig M.; Hunziker D.; Kuhn B.; Löffler B.; Mattei P.; Narquizian R.; Peters J.-U.; Ruff Y.; Wessel H. P.; Wyss P. 1,3-Disubstituted 4-Aminopiperidines as Useful Tools in the Optimization of the 2-Aminobenzo[a]quinolizine Dipeptidyl Peptidase IV Inhibitors. Bioorg. Med. Chem. Lett. 2007, 17, 2966–2970. [DOI] [PubMed] [Google Scholar]
- Leung C. S.; Leung S. S. F.; Tirado-Rives J.; Jorgensen W. L. Methyl Effects on Protein–Ligand Binding. J. Med. Chem. 2012, 55, 4489–4500. [DOI] [PMC free article] [PubMed] [Google Scholar]
- Schönherr H.; Cernak T. Profound Methyl Effects in Drug Discovery and a Call for New C•H Methylation Reactions. Angew. Chem., Int. Ed. 2013, 52, 12256–12267. [DOI] [PubMed] [Google Scholar]
- Jencks W. P. On the Attribution and Additivity of Binding Energies. Proc. Natl. Acad. Sci. U. S. A. 1981, 78, 4046–4050. [DOI] [PMC free article] [PubMed] [Google Scholar]
- Dill K. A. Additivity Principles in Biochemistry. J. Biol. Chem. 1997, 272, 701–704. [DOI] [PubMed] [Google Scholar]
- Szwajkajzer D.; Carey J. Molecular and Biological Constraints on Ligand-Binding Affinity and Specificity. Biopolymers 1997, 44, 181–198. [DOI] [PubMed] [Google Scholar]
- Abeliovich H. An Empirical Extremum Principle for the Hill Coefficient in Ligand-Protein Interactions Showing Negative Cooperativity. Biophys. J. 2005, 89, 76–79. [DOI] [PMC free article] [PubMed] [Google Scholar]
- Carter P. J.; Winter G.; Wilkinson A. J.; Fersht A. R. The Use of Double Mutants to Detect Structural Changes in the Active Site of the Tyrosyl-tRNA Synthetase (Bacillus Stearothermophilus). Cell 1984, 38, 835–840. [DOI] [PubMed] [Google Scholar]
- Hill A. The Combinations of Haemoglobin with Oxygen and Carbon Monoxide, and the Effects of Acid and Carbon Dioxide. Biochem. J. 1921, 15, 577–586. [DOI] [PMC free article] [PubMed] [Google Scholar]
- Perutz M. F. Mechanisms of Cooperativity and Allosteric Regulation in Proteins. Q. Rev. Biophys. 1989, 22, 139–237. [DOI] [PubMed] [Google Scholar]
- Cockroft S. L.; Hunter C. A. Chemical Double-Mutant Cycles: Dissecting Non-Covalent Interactions. Chem. Soc. Rev. 2007, 36, 172–188. [DOI] [PubMed] [Google Scholar]
- Camara-Campos A.; Musumeci D.; Hunter C. A.; Turega S. Chemical Double Mutant Cycles for the Quantification of Cooperativity in H-Bonded Complexes. J. Am. Chem. Soc. 2009, 131, 18518–18524. [DOI] [PubMed] [Google Scholar]
- Kato Y.; Conn M. M.; Rebek J. J. Water-Soluble Receptors for Cyclic-AMP and Their Use for Evaluating Phosphate-Guanidinium Interactions. J. Am. Chem. Soc. 1994, 116, 3279–3284. [Google Scholar]
- Aoyama Y.; Asakawa M.; Yamagishi A.; Toi H.; Ogoshi H. Simultaneous Hydrogen Bonding and Metal Coordination Interactions in the Two-Point Fixation of Amino Acids with a Bifunctional Metalloporphyrin Receptor. J. Am. Chem. Soc. 1990, 112, 3145–3151. [Google Scholar]
- Sheridan R. P.; Hunt P.; Culberson J. C. Molecular Transformations as a Way of Finding and Exploiting Consistent Local QSAR. J. Chem. Inf. Model. 2006, 46, 180–192. [DOI] [PubMed] [Google Scholar]
- Patel Y.; Gillet V. J.; Howe T.; Pastor J.; Oyarzabal J.; Willett P. Assessment of Additive/Nonadditive Effects in Structure–Activity Relationships: Implications for Iterative Drug Design. J. Med. Chem. 2008, 51, 7552–7562. [DOI] [PubMed] [Google Scholar]
- Kramer C.; Fuchs J. E.; Whitebread S.; Gedeck P.; Liedl K. R. Matched Molecular Pair Analysis: Significance and the Impact of Experimental Uncertainty. J. Med. Chem. 2014, 57, 3786–3802. [DOI] [PubMed] [Google Scholar]
- Krimmer S. G.; Betz M.; Heine A.; Klebe G. Methyl, Ethyl, Propyl, Butyl: Futile But Not for Water, as the Correlation of Structure and Thermodynamic Signature Shows in a Congeneric Series of Thermolysin Inhibitors. ChemMedChem. 2014, 9, 833–846. [DOI] [PubMed] [Google Scholar]
- Fenley A. T.; Muddana H. S.; Gilson M. K. Entropy-Enthalpy Transduction Caused by Conformational Shifts Can. Obscure the Forces Driving Protein-Ligand Binding. Proc. Natl. Acad. Sci. U. S. A. 2012, 109, 20006–20011. [DOI] [PMC free article] [PubMed] [Google Scholar]
- Landrum G.RDKit; 2013; www.rdkit.org.
- Hussain J.; Rea C. Computationally Efficient Algorithm to Identify Matched Molecular Pairs (MMPs) in Large Data Sets. J. Chem. Inf. Model. 2010, 50, 339–348. [DOI] [PubMed] [Google Scholar]
- Gaulton A.; Bellis L. J.; Bento A. P.; Chambers J.; Davies M.; Hersey A.; Light Y.; McGlinchey S.; Michalovich D.; Al-Lazikani B.; Overington J. P. ChEMBL: A Large-Scale Bioactivity Database for Drug Discovery. Nucleic Acids Res. 2011, 40, D1100–D1107. [DOI] [PMC free article] [PubMed] [Google Scholar]
- Bento A. P.; Gaulton A.; Hersey A.; Bellis L. J.; Chambers J.; Davies M.; Krüger F. A.; Light Y.; Mak L.; McGlinchey S.; Nowotka M.; Papadatos G.; Santos R.; Overington J. P. The ChEMBL Bioactivity Database: An Update. Nucleic Acids Res. 2014, 42, D1083–1090. [DOI] [PMC free article] [PubMed] [Google Scholar]
- Hu Y.; Bajorath J. Influence of Search Parameters and Criteria on Compound Selection, Promiscuity, and Pan Assay Interference Characteristics. J. Chem. Inf. Model. 2014, 54, 3056–3066. [DOI] [PubMed] [Google Scholar]
- Stumpfe D.; Bajorath J. Assessing the Confidence Level of Public Domain Compound Activity Data and the Impact of Alternative Potency Measurements on SAR Analysis. J. Chem. Inf. Model. 2011, 51, 3131–3137. [DOI] [PubMed] [Google Scholar]
- Kramer C.; Kalliokoski T.; Gedeck P.; Vulpetti A. The Experimental Uncertainty of Heterogeneous Public Ki Data. J. Med. Chem. 2012, 55, 5165–5173. [DOI] [PubMed] [Google Scholar]
- Kramer C.; Lewis R. QSARs, Data and Error in the Modern Age of Drug Discovery. Curr. Top. Med. Chem. 2012, 12, 1896–1902. [DOI] [PubMed] [Google Scholar]
- Kalliokoski T.; Kramer C.; Vulpetti A. Quality Issues with Public Domain Chemogenomics Data. Mol. Inform. 2013, 32, 898–905. [DOI] [PubMed] [Google Scholar]
- Berman H. M.; Westbrook J.; Feng Z.; Gilliland G.; Bhat T. N.; Weissig H.; Shindyalov I. N.; Bourne P. E. The Protein Data Bank. Nucleic Acids Res. 2000, 28, 235–242. [DOI] [PMC free article] [PubMed] [Google Scholar]
- Activities at the Universal Protein Resource (UniProt). Nucleic Acids Res. 2014, 42, D191–D198. [DOI] [PMC free article] [PubMed] [Google Scholar]
- Jaccard P. Distribution de La Flore Alpine Dans Le Bassin Des Dranses et Dans Quelques Régions Voisines. Bull. Soc. Vaudoise Sci. Nat. 1901, 37, 241–272. [Google Scholar]
- Kalliokoski T.; Kramer C.; Vulpetti A.; Gedeck P. Comparability of Mixed IC50 Data – A Statistical Analysis. PLoS One 2013, 8, e61007. [DOI] [PMC free article] [PubMed] [Google Scholar]
- Schrödinger Release 2014–4: Maestro; Schrödinger, LLC: New York, NY, 2014. [Google Scholar]
- R Development Team. R: A Language and Environment for Statistical Computing; Vienna, Austria, 2008.
- Graphical Methods for Data Analysis; The Wadsworth statistics/probability series; Wadsworth International Group; Duxbury Press: Belmont, CA, Boston, 1983. [Google Scholar]
- Hu Y.; Gupta-Ostermann D.; Bajorath J. Exploring Compound Promiscuity Patterns and Multi-Target Activity Spaces. Comput. Struct. Biotechnol. J. 2014, 9, e201401003. [DOI] [PMC free article] [PubMed] [Google Scholar]
- Fuchs J. E.; von Grafenstein S.; Huber R. G.; Wallnoefer H. G.; Liedl K. R. Specificity of a Protein-Protein Interface: Local Dynamics Direct Substrate Recognition of Effector Caspases. Proteins 2014, 82, 546–555. [DOI] [PMC free article] [PubMed] [Google Scholar]
- Malamas M. S.; Manas E. S.; McDevitt R. E.; Gunawan I.; Xu Z. B.; Collini M. D.; Miller C. P.; Dinh T.; Henderson R. A.; Keith J. C.; Harris H. A. Design and Synthesis of Aryl Diphenolic Azoles as Potent and Selective Estrogen Receptor-B Ligands. J. Med. Chem. 2004, 47, 5021–5040. [DOI] [PubMed] [Google Scholar]
- Boehringer M.; Fischer H.; Hennig M.; Hunziker D.; Huwyler J.; Kuhn B.; Loeffler B. M.; Luebbers T.; Mattei P.; Narquizian R.; Sebokova E.; Sprecher U.; Wessel H. P. Aryl- and Heteroaryl-Substituted Aminobenzo[a]quinolizines as Dipeptidyl Peptidase IV Inhibitors. Bioorg. Med. Chem. Lett. 2010, 20, 1106–1108. [DOI] [PubMed] [Google Scholar]
- Mattei P.; Boehringer M.; Di Giorgio P.; Fischer H.; Hennig M.; Huwyler J.; Koçer B.; Kuhn B.; Loeffler B. M.; MacDonald A.; Narquizian R.; Rauber E.; Sebokova E.; Sprecher U. Discovery of Carmegliptin: A Potent and Long-Acting Dipeptidyl Peptidase IV Inhibitor for the Treatment of Type 2 Diabetes. Bioorg. Med. Chem. Lett. 2010, 20, 1109–1113. [DOI] [PubMed] [Google Scholar]
- Kim J. T.; Hamilton A. D.; Bailey C. M.; Domaoal R. A.; Domoal R. A.; Wang L.; Anderson K. S.; Jorgensen W. L. FEP-Guided Selection of Bicyclic Heterocycles in Lead Optimization for Non-Nucleoside Inhibitors of HIV-1 Reverse Transcriptase. J. Am. Chem. Soc. 2006, 128, 15372–15373. [DOI] [PubMed] [Google Scholar]
- Gangjee A.; Vidwans A. P.; Vasudevan A.; Queener S. F.; Kisliuk R. L.; Cody V.; Li R.; Galitsky N.; Luft J. R.; Pangborn W. Structure-Based Design and Synthesis of Lipophilic 2,4-Diamino-6-Substituted Quinazolines and Their Evaluation as Inhibitors of Dihydrofolate Reductases and Potential Antitumor Agents 1. J. Med. Chem. 1998, 41, 3426–3434. [DOI] [PubMed] [Google Scholar]
- Oza V.; Ashwell S.; Brassil P.; Breed J.; Ezhuthachan J.; Deng C.; Grondine M.; Horn C.; Liu D.; Lyne P.; Newcombe N.; Pass M.; Read J.; Su M.; Toader D.; Yu D.; Yu Y.; Zabludoff S. Synthesis and Evaluation of Triazolones as Checkpoint Kinase 1 Inhibitors. Bioorg. Med. Chem. Lett. 2012, 22, 2330–2337. [DOI] [PubMed] [Google Scholar]
- Matter H.; Defossa E.; Heinelt U.; Blohm P.-M.; Schneider D.; Müller A.; Herok S.; Schreuder H.; Liesum A.; Brachvogel V.; Lönze P.; Walser A.; Al-Obeidi F.; Wildgoose P. Design and Quantitative Structure–Activity Relationship of 3-Amidinobenzyl-1 H -Indole-2-Carboxamides as Potent, Nonchiral, and Selective Inhibitors of Blood Coagulation Factor Xa. J. Med. Chem. 2002, 45, 2749–2769. [DOI] [PubMed] [Google Scholar]
- Deng J. Z.; McMasters D. R.; Rabbat P. M. A.; Williams P. D.; Coburn C. A.; Yan Y.; Kuo L. C.; Lewis S. D.; Lucas B. J.; Krueger J. A.; Strulovici B.; Vacca J. P.; Lyle T. A.; Burgey C. S. Development of an Oxazolopyridine Series of Dual Thrombin/factor Xa Inhibitors via Structure-Guided Lead Optimization. Bioorg. Med. Chem. Lett. 2005, 15, 4411–4416. [DOI] [PubMed] [Google Scholar]
- Wang S.; Meades C.; Wood G.; Osnowski A.; Anderson S.; Yuill R.; Thomas M.; Mezna M.; Jackson W.; Midgley C.; Griffiths G.; Fleming I.; Green S.; McNae I.; Wu S.-Y.; McInnes C.; Zheleva D.; Walkinshaw M. D.; Fischer P. M. 2-Anilino-4-(thiazol-5-Yl)pyrimidine CDK Inhibitors: Synthesis, SAR Analysis, X-Ray Crystallography, and Biological Activity. J. Med. Chem. 2004, 47, 1662–1675. [DOI] [PubMed] [Google Scholar]
- Sealy J. M.; Truong A. P.; Tso L.; Probst G. D.; Aquino J.; Hom R. K.; Jagodzinska B. M.; Dressen D.; Wone D. W. G.; Brogley L.; John V.; Tung J. S.; Pleiss M. A.; Tucker J. A.; Konradi A. W.; Dappen M. S.; Toth G.; Pan H.; Ruslim L.; Miller J.; Bova M. P.; Sinha S.; Quinn K. P.; Sauer J.-M. Design and Synthesis of Cell Potent BACE-1 Inhibitors: Structure–activity Relationship of P1′ Substituents. Bioorg. Med. Chem. Lett. 2009, 19, 6386–6391. [DOI] [PubMed] [Google Scholar]
- DiMauro E. F.; Newcomb J.; Nunes J. J.; Bemis J. E.; Boucher C.; Buchanan J. L.; Buckner W. H.; Cee V. J.; Chai L.; Deak H. L.; Epstein L. F.; Faust T.; Gallant P.; Geuns-Meyer S. D.; Gore A.; Gu Y.; Henkle B.; Hodous B. L.; Hsieh F.; Huang X.; Kim J. L.; Lee J. H.; Martin M. W.; Masse C. E.; McGowan D. C.; Metz D.; Mohn D.; Morgenstern K. A.; Oliveira-dos-Santos A.; Patel V. F.; Powers D.; Rose P. E.; Schneider S.; Tomlinson S. A.; Tudor Y.-Y.; Turci S. M.; Welcher A. A.; White R. D.; Zhao H.; Zhu L.; Zhu X. Discovery of Aminoquinazolines as Potent, Orally Bioavailable Inhibitors of Lck: Synthesis, SAR, and in Vivo Anti-Inflammatory Activity. J. Med. Chem. 2006, 49, 5671–5686. [DOI] [PubMed] [Google Scholar]
- Arnost M.; Pierce A.; Haar E.; Lauffer D.; Madden J.; Tanner K.; Green J. 3-Aryl-4-(arylhydrazono)-1H-Pyrazol-5-Ones: Highly Ligand Efficient and Potent Inhibitors of GSK3β. Bioorg. Med. Chem. Lett. 2010, 20, 1661–1664. [DOI] [PubMed] [Google Scholar]
- Debnath A. K. Pharmacophore Mapping of a Series of 2,4-Diamino-5-Deazapteridine Inhibitors of Mycobacterium Avium Complex Dihydrofolate Reductase. J. Med. Chem. 2002, 45, 41–53. [DOI] [PubMed] [Google Scholar]
- Heim-Riether A.; Taylor S. J.; Liang S.; Gao D. A.; Xiong Z.; Michael August E.; Collins B. K.; Farmer B. T.; Haverty K.; Hill-Drzewi M.; Junker H.-D.; Mariana Margarit S.; Moss N.; Neumann T.; Proudfoot J. R.; Keenan L. S.; Sekul R.; Zhang Q.; Li J.; Farrow N. A. Improving Potency and Selectivity of a New Class of Non-Zn-Chelating MMP-13 Inhibitors. Bioorg. Med. Chem. Lett. 2009, 19, 5321–5324. [DOI] [PubMed] [Google Scholar]
- Apsel B.; Blair J. A.; Gonzalez B.; Nazif T. M.; Feldman M. E.; Aizenstein B.; Hoffman R.; Williams R. L.; Shokat K. M.; Knight Z. A. Targeted Polypharmacology: Discovery of Dual Inhibitors of Tyrosine and Phosphoinositide Kinases. Nat. Chem. Biol. 2008, 4, 691–699. [DOI] [PMC free article] [PubMed] [Google Scholar]
- Gupta K.; Kaub C. J.; Carey K. N.; Casillas E. G.; Selinsky B. S.; Loll P. J. Manipulation of Kinetic Profiles in 2-Aryl Propionic Acid Cyclooxygenase Inhibitors. Bioorg. Med. Chem. Lett. 2004, 14, 667–671. [DOI] [PubMed] [Google Scholar]
- Kuhnert M.; Köster H.; Bartholomäus R.; Park A. Y.; Shahim A.; Heine A.; Steuber H.; Klebe G.; Diederich W. E. Tracing Binding Modes in Hit-to-Lead Optimization: Chameleon-Like Poses of Aspartic Protease Inhibitors. Angew. Chem., Int. Ed. 2015, 54, 2849–2853. [DOI] [PubMed] [Google Scholar]
- Maggiora G. M. On Outliers and Activity CliffsWhy QSAR Often Disappoints. J. Chem. Inf. Model. 2006, 46, 1535–1535. [DOI] [PubMed] [Google Scholar]
- Stumpfe D.; Hu Y.; Dimova D.; Bajorath J. Recent Progress in Understanding Activity Cliffs and Their Utility in Medicinal Chemistry: Miniperspective. J. Med. Chem. 2014, 57, 18–28. [DOI] [PubMed] [Google Scholar]
- Bauschlicher C. W.; Langhoff S. R. Quantum Mechanical Calculations to Chemical Accuracy. Science 1991, 254, 394–398. [DOI] [PubMed] [Google Scholar]
- Stoll F.; Göller A. H.; Hillisch A. Utility of Protein Structures in Overcoming ADMET-Related Issues of Drug-like Compounds. Drug Discovery Today 2011, 16, 530–538. [DOI] [PubMed] [Google Scholar]
Associated Data
This section collects any data citations, data availability statements, or supplementary materials included in this article.


