

Abstract
Background and Objectives
To investigate age-specific and sex-specific distributions of blood cholesterol in the general Korean population.
Subjects and Methods
We analyzed data for 8284 men and 9246 women aged ≥10 years who participated in the fifth (2010-2012) Korea National Health and Nutrition Examination Survey. Age-specific means, medians, and selected percentiles were calculated for men, premenopausal women, and postmenopausal women.
Results
Median total cholesterol (TC) level increased with age across all age groups, from 147 to 196 mg/dL in males and from 159 to 210 mg/dL in females. Triglyceride (TG) levels increased with age in females; however, in males, TG levels rapidly increased during young adulthood, peaked at 50-54 years, and then decreased. High density lipoprotein-cholesterol (HDL-C) levels were higher in females than in males and decreased with increasing age in both males and females. Low density lipoprotein-cholesterol (LDL-C) levels increased with age across all age groups, from 89 to 127 mg/dL in males and from 82 to 113 mg/dL in females. Lipoprotein-cholesterol fraction (TC/HDL-C, LDL-C/HDL-C, TG/HDL-C, non-HDL-C) levels increased with age in females, but increased more rapidly in males during young adulthood and decreased after middle age.
Conclusion
Blood cholesterol levels and lipoprotein-cholesterol fractions present different distributions by age, sex, and menopausal status.
Keywords: Cholesterol, Triglycerides, High density lipoprotein-cholesterol, Low density lipoprotein-cholesterol, Epidemiology
Introduction
Cardiovascular disease is the leading cause of death in Korea, and its burden on society is steadily increasing due to an ageing population and worsening cardiovascular risk profiles. Elevation or imbalance in blood cholesterols is the most important cardiovascular risk factor. High levels of total cholesterol (TC) and low density lipoprotein-cholesterol (LDL-C) are recognized as significant contributing factors to atherosclerotic cardiovascular disease,1),2) and elevated low serum high density lipoprotein-cholesterol (HDL-C) is asso-ciated with increased risk of cardiovascular disease.3),4) Ratios of li-poprotein-cholesterol fractions, such as TC to HDL-C ratio (TC/HDL-C) or LDL-C to HDL-C ratio (LDL-C/HDL-C), are better than the ab-solute level of LDL-C at discriminating between individuals who are more or less likely to develop cardiovascular disease based on the results from previous studies.3),5),6) Thus, TC/HDL-C or LDL-C to HDL-C ratio (LDL-C/HDL-C) may prove to be a better marker for identifying and monitoring cardiovascular disease risk.7) Increasing evidence8),9) supports the theory that serum triglycerides (TG) may be an independent risk factor for cardiovascular disease. Moreover, elevated TG and low HDL-C are basic characteristics of insulin resistance and metabolic syndrome, which are both strongly associated with cardiovascular disease.10),11) The TG/HDL-C, a relatively novel lipoprotein index, could serve as a good predictor of cardiovascular disease.12) At the same time, the non-HDL-C (calculated by subtracting HDL-C from TC) level provides a convenient measure of the cholesterol content of all atherogenic lipoproteins, and thus incorporates the potential risk for cardiovascular disease.13)
Many studies have investigated the prevalence of dyslipidemia.14),15),16) However, to date, no study has yet reported on the distributions of plasma lipid and lipoprotein-cholesterol fractions by age, sex, and menopausal status of Korean participants. Therefore, we investigated the distributions of TC, TG, HDL-C, LDL-C, and lipoprotein-cholesterol fractions according to age, sex and menopausal status in the Korean population.
Subjects and Methods
Participants
This study was based on data obtained from the fifth (2010-2012) Korean National Health and Nutritional Examination Survey (KNHANES). The KNHANES is performed annually with a stratified multistage probability cluster sample, which is designed to be representative of the entire population of South Korea.17) A total of 25534 individuals participated in the fifth KNHANES. Among these participants, we excluded individuals as follows: 1) aged <10 years; 2) taking lipid-lowering agents; 3) use of hormone replacement therapy within the last 12 months; and 4) lipid profiles that were not available. Finally, a total of 17530 subjects (8284 men and 9246 women) were analyzed for this study. Written informed consent was secured from each participant, and the KNHANES was conducted after ethical approval by the Institutional Review Board of the Korean Centers for Disease Control and Prevention (approval no. 2010-02CON-21-C, 2011-02CON-06-C, 2012-01EXP-01-2C).
Measurements
Blood samples were taken after subjects had fasted for eight or more hours. Fasting blood samples collected from each individual during the survey were processed, refrigerated immediately, transported in cold storage to the central laboratory (Neodin Medical Institute, Seoul, Korea), and analyzed within 24 hours after transportation. Fasting glucose, TC, HDL-C, and TG levels were determined using a Hitachi 7600 automated chemistry analyzer (Hitachi, Tokyo, Japan). The Friedewald formula was used to calculate LDL-C for subjects with serum TG level ≤400 mg/dL18) and measured directly using the Hitachi 7600 analyzer for subjects with serum TG level >400 mg/dL. Non-HDL-C was calculated by subtracting HDL-C from TC. Hypertension, diabetes, and dyslipidemia were defined as the cases where the participants replied that they had been diagnosed by a physician in the health interview survey. The health interview survey asked the female participants whether they were currently menmenstruating, then asked the cause of absent menstruation if they answered no. Menopausal status was dichotomized into premeno-pausal versus postmenopausal states, which included menopause with or without a hysterectomy. Body mass index was calculated by dividing weight by height (kg/m2). Smoking status was categorized into never/past or current (daily or intermittent) smoker. Alcohol consumption was categorized according to the frequency of alcohol consumed, and alcohol drinkers were defined as those who consume more than drinks at least once per month.
Statistical analyses
Mean, standard deviation, and selected percentile values were calculated for each variable by age, sex, and menopausal status. St-atistical analyses were conducted using Statistical Analysis System (SAS) version 9.2 (SAS Institute, Cary, NC, USA) and with the consideration of a two-sided p less than 0.05 as statistically significant for all analyses.
Results
Characteristics of the study population are shown in Table 1. Pre-valence of previously diagnosed hypertension, diabetes, and dyslipidemia was 18.6%, 7.9%, and 7.9% in males, and 20.1%, 6.3%, and 10.5% in females, respectively. Males had significantly higher blood pressure, fasting glucose, TG, and history of smoking and drinking than females. Distributions of lipid levels and lipoprotein-cholesterol fractions are presented by 5-year age intervals in the tables and figures. Supplementary Table 1, 2, 3, 4, 5, 6, 7, 8 contain the number of subjects, means, standard deviations of the means, and percentile values; figures contain only medians for each variable.
Table 1. General characteristics of study population.
| Variables | Male (n=8284) | Female (n=9246) | p |
|---|---|---|---|
| Age (year) | 44.4±19.9 | 44.1±19.1 | 0.462 |
| Height (cm) | 168.8±8.2 | 156.9±6.9 | <0.001 |
| Weight (kg) | 67.1±12.6 | 56.2±9.7 | <0.001 |
| Body mass index (kg/m2) | 23.4±3.4 | 22.8±3.6 | <0.001 |
| Waist circumference (cm) | 82.1±10.4 | 76.6±10.4 | <0.001 |
| Systolic blood pressure (mm Hg) | 120.0±16.0 | 115.1±17.6 | <0.001 |
| Diastolic blood pressure (mm Hg) | 77.0±11.6 | 72.8±10.1 | <0.001 |
| Fasting glucose (mg/dL) | 93 [87-101] | 90 [85-97] | <0.001 |
| HbA1c (%) | 5.8±0.9 | 5.7±0.8 | <0.001 |
| Total cholesterol (mg/dL) | 182.8±36.1 | 187.8±36.5 | <0.001 |
| HDL-C (mg/dL) | 49.9±11.9 | 55.4±12.6 | <0.001 |
| Triglycerides (mg/dL) | 111 [74-167] | 88 [62-131] | <0.001 |
| Known hypertension (%) | 1324 (20.0) | 1451 (15.7) | <0.001 |
| Known diabetes (%) | 547 (6.6) | 435 (4.7) | <0.001 |
| Known dyslipidemia (%) | 303 (3.7) | 329 (3.6) | 0.424 |
| Current smoker (%) | 2812 (45.4) | 462 (5.0) | <0.001 |
| Alcohol drinker (%) | 4191 (50.6) | 3108 (33.6) | <0.001 |
Data are expressed as means±standard deviation, median [inter quartile range]. HbA1c: hemoglobin A1c, HDL-C: high density lipoprotein-cholesterol
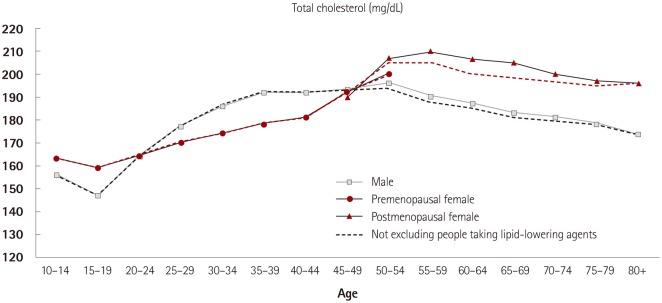
The level of TC increased from 156 mg/dL in the males 10-14 years old to a maximum of 196 mg/dL in the 50-54 year age group, and in females these levels increased from 163 mg/dL in 10-14 year olds to a maximum of 210 mg/dL in 55-59 year olds. Between age 25 to 49 years, TC level was higher in males than in females. However, the TC level was higher in females than in males among the younger (10 to 19 years) and older (≥50 years) age groups (Fig. 1, Supplementary Table 1 and 2 in the online-only Data Supplement).
Fig. 1. Median values of total cholesterol for age, sex, and menopausal status.
The level of TG increased with age and peaked among females aged ≥80 years, while the males reflected a more rapid increase of plasma TG levels during young adulthood (10 to 54 years) which decreased during middle age (55 to ≥80 years). The highest TG level was observed in 50-54 year (138 mg/dL) old males, and 65-69 years (124 mg/dL) in females. Between age 15 to 64 years, TG level was higher in males, but , higher in females after age 65 (Fig. 2, Supplementary Table 3 and 4 in the online-only Data Supplement).
Fig. 2. Median values of triglycerides for age, sex, and menopausal status.

The level of HDL-C were compared between males and females. Females showed higher HDL-C levels than males in all age groups. The highest value was observed among 25-29 year olds (59 mg/dL), which was followed by a decrease (47 mg/dL for females ≥80 years). In males, the highest value was observed among 10-14 year olds (53 mg/dL), followed by a decrease (44 mg/dL for males ≥80 years). The HDL-C level in males decreased almost linearly, while a more rapid decrease of these levels during middle age was observed in females (Fig. 3, Supplementary Table 5 and 6 in the online-only Data Supplement).
Fig. 3. Median values of high density lipoprotein-cholesterol for age, sex, and menopausal status.

The level of LDL-C revealed a pattern similar to TC levels. The cr-ossover of LDL-C levels for the sexes occurred in the 50-54 year age group and led to higher LDL-C values in females than in males over 50 years (Fig. 4, Supplementary Table 7 and 8 in the online-only Data Supplement).
Fig. 4. Median values of low density lipoprotein-cholesterol for age, sex, and menopausal status.

The TC/HDL-C ratio rapidly increased from 2.85 in the males aged 10-14 to a maximum of 4.14 in the 45-49 year olds, while in females it increased from 2.97 in 10-14 year olds to a maximum of 4.16 in the ≥80 year group. The crossover of TC/HDL-C ratio for the sexes occurred in those aged 60-64 and led to a higher ratio in females compared to males older than 60 years (Fig. 5, Supplementary Table 9 and 10 in the online-only Data Supplement).
Fig. 5. Median values of TC/HDL-C ratio for age, sex, and menopausal status. TC: total cholesterol, HDL-C: high density lipoprotein-cholesterol.

In males, the LDL-C/HDL-C ratio increased from 1.59 in 10-14 year olds to a maximum of 2.42 in 45-49 year old, while in females these values increased from 1.64 in 10-14 year olds to a maximum of 2.55 in 60-64 year olds. The crossover of LDL-C/HDL-C ratio for the sexes occurred in 55-59 year olds, which led to higher ratio in females than in males after 55 years (Fig. 6, Supplementary Table 11 and 12 in the online-only Data Supplement).
Fig. 6. Median values of LDL-C/HDL-C ratio for age, sex, and menopausal status. LDL-C: low density lipoprotein-cholesterol, HDL-C: high density lipoprotein-cholesterol.

The TG/HDL-C ratio in males increased from 1.20 in 10-14 year olds to a maximum of 3.06 in 50-54 year olds, and in females these values increased from 1.40 in the 10-14 year olds to a maximum of 2.63 in those ≥80 years (Fig. 7, Supplementary Table 13 and 14 in the online-only Data Supplement).
Fig. 7. Median values of TG/HDL-C ratio for age, sex, and menopausal status. TG: triglycerides, HDL-C: high density lipoprotein-cholesterol.

The value of non-HDL-C in males increased from 100 mg/dL in 10-14 year olds to a maximum of 146 mg/dL in 45-54 year olds. In females, these values increased from 106 mg/dL in 10-14 year olds to a maximum of 155.5 mg/dL in 55-59 year olds (Fig. 8, Supplementary Table 15 and 16 in the online-only Data Supplement).
Fig. 8. Median values of non-HDL-C for age, sex, and menopausal status. HDL-C: high density lipoprotein-cholesterol.

Discussion
We reported the distributions of plasma lipid and lipoprotein-cholesterol fractions by sex and age among 17530 Koreans, which were sampled to represent the Korea population. These data are provided to facilitate the identification of individuals in the highest lipid or lipoprotein percentiles by age, sex, and menopausal status. Plasma lipid and lipoprotein-cholesterol fractions levels increased with age in females, while the males tend to have a more rapid increase during young adulthood and a decrease during and after middle age.
Blood lipid level and lipoprotein composition have a role in the development of atherogenesis and vascular disorders. Most importantly, the risk of atherosclerotic heart disease increases with increasing levels of TC and LDL-C;19) but the risk decreases with increasing levels of HDL-C.20),21) The age-related and sex-related ch-anges in LDL-C levels reported in this study closely resemble those for TC, as almost 70% of TC is transported by lipoproteins in the low-density range. When compared with US populations from the NHANES 2010,22) Korean males showed lower mean TC and LDL-C levels (TC 183 mg/dL; LDL-C 106 mg/dL) compared to American males (TC 194 mg/dL; LDL-C 116 mg/dL), and Korean females also showed lower mean levels (TC 188 mg/dL; LDL-C 111 mg/dL) than American females (TC 198 mg/dL; LDL-C 115 mg/dL). It is well-known that HDL-C is higher in females than in males.23) In our population, the mean HDL-C level was 50 mg/dL for males and 55 mg/dL for females. Korean males displayed higher HDL-C levels than American males (47 mg/dL), while levels in Korean females were lower than American females (57 mg/dL). Accordingly, male-female difference in mean HDL-C level is only 5 mg/dL in the Korean population, while it is about 10 mg/dL in the American population. The mean TG levels are consistently higher (males 134 mg/dL; female 107 mg/dL) than those found in previous surveys of the US populations (males 119 mg/dL; female 102 mg/dL). A high carbohydrate diet may be the one of the possible causes of high TG levels in the Korean population, which in turn promotes the formulation of small and dense LDLs.24) The reason for the difference in lipoprotein profile between Korean and US populations might be due to genetics, environmental factors, or both.
In our study population, the effects of ageing on plasma lipids and lipoprotein-cholesterol fractions significantly differed between males and females. Because females with elevated blood cholesterol tend to be older, they also have a higher chance of developing cardiovascular disease. Furthermore, although plasma levels of TC, LDL-C, HDL-C, and TG are highly heritable,25) environmental factors affect plasma concentrations of these parameters. In previous studies, it has been shown that diet composition, particularly dietary cholesterol and saturated fatty acids, has a significant effect on blood cholesterol.26),27) In females, menopause is an additional determinant of these parameters. The post-menopausal decrease of plasma estrogen levels may play a significant role in reducing the clearance of LDL particles and the subsequent increase in LDL-C levels in postmenopausal women.28) Estrogen replacement treatment has been shown to decrease LDL-C and increase HDL-C levels in dyslipidemic postmenopausal women.29)
The present study has several limitations that need to be discussed. First, the KNHANES was designed to represent the Korean population, but the sample was limited to the non-institutionalized civilian population of Korean. Therefore, people who were admitted to the hospital or nursing homes were not included in this study. Second, LDL-C levels were not directly measured but calculated by the Friedewald's formula. However, this formula has been validated and used extensively to measure LDL-C levels in epidemiological studies.30) Third, we did not control for the effects of prevalent diseases which may affect plasma lipid levels. We were also unable to exclude the participants who were unaware of which medications were prescribed to them. Thus we could not completely eliminate the effects of lipid-lowering medications.
Blood cholesterol levels and lipoprotein-cholesterol fractions present different distributions by age, sex, and menopausal status among the Korean population. Our findings suggest that a subgroup-specific approach is required to develop efficient cardiovascular disease prevention strategies.
Acknowledgments
This study was supported by a grant of the Korean Health Technology R&D Project, Ministry of Health & Welfare, Republic of Korea (HI13C0715).
Footnotes
The authors have no financial conflicts of interest.
Supplementary Material
The online-only Data Supplement is available with this article at http://dx.doi.org/10.4070/kcj.2015.45.2.141.
Supplementary Table 1. Distribution of total cholesterol (mg/dL) by age, sex, menopausal status.
| Age | Number | Mean | Standard deviation | Percentiles | ||||||
|---|---|---|---|---|---|---|---|---|---|---|
| 5th | 10th | 25th | 50th | 75th | 90th | 95th | ||||
| Male (n=8284) | ||||||||||
| 10-14 | 788 | 156.9 | 26.6 | 117 | 125 | 139 | 156 | 172 | 191 | 204 |
| 15-19 | 566 | 151.1 | 27.3 | 114 | 121 | 133 | 147 | 167 | 184 | 196 |
| 20-24 | 327 | 167.9 | 29.7 | 129 | 134 | 147 | 164 | 187 | 213 | 220 |
| 25-29 | 431 | 179.1 | 31.4 | 129 | 141 | 158 | 177 | 198 | 222 | 234 |
| 30-34 | 548 | 188.4 | 34.3 | 135 | 146 | 166 | 186 | 210 | 230 | 246 |
| 35-39 | 765 | 193.8 | 33.4 | 143 | 153 | 171 | 192 | 213 | 239 | 255 |
| 40-44 | 729 | 193.9 | 35.7 | 139 | 153 | 172 | 192 | 216 | 237 | 249 |
| 45-49 | 617 | 196.9 | 37.9 | 140 | 151 | 174 | 193 | 218 | 242 | 260 |
| 50-54 | 659 | 195.6 | 33.3 | 142 | 154 | 172 | 196 | 216 | 238 | 249 |
| 55-59 | 631 | 192.1 | 36.8 | 134 | 146 | 168 | 190 | 215 | 235 | 255 |
| 60-64 | 643 | 187.3 | 34.4 | 131 | 144 | 164 | 187 | 212 | 231 | 242 |
| 65-69 | 554 | 184.0 | 32.7 | 134 | 144 | 163 | 183 | 203 | 226 | 240 |
| 70-74 | 559 | 183.6 | 33.9 | 128 | 144 | 160 | 181 | 205 | 227 | 242 |
| 75-79 | 339 | 179.8 | 33.9 | 125 | 140 | 159 | 178 | 196 | 224 | 243 |
| 80+ | 128 | 173.5 | 33.6 | 120 | 129 | 150 | 174 | 194 | 217 | 232 |
| Premenopausal female (n=5841) | ||||||||||
| 10-14 | 675 | 163.8 | 25.3 | 125 | 133 | 147 | 163 | 178 | 198 | 210 |
| 15-19 | 524 | 162.3 | 26.3 | 125 | 132 | 144 | 159 | 178 | 196 | 211 |
| 20-24 | 470 | 167.2 | 28.5 | 124 | 133 | 148 | 164 | 184 | 203 | 216 |
| 25-29 | 593 | 174.1 | 31.0 | 130 | 141 | 153 | 170 | 191 | 214 | 231 |
| 30-34 | 790 | 176.9 | 32.9 | 129 | 139 | 154 | 174 | 195 | 220 | 236 |
| 35-39 | 1039 | 180.3 | 32.6 | 135 | 142 | 158 | 178 | 200 | 219 | 233 |
| 40-44 | 843 | 183.1 | 31.3 | 138 | 144 | 161 | 181 | 202 | 224 | 240 |
| 45-49 | 633 | 194.2 | 33.2 | 143 | 153 | 173 | 192 | 214 | 235 | 253 |
| 50-54 | 274 | 200.8 | 33.5 | 153 | 160 | 177 | 200 | 223 | 246 | 260 |
| Postmenopausal female (n=3405) | ||||||||||
| 45-49 | 113 | 194.6 | 31.5 | 143 | 157 | 176 | 190 | 211 | 229 | 254 |
| 50-54 | 578 | 208.9 | 35.9 | 155 | 167 | 186 | 207 | 226 | 255 | 274 |
| 55-59 | 590 | 210.1 | 36.6 | 153 | 165 | 183 | 210 | 234 | 257 | 271 |
| 60-64 | 540 | 206.8 | 35.6 | 148 | 161 | 183 | 207 | 230 | 250 | 266 |
| 65-69 | 466 | 205.6 | 36.2 | 150 | 159 | 182 | 205 | 228 | 252 | 267 |
| 70-74 | 542 | 201.4 | 36.5 | 142 | 156 | 177 | 200 | 223 | 248 | 265 |
| 75-79 | 387 | 198.4 | 36.9 | 144 | 152 | 173 | 197 | 219 | 244 | 264 |
| 80+ | 189 | 197.5 | 35.7 | 145 | 156 | 170 | 196 | 217 | 243 | 264 |
Supplementary Table 2. Distribution of total cholesterol (mg/dL) by age, sex, menopausal status not excluding people taking lipid-lowering agents.
| Age | Number | Mean | Standard deviation | Percentiles | ||||||
|---|---|---|---|---|---|---|---|---|---|---|
| 5th | 10th | 25th | 50th | 75th | 90th | 95th | ||||
| Male (n=8656) | ||||||||||
| 10-14 | 788 | 156.9 | 26.6 | 117 | 125 | 139 | 156 | 172 | 191 | 204 |
| 15-19 | 566 | 151.1 | 27.3 | 114 | 121 | 133 | 147 | 167 | 184 | 196 |
| 20-24 | 327 | 167.9 | 29.7 | 129 | 134 | 147 | 164 | 187 | 213 | 220 |
| 25-29 | 432 | 179.2 | 31.6 | 129 | 141 | 158 | 178 | 198 | 222 | 234 |
| 30-34 | 550 | 188.4 | 34.2 | 135 | 146 | 166 | 186 | 210 | 230 | 246 |
| 35-39 | 773 | 193.7 | 33.4 | 142 | 153 | 170 | 192 | 213 | 239 | 255 |
| 40-44 | 742 | 193.5 | 35.7 | 139 | 152 | 171 | 192 | 216 | 237 | 247 |
| 45-49 | 640 | 196.3 | 38.6 | 139 | 150 | 173 | 192 | 218 | 242 | 261 |
| 50-54 | 704 | 195.1 | 35.3 | 141 | 152 | 171 | 194 | 216 | 238 | 250 |
| 55-59 | 691 | 190.0 | 37.6 | 131 | 142 | 166 | 188 | 214 | 235 | 254 |
| 60-64 | 714 | 185.6 | 34.7 | 129 | 141 | 161 | 185 | 211 | 230 | 241 |
| 65-69 | 621 | 181.4 | 33.0 | 128 | 141 | 161 | 181 | 200 | 224 | 238 |
| 70-74 | 611 | 182.2 | 34.9 | 126 | 139 | 159 | 179 | 204 | 225 | 241 |
| 75-79 | 360 | 178.6 | 33.9 | 126 | 139 | 157 | 178 | 196 | 222 | 240 |
| 80+ | 137 | 173.2 | 33.4 | 120 | 130 | 148 | 173 | 196 | 217 | 232 |
| Premenopausal female (n=5869) | ||||||||||
| 10-14 | 675 | 163.8 | 25.3 | 125 | 133 | 147 | 163 | 178 | 198 | 210 |
| 15-19 | 524 | 162.3 | 26.3 | 125 | 132 | 144 | 159 | 178 | 196 | 211 |
| 20-24 | 470 | 167.2 | 28.5 | 124 | 133 | 148 | 164 | 184 | 203 | 216 |
| 25-29 | 593 | 174.1 | 31.0 | 130 | 141 | 153 | 170 | 191 | 214 | 231 |
| 30-34 | 790 | 176.9 | 32.9 | 129 | 139 | 154 | 174 | 195 | 220 | 236 |
| 35-39 | 1043 | 180.3 | 32.5 | 136 | 142 | 158 | 178 | 199 | 219 | 233 |
| 40-44 | 850 | 182.9 | 31.4 | 137 | 144 | 161 | 181 | 201 | 225 | 241 |
| 45-49 | 645 | 193.6 | 33.4 | 143 | 152 | 172 | 192 | 213 | 234 | 253 |
| 50-54 | 279 | 200.7 | 33.4 | 153 | 160 | 177 | 200 | 223 | 246 | 260 |
| Postmenopausal female (n=3909) | ||||||||||
| 45-49 | 119 | 193.5 | 32.3 | 139 | 152 | 175 | 190 | 211 | 230 | 254 |
| 50-54 | 617 | 207.6 | 36.2 | 154 | 164 | 184 | 206 | 226 | 255 | 273 |
| 55-59 | 670 | 206.8 | 37.9 | 145 | 160 | 180 | 206 | 232 | 255 | 271 |
| 60-64 | 648 | 202.7 | 36.5 | 144 | 155 | 177 | 201 | 226 | 248 | 263 |
| 65-69 | 578 | 199.7 | 36.9 | 143 | 154 | 172 | 198 | 223 | 247 | 263 |
| 70-74 | 638 | 197.9 | 37.1 | 138 | 150 | 173 | 197 | 221 | 247 | 264 |
| 75-79 | 441 | 195.4 | 37.5 | 140 | 151 | 168 | 195 | 217 | 242 | 260 |
| 80+ | 198 | 197.2 | 35.7 | 144 | 156 | 170 | 196 | 216 | 243 | 269 |
Supplementary Table 3. Distribution of triglycerides (mg/dL) by age, sex, menopausal status.
| Age | Number | Mean | Standard deviation | Percentiles | ||||||
|---|---|---|---|---|---|---|---|---|---|---|
| 5th | 10th | 25th | 50th | 75th | 90th | 95th | ||||
| Male (n=8284) | ||||||||||
| 10-14 | 788 | 77.9 | 44.3 | 30 | 36 | 47 | 66 | 96 | 138 | 169 |
| 15-19 | 566 | 83.6 | 44.3 | 37 | 42 | 55 | 74 | 98 | 143 | 175 |
| 20-24 | 327 | 94.9 | 53.7 | 39 | 45 | 60 | 84 | 109 | 167 | 207 |
| 25-29 | 431 | 130.3 | 104.3 | 47 | 54 | 74 | 104 | 150 | 218 | 296 |
| 30-34 | 548 | 143.7 | 100.6 | 49 | 57 | 81 | 114 | 182 | 252 | 306 |
| 35-39 | 765 | 151.6 | 90.8 | 54 | 65 | 90 | 130 | 189 | 268 | 316 |
| 40-44 | 729 | 161.7 | 98.4 | 58 | 69 | 92 | 137 | 205 | 287 | 332 |
| 45-49 | 617 | 164.5 | 115.0 | 51 | 68 | 94 | 136 | 200 | 302 | 345 |
| 50-54 | 659 | 164.7 | 100.7 | 58 | 67 | 96 | 138 | 202 | 302 | 355 |
| 55-59 | 631 | 159.2 | 103.9 | 53 | 66 | 96 | 136 | 200 | 272 | 326 |
| 60-64 | 643 | 143.3 | 84.2 | 49 | 59 | 83 | 125 | 180 | 254 | 316 |
| 65-69 | 554 | 133.1 | 75.3 | 45 | 58 | 82 | 118 | 163 | 229 | 276 |
| 70-74 | 559 | 128.8 | 71.8 | 49 | 56 | 77 | 111 | 161 | 225 | 275 |
| 75-79 | 339 | 119.7 | 69.4 | 48 | 55 | 73 | 104 | 144 | 215 | 258 |
| 80+ | 128 | 105.7 | 48.6 | 51 | 55 | 67 | 99 | 132 | 166 | 209 |
| Premenopausal female (n=5841) | ||||||||||
| 10-14 | 675 | 89.5 | 48.5 | 38 | 44 | 58 | 78 | 107 | 149 | 191 |
| 15-19 | 524 | 77.4 | 40.4 | 34 | 41 | 51 | 68 | 91 | 126 | 156 |
| 20-24 | 470 | 75.7 | 43.5 | 34 | 40 | 51 | 66 | 88 | 118 | 146 |
| 25-29 | 593 | 85.5 | 57.9 | 34 | 39 | 53 | 69 | 100 | 145 | 195 |
| 30-34 | 790 | 88.5 | 54.3 | 34 | 39 | 53 | 72 | 108 | 152 | 194 |
| 35-39 | 1039 | 91.7 | 57.8 | 36 | 42 | 56 | 75 | 110 | 153 | 194 |
| 40-44 | 843 | 94.8 | 55.0 | 41 | 47 | 59 | 80 | 116 | 159 | 197 |
| 45-49 | 633 | 110.1 | 69.0 | 43 | 49 | 66 | 92 | 129 | 192 | 246 |
| 50-54 | 274 | 108.8 | 58.2 | 46 | 51 | 68 | 93 | 135 | 191 | 221 |
| Postmenopausal female (n=3405) | ||||||||||
| 45-49 | 113 | 113.4 | 75.0 | 38 | 46 | 62 | 89 | 144 | 198 | 310 |
| 50-54 | 578 | 128.3 | 77.2 | 47 | 56 | 74 | 108 | 156 | 234 | 287 |
| 55-59 | 590 | 128.6 | 77.0 | 46 | 58 | 77 | 110 | 164 | 215 | 268 |
| 60-64 | 540 | 135.6 | 74.9 | 55 | 62 | 81 | 116 | 167 | 241 | 274 |
| 65-69 | 466 | 142.8 | 75.6 | 55 | 65 | 86 | 126 | 180 | 258 | 293 |
| 70-74 | 542 | 138.6 | 79.6 | 53 | 63 | 88 | 123 | 175 | 230 | 263 |
| 75-79 | 387 | 134.0 | 67.6 | 57 | 66 | 87 | 119 | 167 | 220 | 250 |
| 80+ | 189 | 141.0 | 67.4 | 63 | 72 | 94 | 124 | 170 | 249 | 290 |
Supplementary Table 4. Distribution of triglycerides (mg/dL) by age, sex, menopausal status not excluding people taking lipid-lowering agents.
| Age | Number | Mean | Standard deviation | Percentiles | ||||||
|---|---|---|---|---|---|---|---|---|---|---|
| 5th | 10th | 25th | 50th | 75th | 90th | 95th | ||||
| Male (n=8656) | ||||||||||
| 10-14 | 788 | 77.9 | 44.3 | 30 | 36 | 47 | 66 | 96 | 138 | 169 |
| 15-19 | 566 | 83.6 | 44.3 | 37 | 42 | 55 | 74 | 98 | 143 | 175 |
| 20-24 | 327 | 94.9 | 53.7 | 39 | 45 | 60 | 84 | 109 | 167 | 207 |
| 25-29 | 432 | 130.8 | 104.8 | 47 | 54 | 74 | 104 | 150 | 221 | 297 |
| 30-34 | 550 | 144.2 | 100.7 | 49 | 57 | 81 | 115 | 182 | 253 | 306 |
| 35-39 | 773 | 151.8 | 90.7 | 54 | 65 | 90 | 130 | 190 | 268 | 316 |
| 40-44 | 742 | 162.6 | 99.0 | 58 | 69 | 93 | 137 | 206 | 288 | 335 |
| 45-49 | 640 | 165.4 | 114.6 | 52 | 68 | 94.5 | 139 | 201 | 303 | 348 |
| 50-54 | 704 | 166.6 | 102.2 | 58 | 68 | 96.5 | 139 | 205 | 302 | 355 |
| 55-59 | 691 | 159.3 | 103.7 | 53 | 66 | 95 | 136 | 200 | 274 | 326 |
| 60-64 | 714 | 145.8 | 84.6 | 50 | 59 | 86 | 128 | 186 | 253 | 316 |
| 65-69 | 621 | 135.4 | 76.2 | 47 | 61 | 83 | 118 | 166 | 240 | 279 |
| 70-74 | 611 | 129.7 | 71.7 | 49 | 57 | 77 | 111 | 162 | 226 | 274 |
| 75-79 | 360 | 120.2 | 70.2 | 47.5 | 55 | 73 | 104 | 144 | 215 | 258 |
| 80+ | 137 | 106.2 | 49.4 | 51 | 55 | 66 | 98 | 132 | 166 | 210 |
| Premenopausal female (n=5869) | ||||||||||
| 10-14 | 675 | 89.5 | 48.5 | 38 | 44 | 58 | 78 | 107 | 149 | 191 |
| 15-19 | 524 | 77.4 | 40.4 | 34 | 41 | 51 | 68 | 91 | 126 | 156 |
| 20-24 | 470 | 75.7 | 43.5 | 34 | 39.5 | 51 | 66 | 88 | 118 | 146 |
| 25-29 | 593 | 85.5 | 57.9 | 34 | 39 | 53 | 69 | 100 | 145 | 195 |
| 30-34 | 790 | 88.5 | 54.3 | 34 | 39 | 53 | 72 | 108 | 152 | 194 |
| 35-39 | 1043 | 91.8 | 57.8 | 36 | 42 | 56 | 75 | 110 | 153 | 194 |
| 40-44 | 850 | 95.5 | 55.7 | 41 | 47 | 60 | 80 | 116 | 160 | 198 |
| 45-49 | 645 | 110.6 | 68.9 | 43 | 49 | 67 | 93 | 129 | 193 | 246 |
| 50-54 | 279 | 109.2 | 57.9 | 46 | 51 | 68 | 94 | 135 | 191 | 221 |
| Postmenopausal female (n=3909) | ||||||||||
| 45-49 | 119 | 117.2 | 76.1 | 38 | 46 | 64 | 93 | 159 | 229 | 310 |
| 50-54 | 617 | 128.9 | 76.7 | 47 | 56 | 74 | 109 | 157 | 234 | 287 |
| 55-59 | 670 | 130.2 | 76.8 | 46 | 57.5 | 78 | 112 | 167 | 221 | 270 |
| 60-64 | 648 | 135.9 | 74.2 | 55 | 63 | 82 | 117 | 167 | 241 | 273 |
| 65-69 | 578 | 143.3 | 73.8 | 56 | 66 | 89 | 126 | 180 | 252 | 293 |
| 70-74 | 638 | 137.7 | 77.4 | 51 | 63 | 86 | 123 | 175 | 230 | 263 |
| 75-79 | 441 | 132.8 | 67.1 | 56 | 66 | 87 | 118 | 164 | 218 | 250 |
| 80+ | 198 | 141.9 | 66.7 | 63 | 74 | 95 | 125 | 173 | 248 | 290 |
Supplementary Table 5. Distribution of high density lipoprotein-cholesterol (mg/dL) by age, sex, menopausal status.
| Age | Number | Mean | Standard deviation | Percentiles | ||||||
|---|---|---|---|---|---|---|---|---|---|---|
| 5th | 10th | 25th | 50th | 75th | 90th | 95th | ||||
| Male (n=8284) | ||||||||||
| 10-14 | 788 | 54.4 | 10.9 | 37 | 41 | 47 | 53 | 62 | 69 | 74 |
| 15-19 | 566 | 50.3 | 9.7 | 36 | 39 | 44 | 49 | 56 | 63 | 68 |
| 20-24 | 327 | 53.2 | 11.6 | 38 | 40 | 45 | 52 | 59 | 69 | 74 |
| 25-29 | 431 | 50.5 | 11.5 | 35 | 38 | 42 | 49 | 57 | 65 | 71 |
| 30-34 | 548 | 49.4 | 11.1 | 34 | 37 | 41 | 48 | 56 | 65 | 71 |
| 35-39 | 765 | 49.8 | 11.5 | 34 | 37 | 42 | 48 | 56 | 65 | 70 |
| 40-44 | 729 | 48.7 | 10.8 | 34 | 36 | 40 | 48 | 55 | 63 | 69 |
| 45-49 | 617 | 48.5 | 11.5 | 33 | 36 | 41 | 47 | 55 | 62 | 69 |
| 50-54 | 659 | 49.4 | 12.2 | 34 | 36 | 41 | 47 | 56 | 65 | 73 |
| 55-59 | 631 | 48.9 | 12.2 | 33 | 35 | 40 | 47 | 55 | 65 | 73 |
| 60-64 | 643 | 50.0 | 13.1 | 34 | 36 | 40 | 48 | 57 | 67 | 76 |
| 65-69 | 554 | 48.9 | 12.9 | 32 | 35 | 40 | 46.5 | 56 | 66 | 74 |
| 70-74 | 559 | 48.9 | 12.7 | 32 | 34 | 40 | 47 | 56 | 65 | 72 |
| 75-79 | 339 | 48.6 | 12.5 | 31 | 34 | 40 | 47 | 55 | 65 | 72 |
| 80+ | 128 | 47.6 | 12.9 | 30 | 32 | 38 | 44 | 57 | 69 | 72 |
| Premenopausal female (n=5841) | ||||||||||
| 10-14 | 675 | 54.7 | 10.5 | 39 | 42 | 47 | 54 | 61 | 68 | 73 |
| 15-19 | 524 | 57.0 | 10.9 | 40 | 44 | 49.5 | 56 | 64 | 70 | 75 |
| 20-24 | 470 | 59.9 | 12.9 | 42 | 46 | 51 | 58 | 67 | 77 | 83 |
| 25-29 | 593 | 60.0 | 13.0 | 40 | 43 | 51 | 59 | 68 | 77 | 82 |
| 30-34 | 790 | 58.6 | 13.1 | 39 | 42 | 49 | 58 | 67 | 76 | 81 |
| 35-39 | 1039 | 57.4 | 12.2 | 39 | 43 | 49 | 57 | 65 | 73 | 79 |
| 40-44 | 843 | 55.9 | 12.7 | 39 | 42 | 47 | 55 | 63 | 71 | 77 |
| 45-49 | 633 | 56.6 | 11.8 | 39 | 43 | 48 | 56 | 64 | 72 | 78 |
| 50-54 | 274 | 55.9 | 12.9 | 37 | 40 | 47 | 54 | 63 | 71 | 80 |
| Postmenopausal female (n=3405) | ||||||||||
| 45-49 | 113 | 55.2 | 12.7 | 34 | 38 | 46 | 56 | 63 | 70 | 76 |
| 50-54 | 578 | 56.0 | 13.2 | 38 | 40 | 47 | 55 | 63 | 73 | 79 |
| 55-59 | 590 | 53.4 | 11.9 | 37 | 39 | 44 | 52 | 61 | 69 | 73 |
| 60-64 | 540 | 52.1 | 12.3 | 35 | 37 | 43 | 51 | 59 | 69 | 75 |
| 65-69 | 466 | 51.6 | 11.4 | 35 | 38 | 44 | 50 | 59 | 67 | 71 |
| 70-74 | 542 | 50.7 | 12.1 | 34 | 37 | 42 | 49 | 57 | 66 | 73 |
| 75-79 | 387 | 50.0 | 11.3 | 33 | 36 | 42 | 49 | 57 | 64 | 69 |
| 80+ | 189 | 47.9 | 10.4 | 34 | 36 | 40 | 47 | 54 | 61 | 68 |
Supplementary Table 6. Distribution of high density lipoprotein-cholesterol (mg/dL) by age, sex, menopausal status not excluding people taking lipid-lowering agents.
| Age | Number | Mean | Standard deviation | Percentiles | ||||||
|---|---|---|---|---|---|---|---|---|---|---|
| 5th | 10th | 25th | 50th | 75th> | 90th | 95th | ||||
| Male (n=8656) | ||||||||||
| 10-14 | 788 | 54.4 | 10.9 | 37 | 41 | 47 | 53 | 62 | 69 | 74 |
| 15-19 | 566 | 50.3 | 9.7 | 36 | 39 | 44 | 49 | 56 | 63 | 68 |
| 20-24 | 327 | 53.2 | 11.6 | 38 | 40 | 45 | 52 | 59 | 69 | 74 |
| 25-29 | 432 | 50.4 | 11.5 | 35 | 38 | 42 | 49 | 57 | 65 | 71 |
| 30-34 | 550 | 49.4 | 11.1 | 34 | 37 | 41 | 48 | 56 | 65 | 71 |
| 35-39 | 773 | 49.7 | 11.4 | 34 | 37 | 42 | 48 | 56 | 65 | 70 |
| 40-44 | 742 | 48.8 | 10.9 | 34 | 36 | 41 | 48 | 55 | 63 | 69 |
| 45-49 | 640 | 48.4 | 11.4 | 33 | 36 | 41 | 47 | 55 | 62 | 69 |
| 50-54 | 704 | 49.3 | 12.1 | 34 | 36 | 41 | 47 | 56 | 65 | 71 |
| 55-59 | 691 | 49.0 | 12.2 | 33 | 36 | 41 | 47 | 55 | 65 | 73 |
| 60-64 | 714 | 49.8 | 12.9 | 34 | 35 | 41 | 48 | 56 | 67 | 75 |
| 65-69 | 621 | 48.8 | 12.7 | 32 | 35 | 40 | 47 | 56 | 66 | 72 |
| 70-74 | 611 | 49.0 | 12.7 | 32 | 34 | 40 | 46 | 56 | 66 | 72 |
| 75-79 | 360 | 48.5 | 12.5 | 31 | 34 | 40 | 47 | 55 | 65 | 72 |
| 80+ | 137 | 48.2 | 13.0 | 30 | 33 | 38 | 46 | 57 | 69 | 72 |
| Premenopausal female (n=5869) | ||||||||||
| 10-14 | 675 | 54.7 | 10.5 | 39 | 42 | 47 | 54 | 61 | 68 | 73 |
| 15-19 | 524 | 57.0 | 10.9 | 40 | 44 | 50 | 56 | 64 | 70 | 75 |
| 20-24 | 470 | 59.9 | 12.9 | 42 | 46 | 51 | 58 | 67 | 77 | 83 |
| 25-29 | 593 | 60.0 | 13.0 | 40 | 43 | 51 | 59 | 68 | 77 | 82 |
| 30-34 | 790 | 58.6 | 13.1 | 39 | 42 | 49 | 58 | 67 | 76 | 81 |
| 35-39 | 1043 | 57.4 | 12.2 | 39 | 43 | 49 | 57 | 65 | 73 | 79 |
| 40-44 | 850 | 55.8 | 12.7 | 38 | 41 | 46 | 55 | 63 | 71 | 77 |
| 45-49 | 645 | 56.5 | 11.8 | 39 | 43 | 48 | 56 | 64 | 72 | 77 |
| 50-54 | 279 | 56.0 | 12.9 | 37 | 40 | 47 | 54 | 63 | 72 | 80 |
| Postmenopausal female (n=3909) | ||||||||||
| 45-49 | 119 | 54.5 | 12.8 | 34 | 38 | 45 | 56 | 63 | 70 | 76 |
| 50-54 | 617 | 56.1 | 13.2 | 38 | 41 | 47 | 55 | 63 | 73 | 79 |
| 55-59 | 670 | 53.3 | 12.0 | 36 | 39 | 44 | 52 | 61 | 69 | 73 |
| 60-64 | 648 | 52.4 | 12.4 | 35 | 37 | 43 | 51 | 60 | 69 | 75 |
| 65-69 | 578 | 51.6 | 11.3 | 35 | 38 | 43 | 50 | 59 | 67 | 71 |
| 70-74 | 638 | 51.1 | 12.5 | 33 | 37 | 43 | 49 | 58 | 67 | 73 |
| 75-79 | 441 | 50.1 | 11.5 | 33 | 36 | 42 | 50 | 57 | 64 | 70 |
| 80+ | 198 | 48.0 | 10.2 | 34 | 36 | 40 | 47 | 54 | 61 | 68 |
Supplementary Table 7. Distribution of low density lipoprotein-cholesterol (mg/dL) by age, sex, menopausal status.
| Age | Number | Mean | Standard deviation | Percentiles | ||||||
|---|---|---|---|---|---|---|---|---|---|---|
| 5th | 10th | 25th | 50th | 75th | 90th | 95th | ||||
| Male (n=8284) | ||||||||||
| 10-14 | 788 | 86.9 | 22.4 | 53 | 61 | 72 | 85 | 100 | 116 | 126 |
| 15-19 | 566 | 84.1 | 24.0 | 50 | 57 | 69 | 82 | 98 | 113 | 124 |
| 20-24 | 327 | 95.7 | 26.2 | 60 | 65 | 76 | 91 | 111 | 131 | 145 |
| 25-29 | 431 | 103.6 | 28.0 | 60 | 67 | 86 | 103 | 120 | 140 | 153 |
| 30-34 | 548 | 111.2 | 31.4 | 67 | 74 | 91 | 110 | 128 | 147 | 163 |
| 35-39 | 765 | 114.3 | 30.2 | 68 | 78 | 94 | 113 | 133 | 154 | 168 |
| 40-44 | 729 | 113.4 | 32.0 | 64 | 75 | 92 | 114 | 132 | 154 | 166 |
| 45-49 | 617 | 116.4 | 34.3 | 63 | 75 | 94 | 116 | 137 | 156 | 174 |
| 50-54 | 659 | 114.1 | 31.6 | 65 | 77 | 91 | 114 | 133 | 155 | 168 |
| 55-59 | 631 | 111.9 | 33.8 | 60 | 71 | 91 | 109 | 132 | 155 | 170 |
| 60-64 | 643 | 108.9 | 32.4 | 55 | 68 | 88 | 107 | 130 | 153 | 164 |
| 65-69 | 554 | 108.7 | 30.6 | 56 | 71 | 89 | 109 | 127 | 147 | 159 |
| 70-74 | 559 | 109.0 | 31.1 | 59 | 71 | 87 | 108 | 129 | 146 | 162 |
| 75-79 | 339 | 107.3 | 31.1 | 57 | 67 | 88 | 107 | 127 | 147 | 160 |
| 80+ | 128 | 104.7 | 29.2 | 60 | 66 | 83 | 104 | 124 | 142 | 159 |
| Premenopausal female (n=5841) | ||||||||||
| 10-14 | 675 | 91.2 | 21.9 | 58 | 64 | 77 | 89 | 105 | 121 | 130 |
| 15-19 | 524 | 89.9 | 22.4 | 58 | 63 | 74 | 88 | 102 | 119 | 130 |
| 20-24 | 470 | 92.1 | 24.2 | 57 | 64 | 76 | 89 | 106 | 123 | 134 |
| 25-29 | 593 | 97.1 | 25.9 | 61 | 69 | 81 | 93 | 110 | 131 | 144 |
| 30-34 | 790 | 100.7 | 27.2 | 63 | 68 | 81 | 97 | 117 | 135 | 149 |
| 35-39 | 1039 | 104.6 | 28.2 | 65 | 73 | 85 | 102 | 121 | 141 | 154 |
| 40-44 | 843 | 108.3 | 26.6 | 68 | 75 | 89 | 107 | 124 | 144 | 157 |
| 45-49 | 633 | 115.8 | 29.7 | 72 | 80 | 95 | 115 | 132 | 151 | 165 |
| 50-54 | 274 | 123.1 | 28.3 | 78 | 89 | 103 | 123 | 140 | 160 | 175 |
| Postmenopausal female (n=3405) | ||||||||||
| 45-49 | 113 | 116.7 | 29.8 | 68 | 86 | 97 | 115 | 134 | 151 | 176 |
| 50-54 | 578 | 127.4 | 31.6 | 78 | 90 | 106 | 126 | 144 | 168 | 183 |
| 55-59 | 590 | 131.0 | 33.0 | 78 | 89 | 109 | 130 | 154 | 173 | 188 |
| 60-64 | 540 | 127.6 | 31.9 | 75 | 86 | 105 | 127 | 148 | 168 | 181 |
| 65-69 | 466 | 125.5 | 32.4 | 76 | 83 | 104 | 125 | 145 | 168 | 180 |
| 70-74 | 542 | 123.1 | 32.4 | 70 | 82 | 101 | 123 | 146 | 165 | 177 |
| 75-79 | 387 | 121.7 | 33.2 | 72 | 81 | 98 | 119 | 143 | 164 | 178 |
| 80+ | 189 | 121.4 | 32.7 | 71 | 81 | 98 | 120 | 138 | 166 | 185 |
Supplementary Table 8. Distribution of low density lipoprotein-cholesterol (mg/dL) by age, sex, menopausal status not excluding people taking lipid-lowering agents.
| Age | Number | Mean | Standard deviation | Percentiles | ||||||
|---|---|---|---|---|---|---|---|---|---|---|
| 5th | 10th | 25th | 50th | 75th | 90th | 95th | ||||
| Male (n=8656) | ||||||||||
| 10-14 | 788 | 86.9 | 22.4 | 53 | 61 | 72 | 85 | 100 | 116 | 126 |
| 15-19 | 566 | 84.1 | 24.0 | 50 | 57 | 69 | 82 | 98 | 113 | 124 |
| 20-24 | 327 | 95.7 | 26.2 | 60 | 65 | 76 | 91 | 111 | 131 | 145 |
| 25-29 | 432 | 103.7 | 28.0 | 60 | 67 | 86 | 103 | 120 | 140 | 153 |
| 30-34 | 550 | 111.2 | 31.3 | 67 | 74 | 91 | 110 | 128 | 147 | 163 |
| 35-39 | 773 | 114.1 | 30.3 | 68 | 78 | 94 | 113 | 133 | 154 | 168 |
| 40-44 | 742 | 112.8 | 32.1 | 64 | 73 | 90 | 113 | 132 | 153 | 166 |
| 45-49 | 640 | 115.8 | 35.0 | 61 | 74 | 92 | 115 | 136 | 156 | 175 |
| 50-54 | 704 | 113.3 | 32.9 | 65 | 75 | 90 | 112 | 133 | 155 | 168 |
| 55-59 | 691 | 109.7 | 34.2 | 58 | 69 | 88 | 108 | 130 | 154 | 169 |
| 60-64 | 714 | 106.9 | 32.9 | 52 | 63 | 84 | 105 | 129 | 151 | 162 |
| 65-69 | 621 | 105.8 | 31.2 | 54 | 67 | 85 | 106 | 125 | 146 | 157 |
| 70-74 | 611 | 107.3 | 31.8 | 57 | 69 | 85 | 107 | 127 | 146 | 162 |
| 75-79 | 360 | 106.2 | 31.3 | 57 | 66 | 83 | 105 | 126 | 147 | 157 |
| 80+ | 137 | 103.8 | 29.4 | 59 | 65 | 80 | 103 | 123 | 142 | 159 |
| Premenopausal female (n=5869) | ||||||||||
| 10-14 | 675 | 91.2 | 21.9 | 58 | 64 | 77 | 89 | 105 | 121 | 130 |
| 15-19 | 524 | 89.9 | 22.4 | 58 | 63 | 74 | 88 | 102 | 119 | 130 |
| 20-24 | 470 | 92.1 | 24.2 | 57 | 64 | 76 | 89 | 106 | 123 | 134 |
| 25-29 | 593 | 97.1 | 25.9 | 61 | 69 | 81 | 93 | 110 | 131 | 144 |
| 30-34 | 790 | 100.7 | 27.2 | 63 | 68 | 81 | 97 | 117 | 135 | 149 |
| 35-39 | 1043 | 104.6 | 28.2 | 65 | 73 | 85 | 102 | 121 | 140 | 153 |
| 40-44 | 850 | 108.1 | 26.7 | 68 | 75 | 89 | 107 | 124 | 144 | 157 |
| 45-49 | 645 | 115.2 | 30.0 | 71 | 79 | 95 | 114 | 132 | 150 | 164 |
| 50-54 | 279 | 122.9 | 28.6 | 78 | 89 | 102 | 122 | 140 | 161 | 175 |
| Postmenopausal female (n=3909) | ||||||||||
| 45-49 | 119 | 115.6 | 30.7 | 61 | 79 | 95 | 114 | 134 | 155 | 176 |
| 50-54 | 617 | 125.9 | 32.2 | 75 | 86 | 105 | 124 | 144 | 167 | 183 |
| 55-59 | 670 | 127.5 | 34.7 | 74 | 82 | 104 | 127 | 152 | 172 | 187 |
| 60-64 | 648 | 123.1 | 33.0 | 72 | 81 | 99 | 122 | 146 | 165 | 176 |
| 65-69 | 578 | 119.4 | 33.9 | 67 | 76 | 94 | 118 | 142 | 163 | 177 |
| 70-74 | 638 | 119.3 | 33.2 | 67 | 76 | 97 | 118 | 142 | 163 | 177 |
| 75-79 | 441 | 118.8 | 33.5 | 70 | 78 | 94 | 117 | 140 | 160 | 176 |
| 80+ | 198 | 120.8 | 32.9 | 71 | 76 | 98 | 120 | 137 | 166 | 188 |
Supplementary Table 9. Distribution of total cholesterol/high density lipoprotein-cholesterol ratio by age, sex, menopausal status.
| Age | Number | Mean | Standard deviation | Percentiles | ||||||
|---|---|---|---|---|---|---|---|---|---|---|
| 5th | 10th | 25th | 50th | 75th> | 90th | 95th | ||||
| Male (n=8284) | ||||||||||
| 10-14 | 788 | 2.97 | 0.65 | 2.10 | 2.23 | 2.50 | 2.85 | 3.33 | 3.89 | 4.19 |
| 15-19 | 566 | 3.09 | 0.72 | 2.17 | 2.28 | 2.62 | 2.98 | 3.43 | 3.97 | 4.44 |
| 20-24 | 327 | 3.28 | 0.87 | 2.14 | 2.32 | 2.68 | 3.12 | 3.74 | 4.36 | 4.98 |
| 25-29 | 431 | 3.71 | 1.01 | 2.30 | 2.52 | 2.98 | 3.57 | 4.31 | 5.08 | 5.63 |
| 30-34 | 548 | 3.99 | 1.10 | 2.41 | 2.67 | 3.20 | 3.84 | 4.65 | 5.50 | 5.88 |
| 35-39 | 765 | 4.08 | 1.10 | 2.48 | 2.72 | 3.26 | 4.02 | 4.76 | 5.52 | 6.06 |
| 40-44 | 729 | 4.16 | 1.13 | 2.56 | 2.79 | 3.35 | 4.05 | 4.87 | 5.65 | 6.10 |
| 45-49 | 617 | 4.24 | 1.12 | 2.61 | 2.91 | 3.45 | 4.14 | 4.92 | 5.74 | 6.13 |
| 50-54 | 659 | 4.16 | 1.09 | 2.59 | 2.87 | 3.36 | 4.05 | 4.79 | 5.62 | 6.13 |
| 55-59 | 631 | 4.12 | 1.13 | 2.44 | 2.75 | 3.30 | 4.00 | 4.78 | 5.56 | 6.08 |
| 60-64 | 643 | 3.94 | 1.06 | 2.43 | 2.65 | 3.12 | 3.84 | 4.66 | 5.33 | 5.72 |
| 65-69 | 554 | 3.96 | 1.06 | 2.40 | 2.60 | 3.18 | 3.89 | 4.72 | 5.37 | 5.74 |
| 70-74 | 559 | 3.96 | 1.13 | 2.45 | 2.65 | 3.08 | 3.84 | 4.64 | 5.43 | 5.96 |
| 75-79 | 339 | 3.90 | 1.09 | 2.40 | 2.61 | 3.05 | 3.74 | 4.58 | 5.30 | 5.97 |
| 80+ | 128 | 3.85 | 1.13 | 2.35 | 2.54 | 3.05 | 3.71 | 4.25 | 5.47 | 6.48 |
| Premenopausal female (n=5841) | ||||||||||
| 10-14 | 675 | 3.08 | 0.66 | 2.26 | 2.41 | 2.61 | 2.97 | 3.40 | 3.91 | 4.35 |
| 15-19 | 524 | 2.93 | 0.68 | 2.09 | 2.21 | 2.49 | 2.81 | 3.23 | 3.77 | 4.19 |
| 20-24 | 470 | 2.88 | 0.67 | 2.07 | 2.21 | 2.43 | 2.78 | 3.17 | 3.69 | 4.26 |
| 25-29 | 593 | 3.01 | 0.78 | 2.08 | 2.24 | 2.52 | 2.84 | 3.34 | 4.00 | 4.53 |
| 30-34 | 790 | 3.14 | 0.78 | 2.16 | 2.28 | 2.56 | 2.98 | 3.56 | 4.15 | 4.70 |
| 35-39 | 1039 | 3.25 | 0.82 | 2.27 | 2.41 | 2.66 | 3.08 | 3.66 | 4.35 | 4.84 |
| 40-44 | 843 | 3.40 | 0.80 | 2.32 | 2.47 | 2.81 | 3.27 | 3.88 | 4.50 | 4.85 |
| 45-49 | 633 | 3.56 | 0.88 | 2.40 | 2.57 | 2.91 | 3.41 | 4.07 | 4.71 | 5.23 |
| 50-54 | 274 | 3.72 | 0.85 | 2.51 | 2.71 | 3.09 | 3.62 | 4.26 | 4.93 | 5.31 |
| Postmenopausal female (n=3405) | ||||||||||
| 45-49 | 113 | 3.69 | 0.91 | 2.39 | 2.56 | 3.02 | 3.61 | 4.23 | 4.87 | 5.49 |
| 50-54 | 578 | 3.90 | 1.03 | 2.56 | 2.74 | 3.11 | 3.70 | 4.46 | 5.36 | 5.91 |
| 55-59 | 590 | 4.08 | 0.99 | 2.59 | 2.89 | 3.42 | 3.97 | 4.66 | 5.32 | 5.85 |
| 60-64 | 540 | 4.14 | 1.02 | 2.63 | 2.86 | 3.32 | 4.08 | 4.85 | 5.57 | 5.96 |
| 65-69 | 466 | 4.15 | 1.04 | 2.61 | 2.90 | 3.38 | 4.03 | 4.76 | 5.63 | 6.07 |
| 70-74 | 542 | 4.15 | 1.08 | 2.59 | 2.80 | 3.33 | 4.06 | 4.88 | 5.53 | 6.03 |
| 75-79 | 387 | 4.14 | 1.09 | 2.68 | 2.91 | 3.39 | 4.02 | 4.73 | 5.59 | 6.03 |
| 80+ | 189 | 4.27 | 1.03 | 2.84 | 3.03 | 3.50 | 4.16 | 4.90 | 5.60 | 6.03 |
Supplementary Table 10. Distribution of total cholesterol/high density lipoprotein-cholesterol ratio by age, sex, menopausal status not excluding people taking lipid-lowering agents.
| Age | Number | Mean | Standard deviation | Percentiles | ||||||
|---|---|---|---|---|---|---|---|---|---|---|
| 5th | 10th | 25th | 50th | 75th | 90th | 95th | ||||
| Male (n=8656) | ||||||||||
| 10-14 | 788 | 3.0 | 0.6 | 2.10 | 2.23 | 2.50 | 2.85 | 3.33 | 3.89 | 4.19 |
| 15-19 | 566 | 3.1 | 0.7 | 2.17 | 2.28 | 2.62 | 2.98 | 3.43 | 3.97 | 4.44 |
| 20-24 | 327 | 3.3 | 0.9 | 2.14 | 2.32 | 2.68 | 3.12 | 3.74 | 4.36 | 4.98 |
| 25-29 | 432 | 3.7 | 1.0 | 2.30 | 2.52 | 2.98 | 3.57 | 4.32 | 5.12 | 5.64 |
| 30-34 | 550 | 4.0 | 1.1 | 2.41 | 2.67 | 3.20 | 3.84 | 4.65 | 5.48 | 5.88 |
| 35-39 | 773 | 4.1 | 1.1 | 2.48 | 2.72 | 3.27 | 4.02 | 4.76 | 5.51 | 6.06 |
| 40-44 | 742 | 4.1 | 1.1 | 2.56 | 2.80 | 3.33 | 4.04 | 4.86 | 5.62 | 6.10 |
| 45-49 | 640 | 4.2 | 1.1 | 2.61 | 2.90 | 3.45 | 4.13 | 4.89 | 5.73 | 6.13 |
| 50-54 | 704 | 4.2 | 1.2 | 2.57 | 2.87 | 3.34 | 4.04 | 4.77 | 5.62 | 6.13 |
| 55-59 | 691 | 4.1 | 1.1 | 2.40 | 2.71 | 3.25 | 3.94 | 4.74 | 5.51 | 6.06 |
| 60-64 | 714 | 3.9 | 1.1 | 2.42 | 2.63 | 3.07 | 3.82 | 4.66 | 5.37 | 5.72 |
| 65-69 | 621 | 3.9 | 1.1 | 2.37 | 2.58 | 3.14 | 3.81 | 4.67 | 5.31 | 5.72 |
| 70-74 | 611 | 3.9 | 1.1 | 2.40 | 2.62 | 3.06 | 3.81 | 4.60 | 5.36 | 5.93 |
| 75-79 | 360 | 3.9 | 1.1 | 2.40 | 2.58 | 3.02 | 3.72 | 4.58 | 5.32 | 5.99 |
| 80+ | 137 | 3.8 | 1.1 | 2.32 | 2.52 | 3.03 | 3.62 | 4.23 | 5.32 | 6.48 |
| Premenopausal female (n=5869) | ||||||||||
| 10-14 | 675 | 3.1 | 0.7 | 2.26 | 2.41 | 2.61 | 2.97 | 3.40 | 3.91 | 4.35 |
| 15-19 | 524 | 2.9 | 0.7 | 2.09 | 2.21 | 2.49 | 2.81 | 3.23 | 3.77 | 4.19 |
| 20-24 | 470 | 2.9 | 0.7 | 2.07 | 2.21 | 2.43 | 2.78 | 3.17 | 3.69 | 4.26 |
| 25-29 | 593 | 3.0 | 0.8 | 2.08 | 2.24 | 2.52 | 2.84 | 3.34 | 4.00 | 4.53 |
| 30-34 | 790 | 3.1 | 0.8 | 2.16 | 2.28 | 2.56 | 2.98 | 3.56 | 4.15 | 4.70 |
| 35-39 | 1043 | 3.3 | 0.8 | 2.27 | 2.41 | 2.66 | 3.08 | 3.66 | 4.35 | 4.84 |
| 40-44 | 850 | 3.4 | 0.8 | 2.31 | 2.47 | 2.81 | 3.27 | 3.88 | 4.51 | 4.87 |
| 45-49 | 645 | 3.6 | 0.9 | 2.39 | 2.57 | 2.91 | 3.40 | 4.07 | 4.71 | 5.16 |
| 50-54 | 279 | 3.7 | 0.9 | 2.50 | 2.69 | 3.08 | 3.61 | 4.26 | 4.95 | 5.31 |
| Postmenopausal female (n=3909) | ||||||||||
| 45-49 | 119 | 3.7 | 1.0 | 2.39 | 2.56 | 3.02 | 3.61 | 4.23 | 5.04 | 5.56 |
| 50-54 | 617 | 3.9 | 1.0 | 2.51 | 2.70 | 3.08 | 3.66 | 4.44 | 5.36 | 5.90 |
| 55-59 | 670 | 4.0 | 1.0 | 2.57 | 2.82 | 3.33 | 3.91 | 4.60 | 5.29 | 5.83 |
| 60-64 | 648 | 4.0 | 1.0 | 2.55 | 2.79 | 3.24 | 3.95 | 4.72 | 5.44 | 5.85 |
| 65-69 | 578 | 4.0 | 1.0 | 2.52 | 2.79 | 3.25 | 3.89 | 4.66 | 5.54 | 5.90 |
| 70-74 | 638 | 4.1 | 1.1 | 2.49 | 2.74 | 3.22 | 3.97 | 4.78 | 5.50 | 5.98 |
| 75-79 | 441 | 4.1 | 1.1 | 2.64 | 2.86 | 3.30 | 3.91 | 4.63 | 5.46 | 5.91 |
| 80+ | 198 | 4.3 | 1.0 | 2.84 | 3.06 | 3.48 | 4.14 | 4.88 | 5.54 | 6.03 |
Supplementary Table 11. Distribution of low density lipoprotein-cholesterol/high density lipoprotein-cholesterol ratio by age, sex, menopausal status.
| Age | Number | Mean | Standard deviation | Percentiles | ||||||
|---|---|---|---|---|---|---|---|---|---|---|
| 5th | 10th | 25th | 50th | 75th | 90th | 95th | ||||
| Male (n=8284) | ||||||||||
| 10-14 | 788 | 1.66 | 0.52 | 0.91 | 1.04 | 1.29 | 1.59 | 1.97 | 2.38 | 2.62 |
| 15-19 | 566 | 1.74 | 0.62 | 0.92 | 1.05 | 1.34 | 1.65 | 2.02 | 2.50 | 2.86 |
| 20-24 | 327 | 1.89 | 0.70 | 0.99 | 1.12 | 1.40 | 1.77 | 2.28 | 2.75 | 3.14 |
| 25-29 | 431 | 2.14 | 0.78 | 1.01 | 1.22 | 1.59 | 2.05 | 2.59 | 3.19 | 3.61 |
| 30-34 | 553 | 2.34 | 0.86 | 1.03 | 1.37 | 1.76 | 2.23 | 2.82 | 3.33 | 3.81 |
| 35-39 | 786 | 2.39 | 0.87 | 1.11 | 1.38 | 1.80 | 2.31 | 2.94 | 3.46 | 3.93 |
| 40-44 | 740 | 2.41 | 0.88 | 1.14 | 1.38 | 1.81 | 2.34 | 2.97 | 3.52 | 3.95 |
| 45-49 | 626 | 2.48 | 0.90 | 1.13 | 1.43 | 1.84 | 2.42 | 3.02 | 3.68 | 4.00 |
| 50-54 | 673 | 2.39 | 0.89 | 1.07 | 1.42 | 1.79 | 2.33 | 2.88 | 3.59 | 4.07 |
| 55-59 | 637 | 2.40 | 0.92 | 1.05 | 1.29 | 1.76 | 2.32 | 2.91 | 3.57 | 3.94 |
| 60-64 | 648 | 2.29 | 0.86 | 1.05 | 1.29 | 1.63 | 2.22 | 2.82 | 3.48 | 3.79 |
| 65-69 | 558 | 2.34 | 0.87 | 0.95 | 1.28 | 1.74 | 2.26 | 2.89 | 3.49 | 3.81 |
| 70-74 | 563 | 2.37 | 0.92 | 1.10 | 1.30 | 1.70 | 2.27 | 2.91 | 3.62 | 3.97 |
| 75-79 | 341 | 2.34 | 0.87 | 1.08 | 1.27 | 1.71 | 2.27 | 2.89 | 3.48 | 3.88 |
| 80+ | 129 | 2.33 | 0.93 | 1.16 | 1.22 | 1.68 | 2.26 | 2.73 | 3.58 | 4.18 |
| Premenopausal female (n=5841) | ||||||||||
| 10-14 | 675 | 1.72 | 0.52 | 1.01 | 1.15 | 1.37 | 1.64 | 2.00 | 2.39 | 2.68 |
| 15-19 | 524 | 1.64 | 0.54 | 0.92 | 1.02 | 1.28 | 1.54 | 1.92 | 2.34 | 2.63 |
| 20-24 | 470 | 1.61 | 0.56 | 0.88 | 1.00 | 1.22 | 1.54 | 1.88 | 2.29 | 2.79 |
| 25-29 | 593 | 1.70 | 0.63 | 0.92 | 1.05 | 1.29 | 1.60 | 2.02 | 2.44 | 2.81 |
| 30-34 | 790 | 1.80 | 0.63 | 0.97 | 1.10 | 1.35 | 1.72 | 2.17 | 2.59 | 3.04 |
| 35-39 | 1039 | 1.91 | 0.67 | 1.05 | 1.19 | 1.44 | 1.80 | 2.23 | 2.81 | 3.12 |
| 40-44 | 843 | 2.03 | 0.65 | 1.12 | 1.27 | 1.56 | 1.95 | 2.40 | 2.89 | 3.23 |
| 45-49 | 633 | 2.13 | 0.71 | 1.13 | 1.33 | 1.63 | 2.05 | 2.55 | 3.05 | 3.44 |
| 50-54 | 274 | 2.29 | 0.67 | 1.32 | 1.47 | 1.79 | 2.21 | 2.78 | 3.21 | 3.42 |
| Postmenopausal female (n=3405) | ||||||||||
| 45-49 | 113 | 2.22 | 0.70 | 1.14 | 1.31 | 1.74 | 2.23 | 2.64 | 3.16 | 3.43 |
| 50-54 | 578 | 2.39 | 0.80 | 1.32 | 1.47 | 1.80 | 2.29 | 2.85 | 3.44 | 3.76 |
| 55-59 | 590 | 2.55 | 0.79 | 1.36 | 1.60 | 2.02 | 2.49 | 3.01 | 3.55 | 3.97 |
| 60-64 | 540 | 2.57 | 0.81 | 1.31 | 1.54 | 1.94 | 2.55 | 3.10 | 3.68 | 3.99 |
| 65-69 | 466 | 2.53 | 0.81 | 1.36 | 1.53 | 1.99 | 2.45 | 3.00 | 3.64 | 4.02 |
| 70-74 | 542 | 2.55 | 0.86 | 1.29 | 1.50 | 1.90 | 2.47 | 3.09 | 3.67 | 4.14 |
| 75-79 | 387 | 2.54 | 0.85 | 1.32 | 1.61 | 1.95 | 2.48 | 2.98 | 3.73 | 4.01 |
| 80+ | 189 | 2.63 | 0.84 | 1.40 | 1.68 | 2.04 | 2.50 | 3.21 | 3.68 | 4.14 |
Supplementary Table 12. Distribution of low density lipoprotein-cholesterol/high density lipoprotein-cholesterol ratio by age, sex, menopausal status not excluding people taking lipid-lowering agents.
| Age | Number | Mean | Standard deviation | Percentiles | ||||||
|---|---|---|---|---|---|---|---|---|---|---|
| 5th | 10th | 25th | 50th | 75th | 90th | 95th | ||||
| Male (n=8656) | ||||||||||
| 10-14 | 788 | 1.7 | 0.5 | 0.91 | 1.04 | 1.29 | 1.59 | 1.97 | 2.38 | 2.62 |
| 15-19 | 566 | 1.7 | 0.6 | 0.92 | 1.05 | 1.34 | 1.65 | 2.02 | 2.50 | 2.86 |
| 20-24 | 327 | 1.9 | 0.7 | 0.99 | 1.12 | 1.40 | 1.77 | 2.28 | 2.75 | 3.14 |
| 25-29 | 432 | 2.2 | 0.8 | 1.04 | 1.23 | 1.61 | 2.09 | 2.62 | 3.21 | 3.62 |
| 30-34 | 550 | 2.4 | 0.9 | 1.11 | 1.41 | 1.80 | 2.27 | 2.84 | 3.33 | 3.85 |
| 35-39 | 773 | 2.4 | 0.9 | 1.17 | 1.40 | 1.82 | 2.34 | 2.95 | 3.51 | 3.96 |
| 40-44 | 742 | 2.4 | 0.9 | 1.19 | 1.40 | 1.83 | 2.35 | 2.95 | 3.50 | 3.91 |
| 45-49 | 640 | 2.5 | 0.9 | 1.21 | 1.47 | 1.85 | 2.41 | 3.01 | 3.68 | 4.04 |
| 50-54 | 704 | 2.4 | 0.9 | 1.18 | 1.45 | 1.83 | 2.33 | 2.92 | 3.59 | 4.07 |
| 55-59 | 691 | 2.4 | 0.9 | 1.08 | 1.29 | 1.73 | 2.28 | 2.87 | 3.52 | 3.92 |
| 60-64 | 714 | 2.3 | 0.9 | 0.98 | 1.29 | 1.60 | 2.19 | 2.81 | 3.44 | 3.79 |
| 65-69 | 621 | 2.3 | 0.9 | 0.97 | 1.26 | 1.70 | 2.22 | 2.86 | 3.44 | 3.78 |
| 70-74 | 611 | 2.3 | 0.9 | 1.08 | 1.28 | 1.65 | 2.22 | 2.89 | 3.58 | 3.93 |
| 75-79 | 360 | 2.3 | 0.9 | 1.08 | 1.25 | 1.67 | 2.23 | 2.88 | 3.50 | 3.93 |
| 80+ | 137 | 2.3 | 0.9 | 1.14 | 1.22 | 1.65 | 2.19 | 2.73 | 3.55 | 4.18 |
| Premenopausal female (n=5869) | ||||||||||
| 10-14 | 675 | 1.7 | 0.5 | 1.01 | 1.15 | 1.37 | 1.64 | 2.00 | 2.39 | 2.68 |
| 15-19 | 524 | 1.6 | 0.5 | 0.92 | 1.02 | 1.28 | 1.54 | 1.92 | 2.34 | 2.63 |
| 20-24 | 470 | 1.6 | 0.6 | 0.88 | 1.00 | 1.22 | 1.54 | 1.88 | 2.29 | 2.79 |
| 25-29 | 593 | 1.7 | 0.6 | 0.92 | 1.05 | 1.29 | 1.60 | 2.02 | 2.44 | 2.81 |
| 30-34 | 790 | 1.8 | 0.6 | 0.97 | 1.10 | 1.35 | 1.72 | 2.17 | 2.59 | 3.04 |
| 35-39 | 1043 | 1.9 | 0.7 | 1.05 | 1.19 | 1.44 | 1.80 | 2.23 | 2.80 | 3.12 |
| 40-44 | 850 | 2.0 | 0.7 | 1.12 | 1.26 | 1.56 | 1.95 | 2.40 | 2.89 | 3.25 |
| 45-49 | 645 | 2.1 | 0.7 | 1.11 | 1.33 | 1.63 | 2.03 | 2.54 | 3.05 | 3.43 |
| 50-54 | 279 | 2.3 | 0.7 | 1.28 | 1.41 | 1.79 | 2.21 | 2.78 | 3.23 | 3.43 |
| Postmenopausal female (n=3909) | ||||||||||
| 45-49 | 119 | 2.2 | 0.8 | 1.14 | 1.31 | 1.74 | 2.20 | 2.64 | 3.23 | 3.46 |
| 50-54 | 617 | 2.4 | 0.8 | 1.26 | 1.44 | 1.77 | 2.26 | 2.83 | 3.44 | 3.76 |
| 55-59 | 670 | 2.5 | 0.8 | 1.26 | 1.46 | 1.91 | 2.43 | 2.95 | 3.53 | 3.90 |
| 60-64 | 648 | 2.5 | 0.8 | 1.24 | 1.41 | 1.84 | 2.42 | 3.00 | 3.60 | 3.93 |
| 65-69 | 578 | 2.4 | 0.8 | 1.21 | 1.42 | 1.83 | 2.30 | 2.91 | 3.48 | 3.97 |
| 70-74 | 638 | 2.5 | 0.9 | 1.20 | 1.40 | 1.80 | 2.40 | 2.99 | 3.60 | 4.09 |
| 75-79 | 441 | 2.5 | 0.9 | 1.27 | 1.51 | 1.86 | 2.42 | 2.92 | 3.53 | 3.96 |
| 80+ | 198 | 2.6 | 0.8 | 1.40 | 1.66 | 2.02 | 2.47 | 3.20 | 3.67 | 4.14 |
Supplementary Table 13. Distribution of triglycerides/high density lipoprotein-cholesterol ratio by age, sex, menopausal status.
| Age | Number | Mean | Standard deviation | Percentiles | ||||||
|---|---|---|---|---|---|---|---|---|---|---|
| 5th | 10th | 25th | 50th | 75th | 90th | 95th | ||||
| Male (n=8284) | ||||||||||
| 10-14 | 788 | 1.55 | 1.12 | 0.50 | 0.60 | 0.85 | 1.20 | 1.85 | 3.14 | 3.84 |
| 15-19 | 566 | 1.76 | 1.11 | 0.68 | 0.79 | 1.05 | 1.46 | 2.12 | 3.09 | 3.84 |
| 20-24 | 327 | 1.96 | 1.42 | 0.63 | 0.76 | 1.03 | 1.58 | 2.30 | 3.64 | 4.88 |
| 25-29 | 431 | 2.88 | 2.90 | 0.73 | 0.94 | 1.36 | 2.06 | 3.42 | 5.35 | 7.07 |
| 30-34 | 553 | 3.33 | 2.95 | 0.86 | 1.05 | 1.51 | 2.35 | 4.25 | 6.33 | 8.66 |
| 35-39 | 786 | 3.65 | 3.13 | 0.90 | 1.19 | 1.71 | 2.75 | 4.41 | 7.17 | 9.22 |
| 40-44 | 740 | 3.81 | 2.99 | 1.02 | 1.26 | 1.79 | 2.95 | 4.88 | 7.56 | 9.57 |
| 45-49 | 626 | 3.90 | 3.36 | 0.86 | 1.22 | 1.88 | 2.98 | 4.71 | 7.71 | 9.72 |
| 50-54 | 673 | 3.95 | 3.33 | 0.96 | 1.22 | 1.84 | 3.06 | 4.79 | 7.66 | 10.45 |
| 55-59 | 637 | 3.71 | 3.07 | 0.91 | 1.16 | 1.88 | 2.89 | 4.63 | 6.53 | 8.70 |
| 60-64 | 648 | 3.27 | 2.41 | 0.78 | 1.02 | 1.53 | 2.54 | 4.27 | 6.51 | 8.20 |
| 65-69 | 558 | 3.21 | 3.03 | 0.76 | 1.02 | 1.57 | 2.59 | 3.86 | 5.86 | 7.39 |
| 70-74 | 563 | 2.99 | 2.10 | 0.81 | 1.00 | 1.45 | 2.45 | 3.81 | 5.91 | 7.33 |
| 75-79 | 341 | 2.88 | 2.48 | 0.78 | 0.93 | 1.43 | 2.27 | 3.30 | 5.28 | 7.65 |
| 80+ | 129 | 2.70 | 2.64 | 0.82 | 0.93 | 1.32 | 2.07 | 3.00 | 5.36 | 5.96 |
| Premenopausal female (n=5841) | ||||||||||
| 10-14 | 675 | 1.78 | 1.31 | 0.62 | 0.72 | 1.00 | 1.40 | 2.14 | 3.14 | 4.13 |
| 15-19 | 524 | 1.47 | 1.04 | 0.55 | 0.63 | 0.86 | 1.20 | 1.70 | 2.38 | 3.26 |
| 20-24 | 470 | 1.37 | 1.05 | 0.51 | 0.61 | 0.82 | 1.14 | 1.56 | 2.32 | 2.72 |
| 25-29 | 593 | 1.56 | 1.29 | 0.48 | 0.58 | 0.84 | 1.16 | 1.75 | 3.05 | 4.14 |
| 30-34 | 790 | 1.67 | 1.34 | 0.51 | 0.62 | 0.85 | 1.28 | 2.00 | 3.05 | 3.90 |
| 35-39 | 1039 | 1.75 | 1.42 | 0.55 | 0.67 | 0.92 | 1.35 | 2.07 | 3.15 | 4.16 |
| 40-44 | 843 | 1.86 | 1.36 | 0.62 | 0.75 | 0.98 | 1.48 | 2.27 | 3.36 | 4.24 |
| 45-49 | 633 | 2.12 | 1.58 | 0.64 | 0.77 | 1.10 | 1.67 | 2.60 | 4.13 | 5.39 |
| 50-54 | 274 | 2.15 | 1.48 | 0.69 | 0.83 | 1.10 | 1.78 | 2.62 | 3.85 | 5.48 |
| Postmenopausal female (n=3405) | ||||||||||
| 45-49 | 113 | 2.35 | 2.12 | 0.65 | 0.83 | 1.11 | 1.51 | 2.88 | 5.35 | 7.65 |
| 50-54 | 578 | 2.57 | 2.02 | 0.71 | 0.88 | 1.28 | 1.91 | 3.18 | 5.16 | 6.67 |
| 55-59 | 590 | 2.68 | 2.04 | 0.73 | 0.92 | 1.35 | 2.12 | 3.43 | 5.06 | 6.26 |
| 60-64 | 540 | 2.89 | 2.02 | 0.82 | 1.02 | 1.43 | 2.36 | 3.67 | 5.55 | 7.01 |
| 65-69 | 466 | 3.07 | 2.10 | 0.88 | 1.03 | 1.53 | 2.45 | 4.06 | 5.98 | 7.00 |
| 70-74 | 542 | 3.02 | 2.18 | 0.86 | 1.11 | 1.64 | 2.45 | 3.95 | 5.83 | 6.88 |
| 75-79 | 387 | 2.98 | 2.06 | 0.93 | 1.05 | 1.61 | 2.39 | 3.70 | 5.44 | 7.12 |
| 80+ | 189 | 3.20 | 1.97 | 1.02 | 1.30 | 1.83 | 2.63 | 4.03 | 5.70 | 7.26 |
Supplementary Table 14. Distribution of triglycerides/high density lipoprotein-cholesterol ratio by age, sex, menopausal status not excluding people taking lipid-lowering agents.
| Age | Number | Mean | Standard deviation | Percentiles | ||||||
|---|---|---|---|---|---|---|---|---|---|---|
| 5th | 10th | 25th | 50th | 75th | 90th | 95th | ||||
| Male (n=8656) | ||||||||||
| 10-14 | 788 | 1.6 | 1.1 | 0.50 | 0.60 | 0.85 | 1.20 | 1.85 | 3.14 | 3.84 |
| 15-19 | 566 | 1.8 | 1.1 | 0.68 | 0.79 | 1.05 | 1.46 | 2.12 | 3.09 | 3.84 |
| 20-24 | 327 | 2.0 | 1.4 | 0.63 | 0.76 | 1.03 | 1.58 | 2.30 | 3.64 | 4.88 |
| 25-29 | 432 | 2.9 | 2.9 | 0.73 | 0.94 | 1.37 | 2.06 | 3.42 | 5.38 | 7.22 |
| 30-34 | 550 | 3.2 | 2.8 | 0.86 | 1.05 | 1.49 | 2.33 | 4.21 | 6.26 | 8.43 |
| 35-39 | 773 | 3.4 | 2.5 | 0.90 | 1.18 | 1.68 | 2.71 | 4.20 | 6.36 | 7.92 |
| 40-44 | 742 | 3.7 | 2.8 | 1.02 | 1.27 | 1.79 | 2.91 | 4.81 | 7.09 | 8.68 |
| 45-49 | 640 | 3.8 | 3.1 | 0.87 | 1.23 | 1.89 | 2.97 | 4.63 | 7.42 | 9.04 |
| 50-54 | 704 | 3.8 | 2.8 | 0.96 | 1.22 | 1.85 | 3.05 | 4.71 | 7.24 | 9.00 |
| 55-59 | 691 | 3.6 | 2.8 | 0.92 | 1.17 | 1.85 | 2.85 | 4.56 | 6.44 | 8.21 |
| 60-64 | 714 | 3.3 | 2.4 | 0.80 | 1.03 | 1.59 | 2.57 | 4.27 | 6.45 | 8.15 |
| 65-69 | 621 | 3.1 | 2.2 | 0.79 | 1.04 | 1.58 | 2.58 | 3.96 | 5.80 | 7.17 |
| 70-74 | 611 | 3.0 | 2.0 | 0.81 | 1.02 | 1.47 | 2.43 | 3.78 | 5.65 | 7.11 |
| 75-79 | 360 | 2.8 | 2.3 | 0.76 | 0.91 | 1.42 | 2.23 | 3.30 | 5.30 | 7.46 |
| 80+ | 137 | 2.5 | 1.7 | 0.82 | 0.93 | 1.29 | 2.02 | 2.98 | 5.16 | 5.96 |
| Premenopausal female (n=5869) | ||||||||||
| 10-14 | 675 | 1.8 | 1.3 | 0.62 | 0.72 | 1.00 | 1.40 | 2.14 | 3.14 | 4.13 |
| 15-19 | 524 | 1.5 | 1.0 | 0.55 | 0.63 | 0.86 | 1.20 | 1.70 | 2.38 | 3.26 |
| 20-24 | 470 | 1.4 | 1.1 | 0.51 | 0.61 | 0.82 | 1.14 | 1.56 | 2.32 | 2.72 |
| 25-29 | 593 | 1.6 | 1.3 | 0.48 | 0.58 | 0.84 | 1.16 | 1.75 | 3.05 | 4.14 |
| 30-34 | 790 | 1.7 | 1.3 | 0.51 | 0.62 | 0.85 | 1.28 | 2.00 | 3.05 | 3.90 |
| 35-39 | 1043 | 1.8 | 1.4 | 0.56 | 0.67 | 0.92 | 1.35 | 2.08 | 3.15 | 4.16 |
| 40-44 | 850 | 1.9 | 1.4 | 0.62 | 0.76 | 0.99 | 1.49 | 2.28 | 3.46 | 4.36 |
| 45-49 | 645 | 2.1 | 1.6 | 0.65 | 0.77 | 1.11 | 1.68 | 2.61 | 4.15 | 5.39 |
| 50-54 | 279 | 2.2 | 1.5 | 0.69 | 0.83 | 1.10 | 1.78 | 2.67 | 3.90 | 5.48 |
| Postmenopausal female (n=3909) | ||||||||||
| 45-49 | 119 | 2.5 | 2.2 | 0.65 | 0.83 | 1.11 | 1.51 | 3.14 | 5.79 | 7.65 |
| 50-54 | 617 | 2.6 | 2.0 | 0.71 | 0.88 | 1.29 | 1.91 | 3.18 | 5.16 | 6.66 |
| 55-59 | 670 | 2.7 | 2.0 | 0.73 | 0.92 | 1.35 | 2.16 | 3.44 | 5.08 | 6.39 |
| 60-64 | 648 | 2.9 | 2.0 | 0.82 | 1.02 | 1.45 | 2.32 | 3.69 | 5.57 | 6.83 |
| 65-69 | 578 | 3.1 | 2.0 | 0.89 | 1.07 | 1.57 | 2.50 | 4.02 | 5.94 | 7.02 |
| 70-74 | 638 | 3.0 | 2.1 | 0.82 | 1.05 | 1.62 | 2.43 | 3.89 | 5.66 | 6.87 |
| 75-79 | 441 | 2.9 | 2.0 | 0.93 | 1.10 | 1.61 | 2.38 | 3.63 | 5.32 | 7.12 |
| 80+ | 198 | 3.2 | 1.9 | 1.02 | 1.31 | 1.87 | 2.70 | 4.03 | 5.70 | 7.26 |
Supplementary Table 15. Distribution of non-high density lipoprotein-cholesterol (mg/dL) by age, sex, menopausal status.
| Age | Number | Mean | Standard deviation | Percentiles | ||||||
|---|---|---|---|---|---|---|---|---|---|---|
| 5th | 10th | 25th | 50th | 75th | 90th | 95th | ||||
| Male (n=8284) | ||||||||||
| 10-14 | 788 | 102.5 | 24.8 | 65 | 74 | 85 | 100 | 118 | 134 | 144 |
| 15-19 | 566 | 100.9 | 26.5 | 65 | 70 | 83 | 98 | 115 | 133 | 145 |
| 20-24 | 327 | 114.7 | 29.8 | 74 | 81 | 92 | 109 | 133 | 153 | 170 |
| 25-29 | 431 | 128.6 | 32.6 | 82 | 89 | 105 | 126 | 149 | 171 | 186 |
| 30-34 | 553 | 139.4 | 35.7 | 84 | 95 | 116 | 139 | 163 | 182 | 195 |
| 35-39 | 786 | 144.9 | 35.0 | 91 | 103 | 120 | 144 | 167 | 191 | 210 |
| 40-44 | 740 | 146.1 | 37.0 | 90 | 102 | 122 | 144 | 169 | 191 | 203 |
| 45-49 | 626 | 149.2 | 38.3 | 95 | 103 | 124 | 146 | 172 | 195 | 214 |
| 50-54 | 673 | 147.1 | 34.2 | 96 | 106 | 124 | 146 | 168 | 191 | 205 |
| 55-59 | 637 | 143.8 | 37.0 | 88 | 97 | 118 | 142 | 166 | 188 | 206 |
| 60-64 | 648 | 137.5 | 33.8 | 83 | 94 | 113 | 136 | 160 | 181 | 196 |
| 65-69 | 558 | 135.4 | 33.5 | 82 | 92 | 114 | 134 | 157 | 178 | 189 |
| 70-74 | 563 | 135.2 | 35.2 | 82 | 95 | 110 | 133 | 156 | 179 | 195 |
| 75-79 | 341 | 131.4 | 33.6 | 80 | 91 | 109 | 130 | 152 | 176 | 192 |
| 80+ | 129 | 126.1 | 32.5 | 77 | 84 | 102 | 124 | 142 | 171 | 185 |
| Premenopausal female (n=5841) | ||||||||||
| 10-14 | 675 | 109.1 | 23.6 | 73 | 81 | 93 | 106 | 123 | 140 | 150 |
| 15-19 | 524 | 105.4 | 25.3 | 69 | 76 | 88 | 102 | 119 | 137 | 153 |
| 20-24 | 470 | 107.3 | 26.7 | 71 | 77 | 89 | 104 | 123 | 142 | 155 |
| 25-29 | 593 | 114.1 | 29.8 | 75 | 83 | 95 | 110 | 129 | 151 | 171 |
| 30-34 | 790 | 118.4 | 30.6 | 76 | 83 | 96 | 114 | 136 | 158 | 175 |
| 35-39 | 1039 | 122.9 | 31.6 | 80 | 87 | 100 | 119 | 140 | 163 | 180 |
| 40-44 | 843 | 127.2 | 29.6 | 83 | 92 | 107 | 125 | 144 | 167 | 180 |
| 45-49 | 633 | 137.6 | 32.9 | 89 | 96 | 115 | 136 | 156 | 179 | 195 |
| 50-54 | 274 | 144.8 | 31.4 | 97 | 104 | 121 | 144 | 166 | 184 | 200 |
| Postmenopausal female (n=3405) | ||||||||||
| 45-49 | 113 | 139.4 | 30.8 | 96 | 104 | 116 | 140 | 158 | 171 | 194 |
| 50-54 | 578 | 152.9 | 35.5 | 102 | 111 | 128 | 150 | 172 | 198 | 218 |
| 55-59 | 590 | 156.7 | 35.3 | 100 | 112 | 132 | 156 | 180 | 203 | 217 |
| 60-64 | 540 | 154.7 | 34.4 | 98 | 110 | 131 | 154 | 179 | 198 | 211 |
| 65-69 | 466 | 154.0 | 35.6 | 97 | 109 | 128 | 154 | 177 | 200 | 210 |
| 70-74 | 542 | 150.7 | 36.0 | 93 | 103 | 127 | 150 | 174 | 197 | 208 |
| 75-79 | 387 | 148.4 | 36.0 | 94 | 102 | 125 | 148 | 167 | 191 | 209 |
| 80+ | 189 | 149.6 | 34.6 | 100 | 109 | 125 | 147 | 167 | 195 | 215 |
Supplementary Table 16. Distribution of non-high density lipoprotein-cholesterol (mg/dL) by age, sex, menopausal status not excluding people taking lipid-lowering agents.
| Age | Number | Mean | Standard deviation | Percentiles | ||||||
|---|---|---|---|---|---|---|---|---|---|---|
| 5th | 10th | 25th | 50th | 75th | 90th | 95th | ||||
| Male (n=8656) | ||||||||||
| 10-14 | 788 | 102.5 | 24.8 | 65 | 74 | 85 | 100 | 118 | 134 | 144 |
| 15-19 | 566 | 100.9 | 26.5 | 65 | 70 | 83 | 98 | 115 | 133 | 145 |
| 20-24 | 327 | 114.7 | 29.8 | 74 | 81 | 92 | 109 | 133 | 153 | 170 |
| 25-29 | 432 | 128.8 | 32.9 | 82 | 89 | 105 | 126 | 150 | 172 | 187 |
| 30-34 | 550 | 139.0 | 35.3 | 84 | 95 | 116 | 139 | 163 | 182 | 194 |
| 35-39 | 773 | 144.0 | 34.6 | 90 | 102 | 119 | 143 | 166 | 189 | 207 |
| 40-44 | 742 | 144.8 | 36.3 | 90 | 102 | 122 | 143 | 167 | 190 | 202 |
| 45-49 | 640 | 147.9 | 38.5 | 93 | 102 | 124 | 145 | 171 | 192 | 212 |
| 50-54 | 704 | 145.9 | 35.5 | 94 | 103 | 122 | 144 | 167 | 191 | 205 |
| 55-59 | 691 | 141.0 | 37.2 | 85 | 94 | 115 | 140 | 164 | 185 | 204 |
| 60-64 | 714 | 135.8 | 34.3 | 81 | 89 | 110 | 134 | 159 | 181 | 193 |
| 65-69 | 621 | 132.6 | 32.9 | 80 | 88 | 112 | 131 | 154 | 175 | 188 |
| 70-74 | 611 | 133.2 | 34.5 | 79 | 93 | 108 | 131 | 155 | 178 | 194 |
| 75-79 | 360 | 130.1 | 33.9 | 78 | 90 | 107 | 128 | 151 | 176 | 192 |
| 80+ | 137 | 125.0 | 32.5 | 77 | 82 | 101 | 124 | 142 | 168 | 185 |
| Premenopausal female (n=5869) | ||||||||||
| 10-14 | 675 | 109.1 | 23.6 | 73 | 81 | 93 | 106 | 123 | 140 | 150 |
| 15-19 | 524 | 105.4 | 25.3 | 69 | 76 | 88 | 102 | 119 | 137 | 153 |
| 20-24 | 470 | 107.3 | 26.7 | 71 | 77 | 89 | 104 | 123 | 142 | 155 |
| 25-29 | 593 | 114.1 | 29.8 | 75 | 83 | 95 | 110 | 129 | 151 | 171 |
| 30-34 | 790 | 118.4 | 30.6 | 76 | 83 | 96 | 114 | 136 | 158 | 175 |
| 35-39 | 1043 | 122.9 | 31.6 | 80 | 87 | 100 | 119 | 140 | 162 | 179 |
| 40-44 | 850 | 127.1 | 29.8 | 82 | 92 | 106 | 125 | 143 | 168 | 181 |
| 45-49 | 645 | 137.1 | 32.9 | 89 | 95 | 114 | 135 | 156 | 179 | 193 |
| 50-54 | 279 | 144.7 | 31.5 | 97 | 103 | 120 | 144 | 166 | 186 | 200 |
| Postmenopausal female (n=3909) | ||||||||||
| 45-49 | 119 | 139.0 | 31.7 | 93 | 100 | 114 | 139 | 158 | 175 | 194 |
| 50-54 | 617 | 151.5 | 36.0 | 98 | 109 | 126 | 148 | 171 | 198 | 218 |
| 55-59 | 670 | 153.5 | 36.7 | 96 | 106 | 127 | 152 | 177 | 203 | 217 |
| 60-64 | 648 | 150.3 | 35.3 | 91 | 104 | 125 | 149 | 174 | 195 | 209 |
| 65-69 | 578 | 148.1 | 36.4 | 90 | 102 | 122 | 145 | 172 | 197 | 208 |
| 70-74 | 638 | 146.8 | 36.7 | 89 | 100 | 122 | 146 | 171 | 196 | 207 |
| 75-79 | 441 | 145.3 | 36.3 | 91 | 99 | 120 | 144 | 165 | 189 | 206 |
| 80+ | 198 | 149.2 | 34.6 | 98 | 109 | 124 | 147 | 167 | 195 | 217 |
References
- 1.Farzadfar F, Finucane MM, Danaei G, et al. National, regional, and global trends in serum total cholesterol since 1980: systematic analysis of health examination surveys and epidemiological studies with 321 country-years and 3·0 million participants. Lancet. 2011;377:578–586. doi: 10.1016/S0140-6736(10)62038-7. [DOI] [PubMed] [Google Scholar]
- 2.Stamler J, Wentworth D, Neaton JD. Is relationship between serum cholesterol and risk of premature death from coronary heart disease continuous and graded? Findings in 356,222 primary screenees of the Multiple Risk Factor Intervention Trial (MRFIT) JAMA. 1986;256:2823–2828. [PubMed] [Google Scholar]
- 3.Natarajan S, Glick H, Criqui M, Horowitz D, Lipsitz SR, Kinosian B. Cholesterol measures to identify and treat individuals at risk for coronary heart disease. Am J Prev Med. 2003;25:50–57. doi: 10.1016/s0749-3797(03)00092-8. [DOI] [PubMed] [Google Scholar]
- 4.Gordon DJ, Probstfield JL, Garrison RJ, et al. High-density lipoprotein cholesterol and cardiovascular disease. Four prospective American studies. Circulation. 1989;79:8–15. doi: 10.1161/01.cir.79.1.8. [DOI] [PubMed] [Google Scholar]
- 5.Kinosian B, Glick H, Preiss L, Puder KL. Cholesterol and coronary heart disease: predicting risks in men by changes in levels and ratios. J Investig Med. 1995;43:443–450. [PubMed] [Google Scholar]
- 6.Kastelein JJ, van der Steeg WA, Holme I, et al. Lipids, apolipoproteins, and their ratios in relation to cardiovascular events with statin treatment. Circulation. 2008;117:3002–3009. doi: 10.1161/CIRCULATIONAHA.107.713438. [DOI] [PubMed] [Google Scholar]
- 7.Anderson KM, Wilson PW, Odell PM, Kannel WB. An updated coronary risk profile. A statement for health professionals. Circulation. 1991;83:356–362. doi: 10.1161/01.cir.83.1.356. [DOI] [PubMed] [Google Scholar]
- 8.Hokanson JE, Austin MA. Plasma triglyceride level is a risk factor for cardiovascular disease independent of high-density lipoprotein cholesterol level: a meta-analysis of population-based prospective studies. J Cardiovasc Risk. 1996;3:213–219. [PubMed] [Google Scholar]
- 9.Assmann G, Schulte H, Funke H, von Eckardstein A. The emergence of triglycerides as a significant independent risk factor in coronary artery disease. Eur Heart J. 1998;19(Suppl M):M8–M14. [PubMed] [Google Scholar]
- 10.Malik S, Wong ND, Franklin SS, et al. Impact of the metabolic syndrome on mortality from coronary heart disease, cardiovascular disease, and all causes in United States adults. Circulation. 2004;110:1245–1250. doi: 10.1161/01.CIR.0000140677.20606.0E. [DOI] [PubMed] [Google Scholar]
- 11.Wannamethee SG, Shaper AG, Lennon L, Morris RW. Metabolic syndrome vs Framingham Risk Score for prediction of coronary heart disease, stroke, and type 2 diabetes mellitus. Arch Intern Med. 2005;165:2644–2650. doi: 10.1001/archinte.165.22.2644. [DOI] [PubMed] [Google Scholar]
- 12.Gaziano JM, Hennekens CH, O'Donnell CJ, Breslow JL, Buring JE. Fasting triglycerides, high-density lipoprotein, and risk of myocardial infarction. Circulation. 1997;96:2520–2525. doi: 10.1161/01.cir.96.8.2520. [DOI] [PubMed] [Google Scholar]
- 13.Packard CJ, Saito Y. Non-HDL cholesterol as a measure of atherosclerotic risk. J Atheroscler Thromb. 2004;11:6–14. doi: 10.5551/jat.11.6. [DOI] [PubMed] [Google Scholar]
- 14.Lee MH, Kim HC, Ahn SV, et al. Prevalence of Dyslipidemia among Korean Adults: Korea National Health and Nutrition Survey 1998-2005. Diabetes Metab J. 2012;36:43–55. doi: 10.4093/dmj.2012.36.1.43. [DOI] [PMC free article] [PubMed] [Google Scholar]
- 15.Roh E, Ko SH, Kwon HS, et al. Prevalence and Management of Dyslipidemia in Korea: Korea National Health and Nutrition Examination Survey during 1998 to 2010. Diabetes Metab J. 2013;37:433–449. doi: 10.4093/dmj.2013.37.6.433. [DOI] [PMC free article] [PubMed] [Google Scholar]
- 16.Nam GE, Han K, Park YG, et al. Trends in lipid profiles among South Korean adults: 2005, 2008 and 2010 Korea National Health and Nutrition Examination Survey. J Public Health (Oxf) 2014 Feb 25; doi: 10.1093/pubmed/fdu012. [Epub]. http://dx.doi.org/10.1093/pubmed/fdu012. [DOI] [PubMed] [Google Scholar]
- 17.Kweon S, Kim Y, Jang MJ, et al. Data resource profile: the Korea National Health and Nutrition Examination Survey (KNHANES) Int J Epidemiol. 2014;43:69–77. doi: 10.1093/ije/dyt228. [DOI] [PMC free article] [PubMed] [Google Scholar]
- 18.Friedewald WT, Levy RI, Fredrickson DS. Estimation of the concentration of low-density lipoprotein cholesterol in plasma, without use of the preparative ultracentrifuge. Clin Chem. 1972;18:499–502. [PubMed] [Google Scholar]
- 19.Castelli WP. Cholesterol and lipids in the risk of coronary artery disease--the Framingham Heart Study. Can J Cardiol. 1988;4(Suppl A):5A–10A. [PubMed] [Google Scholar]
- 20.Kosmas CE, Christodoulidis G, Cheng JW, Vittorio TJ, Lerakis S. High-density lipoprotein functionality in coronary artery disease. Am J Med Sci. 2014;347:504–508. doi: 10.1097/MAJ.0000000000000231. [DOI] [PubMed] [Google Scholar]
- 21.Assmann G, Schulte H, von Eckardstein A, Huang Y. High-density lipoprotein cholesterol as a predictor of coronary heart disease risk. The PROCAM experience and pathophysiological implications for reverse cholesterol transport. Atherosclerosis. 1996;124:S11–S20. doi: 10.1016/0021-9150(96)05852-2. [DOI] [PubMed] [Google Scholar]
- 22.Carroll MD, Kit BK, Lacher DA, Shero ST, Mussolino ME. Trends in lipids and lipoproteins in US adults, 1988-2010. JAMA. 2012;308:1545–1554. doi: 10.1001/jama.2012.13260. [DOI] [PubMed] [Google Scholar]
- 23.Yano Y, Irie N, Homma Y, et al. High density lipoprotein cholesterol levels in the Japanese. Atherosclerosis. 1980;36:173–181. doi: 10.1016/0021-9150(80)90226-9. [DOI] [PubMed] [Google Scholar]
- 24.Turley ML, Skeaff CM, Mann JI, Cox B. The effect of a low-fat, high-carbohydrate diet on serum high density lipoprotein cholesterol and triglyceride. Eur J Clin Nutr. 1998;52:728–732. doi: 10.1038/sj.ejcn.1600634. [DOI] [PubMed] [Google Scholar]
- 25.Feinleib M, Garrison RJ, Fabsitz R, et al. The NHLBI twin study of cardiovascular disease risk factors: methodology and summary of results. Am J Epidemiol. 1977;106:284–285. doi: 10.1093/oxfordjournals.aje.a112464. [DOI] [PubMed] [Google Scholar]
- 26.Schaefer EJ, Levy RI, Ernst ND, Van Sant FD, Brewer HB., Jr The effects of low cholesterol, high polyunsaturated fat, and low fat diets on plasma lipid and lipoprotein cholesterol levels in normal and hypercholesterolemic subjects. Am J Clin Nutr. 1981;34:1758–1763. doi: 10.1093/ajcn/34.9.1758. [DOI] [PubMed] [Google Scholar]
- 27.Sanders K, Johnson L, O'Dea K, Sinclair AJ. The effect of dietary fat level and quality on plasma lipoprotein lipids and plasma fatty acids in normocholesterolemic subjects. Lipids. 1994;29:129–138. doi: 10.1007/BF02537152. [DOI] [PubMed] [Google Scholar]
- 28.Schaefer EJ, Lamon-Fava S, Cohn SD, et al. Effects of age, gender, and menopausal status on plasma low density lipoprotein cholesterol and apolipoprotein B levels in the Framingham Offspring Study. J Lipid Res. 1994;35:779–792. [PubMed] [Google Scholar]
- 29.Granfone A, Campos H, McNamara JR, et al. Effects of estrogen replacement on plasma lipoproteins and apolipoproteins in postmenopausal, dyslipidemic women. Metabolism. 1992;41:1193–1198. doi: 10.1016/0026-0495(92)90008-x. [DOI] [PubMed] [Google Scholar]
- 30.Hwang YC, Ahn HY, Jeong IK, Ahn KJ, Chung HY. Optimal range of triglyceride values to estimate serum low density lipoprotein cholesterol concentration in Korean adults: the Korea National Health and Nutrition Examination Survey, 2009. J Korean Med Sci. 2012;27:1530–1535. doi: 10.3346/jkms.2012.27.12.1530. [DOI] [PMC free article] [PubMed] [Google Scholar]
Associated Data
This section collects any data citations, data availability statements, or supplementary materials included in this article.
Supplementary Materials
Supplementary Table 1. Distribution of total cholesterol (mg/dL) by age, sex, menopausal status.
| Age | Number | Mean | Standard deviation | Percentiles | ||||||
|---|---|---|---|---|---|---|---|---|---|---|
| 5th | 10th | 25th | 50th | 75th | 90th | 95th | ||||
| Male (n=8284) | ||||||||||
| 10-14 | 788 | 156.9 | 26.6 | 117 | 125 | 139 | 156 | 172 | 191 | 204 |
| 15-19 | 566 | 151.1 | 27.3 | 114 | 121 | 133 | 147 | 167 | 184 | 196 |
| 20-24 | 327 | 167.9 | 29.7 | 129 | 134 | 147 | 164 | 187 | 213 | 220 |
| 25-29 | 431 | 179.1 | 31.4 | 129 | 141 | 158 | 177 | 198 | 222 | 234 |
| 30-34 | 548 | 188.4 | 34.3 | 135 | 146 | 166 | 186 | 210 | 230 | 246 |
| 35-39 | 765 | 193.8 | 33.4 | 143 | 153 | 171 | 192 | 213 | 239 | 255 |
| 40-44 | 729 | 193.9 | 35.7 | 139 | 153 | 172 | 192 | 216 | 237 | 249 |
| 45-49 | 617 | 196.9 | 37.9 | 140 | 151 | 174 | 193 | 218 | 242 | 260 |
| 50-54 | 659 | 195.6 | 33.3 | 142 | 154 | 172 | 196 | 216 | 238 | 249 |
| 55-59 | 631 | 192.1 | 36.8 | 134 | 146 | 168 | 190 | 215 | 235 | 255 |
| 60-64 | 643 | 187.3 | 34.4 | 131 | 144 | 164 | 187 | 212 | 231 | 242 |
| 65-69 | 554 | 184.0 | 32.7 | 134 | 144 | 163 | 183 | 203 | 226 | 240 |
| 70-74 | 559 | 183.6 | 33.9 | 128 | 144 | 160 | 181 | 205 | 227 | 242 |
| 75-79 | 339 | 179.8 | 33.9 | 125 | 140 | 159 | 178 | 196 | 224 | 243 |
| 80+ | 128 | 173.5 | 33.6 | 120 | 129 | 150 | 174 | 194 | 217 | 232 |
| Premenopausal female (n=5841) | ||||||||||
| 10-14 | 675 | 163.8 | 25.3 | 125 | 133 | 147 | 163 | 178 | 198 | 210 |
| 15-19 | 524 | 162.3 | 26.3 | 125 | 132 | 144 | 159 | 178 | 196 | 211 |
| 20-24 | 470 | 167.2 | 28.5 | 124 | 133 | 148 | 164 | 184 | 203 | 216 |
| 25-29 | 593 | 174.1 | 31.0 | 130 | 141 | 153 | 170 | 191 | 214 | 231 |
| 30-34 | 790 | 176.9 | 32.9 | 129 | 139 | 154 | 174 | 195 | 220 | 236 |
| 35-39 | 1039 | 180.3 | 32.6 | 135 | 142 | 158 | 178 | 200 | 219 | 233 |
| 40-44 | 843 | 183.1 | 31.3 | 138 | 144 | 161 | 181 | 202 | 224 | 240 |
| 45-49 | 633 | 194.2 | 33.2 | 143 | 153 | 173 | 192 | 214 | 235 | 253 |
| 50-54 | 274 | 200.8 | 33.5 | 153 | 160 | 177 | 200 | 223 | 246 | 260 |
| Postmenopausal female (n=3405) | ||||||||||
| 45-49 | 113 | 194.6 | 31.5 | 143 | 157 | 176 | 190 | 211 | 229 | 254 |
| 50-54 | 578 | 208.9 | 35.9 | 155 | 167 | 186 | 207 | 226 | 255 | 274 |
| 55-59 | 590 | 210.1 | 36.6 | 153 | 165 | 183 | 210 | 234 | 257 | 271 |
| 60-64 | 540 | 206.8 | 35.6 | 148 | 161 | 183 | 207 | 230 | 250 | 266 |
| 65-69 | 466 | 205.6 | 36.2 | 150 | 159 | 182 | 205 | 228 | 252 | 267 |
| 70-74 | 542 | 201.4 | 36.5 | 142 | 156 | 177 | 200 | 223 | 248 | 265 |
| 75-79 | 387 | 198.4 | 36.9 | 144 | 152 | 173 | 197 | 219 | 244 | 264 |
| 80+ | 189 | 197.5 | 35.7 | 145 | 156 | 170 | 196 | 217 | 243 | 264 |
Supplementary Table 2. Distribution of total cholesterol (mg/dL) by age, sex, menopausal status not excluding people taking lipid-lowering agents.
| Age | Number | Mean | Standard deviation | Percentiles | ||||||
|---|---|---|---|---|---|---|---|---|---|---|
| 5th | 10th | 25th | 50th | 75th | 90th | 95th | ||||
| Male (n=8656) | ||||||||||
| 10-14 | 788 | 156.9 | 26.6 | 117 | 125 | 139 | 156 | 172 | 191 | 204 |
| 15-19 | 566 | 151.1 | 27.3 | 114 | 121 | 133 | 147 | 167 | 184 | 196 |
| 20-24 | 327 | 167.9 | 29.7 | 129 | 134 | 147 | 164 | 187 | 213 | 220 |
| 25-29 | 432 | 179.2 | 31.6 | 129 | 141 | 158 | 178 | 198 | 222 | 234 |
| 30-34 | 550 | 188.4 | 34.2 | 135 | 146 | 166 | 186 | 210 | 230 | 246 |
| 35-39 | 773 | 193.7 | 33.4 | 142 | 153 | 170 | 192 | 213 | 239 | 255 |
| 40-44 | 742 | 193.5 | 35.7 | 139 | 152 | 171 | 192 | 216 | 237 | 247 |
| 45-49 | 640 | 196.3 | 38.6 | 139 | 150 | 173 | 192 | 218 | 242 | 261 |
| 50-54 | 704 | 195.1 | 35.3 | 141 | 152 | 171 | 194 | 216 | 238 | 250 |
| 55-59 | 691 | 190.0 | 37.6 | 131 | 142 | 166 | 188 | 214 | 235 | 254 |
| 60-64 | 714 | 185.6 | 34.7 | 129 | 141 | 161 | 185 | 211 | 230 | 241 |
| 65-69 | 621 | 181.4 | 33.0 | 128 | 141 | 161 | 181 | 200 | 224 | 238 |
| 70-74 | 611 | 182.2 | 34.9 | 126 | 139 | 159 | 179 | 204 | 225 | 241 |
| 75-79 | 360 | 178.6 | 33.9 | 126 | 139 | 157 | 178 | 196 | 222 | 240 |
| 80+ | 137 | 173.2 | 33.4 | 120 | 130 | 148 | 173 | 196 | 217 | 232 |
| Premenopausal female (n=5869) | ||||||||||
| 10-14 | 675 | 163.8 | 25.3 | 125 | 133 | 147 | 163 | 178 | 198 | 210 |
| 15-19 | 524 | 162.3 | 26.3 | 125 | 132 | 144 | 159 | 178 | 196 | 211 |
| 20-24 | 470 | 167.2 | 28.5 | 124 | 133 | 148 | 164 | 184 | 203 | 216 |
| 25-29 | 593 | 174.1 | 31.0 | 130 | 141 | 153 | 170 | 191 | 214 | 231 |
| 30-34 | 790 | 176.9 | 32.9 | 129 | 139 | 154 | 174 | 195 | 220 | 236 |
| 35-39 | 1043 | 180.3 | 32.5 | 136 | 142 | 158 | 178 | 199 | 219 | 233 |
| 40-44 | 850 | 182.9 | 31.4 | 137 | 144 | 161 | 181 | 201 | 225 | 241 |
| 45-49 | 645 | 193.6 | 33.4 | 143 | 152 | 172 | 192 | 213 | 234 | 253 |
| 50-54 | 279 | 200.7 | 33.4 | 153 | 160 | 177 | 200 | 223 | 246 | 260 |
| Postmenopausal female (n=3909) | ||||||||||
| 45-49 | 119 | 193.5 | 32.3 | 139 | 152 | 175 | 190 | 211 | 230 | 254 |
| 50-54 | 617 | 207.6 | 36.2 | 154 | 164 | 184 | 206 | 226 | 255 | 273 |
| 55-59 | 670 | 206.8 | 37.9 | 145 | 160 | 180 | 206 | 232 | 255 | 271 |
| 60-64 | 648 | 202.7 | 36.5 | 144 | 155 | 177 | 201 | 226 | 248 | 263 |
| 65-69 | 578 | 199.7 | 36.9 | 143 | 154 | 172 | 198 | 223 | 247 | 263 |
| 70-74 | 638 | 197.9 | 37.1 | 138 | 150 | 173 | 197 | 221 | 247 | 264 |
| 75-79 | 441 | 195.4 | 37.5 | 140 | 151 | 168 | 195 | 217 | 242 | 260 |
| 80+ | 198 | 197.2 | 35.7 | 144 | 156 | 170 | 196 | 216 | 243 | 269 |
Supplementary Table 3. Distribution of triglycerides (mg/dL) by age, sex, menopausal status.
| Age | Number | Mean | Standard deviation | Percentiles | ||||||
|---|---|---|---|---|---|---|---|---|---|---|
| 5th | 10th | 25th | 50th | 75th | 90th | 95th | ||||
| Male (n=8284) | ||||||||||
| 10-14 | 788 | 77.9 | 44.3 | 30 | 36 | 47 | 66 | 96 | 138 | 169 |
| 15-19 | 566 | 83.6 | 44.3 | 37 | 42 | 55 | 74 | 98 | 143 | 175 |
| 20-24 | 327 | 94.9 | 53.7 | 39 | 45 | 60 | 84 | 109 | 167 | 207 |
| 25-29 | 431 | 130.3 | 104.3 | 47 | 54 | 74 | 104 | 150 | 218 | 296 |
| 30-34 | 548 | 143.7 | 100.6 | 49 | 57 | 81 | 114 | 182 | 252 | 306 |
| 35-39 | 765 | 151.6 | 90.8 | 54 | 65 | 90 | 130 | 189 | 268 | 316 |
| 40-44 | 729 | 161.7 | 98.4 | 58 | 69 | 92 | 137 | 205 | 287 | 332 |
| 45-49 | 617 | 164.5 | 115.0 | 51 | 68 | 94 | 136 | 200 | 302 | 345 |
| 50-54 | 659 | 164.7 | 100.7 | 58 | 67 | 96 | 138 | 202 | 302 | 355 |
| 55-59 | 631 | 159.2 | 103.9 | 53 | 66 | 96 | 136 | 200 | 272 | 326 |
| 60-64 | 643 | 143.3 | 84.2 | 49 | 59 | 83 | 125 | 180 | 254 | 316 |
| 65-69 | 554 | 133.1 | 75.3 | 45 | 58 | 82 | 118 | 163 | 229 | 276 |
| 70-74 | 559 | 128.8 | 71.8 | 49 | 56 | 77 | 111 | 161 | 225 | 275 |
| 75-79 | 339 | 119.7 | 69.4 | 48 | 55 | 73 | 104 | 144 | 215 | 258 |
| 80+ | 128 | 105.7 | 48.6 | 51 | 55 | 67 | 99 | 132 | 166 | 209 |
| Premenopausal female (n=5841) | ||||||||||
| 10-14 | 675 | 89.5 | 48.5 | 38 | 44 | 58 | 78 | 107 | 149 | 191 |
| 15-19 | 524 | 77.4 | 40.4 | 34 | 41 | 51 | 68 | 91 | 126 | 156 |
| 20-24 | 470 | 75.7 | 43.5 | 34 | 40 | 51 | 66 | 88 | 118 | 146 |
| 25-29 | 593 | 85.5 | 57.9 | 34 | 39 | 53 | 69 | 100 | 145 | 195 |
| 30-34 | 790 | 88.5 | 54.3 | 34 | 39 | 53 | 72 | 108 | 152 | 194 |
| 35-39 | 1039 | 91.7 | 57.8 | 36 | 42 | 56 | 75 | 110 | 153 | 194 |
| 40-44 | 843 | 94.8 | 55.0 | 41 | 47 | 59 | 80 | 116 | 159 | 197 |
| 45-49 | 633 | 110.1 | 69.0 | 43 | 49 | 66 | 92 | 129 | 192 | 246 |
| 50-54 | 274 | 108.8 | 58.2 | 46 | 51 | 68 | 93 | 135 | 191 | 221 |
| Postmenopausal female (n=3405) | ||||||||||
| 45-49 | 113 | 113.4 | 75.0 | 38 | 46 | 62 | 89 | 144 | 198 | 310 |
| 50-54 | 578 | 128.3 | 77.2 | 47 | 56 | 74 | 108 | 156 | 234 | 287 |
| 55-59 | 590 | 128.6 | 77.0 | 46 | 58 | 77 | 110 | 164 | 215 | 268 |
| 60-64 | 540 | 135.6 | 74.9 | 55 | 62 | 81 | 116 | 167 | 241 | 274 |
| 65-69 | 466 | 142.8 | 75.6 | 55 | 65 | 86 | 126 | 180 | 258 | 293 |
| 70-74 | 542 | 138.6 | 79.6 | 53 | 63 | 88 | 123 | 175 | 230 | 263 |
| 75-79 | 387 | 134.0 | 67.6 | 57 | 66 | 87 | 119 | 167 | 220 | 250 |
| 80+ | 189 | 141.0 | 67.4 | 63 | 72 | 94 | 124 | 170 | 249 | 290 |
Supplementary Table 4. Distribution of triglycerides (mg/dL) by age, sex, menopausal status not excluding people taking lipid-lowering agents.
| Age | Number | Mean | Standard deviation | Percentiles | ||||||
|---|---|---|---|---|---|---|---|---|---|---|
| 5th | 10th | 25th | 50th | 75th | 90th | 95th | ||||
| Male (n=8656) | ||||||||||
| 10-14 | 788 | 77.9 | 44.3 | 30 | 36 | 47 | 66 | 96 | 138 | 169 |
| 15-19 | 566 | 83.6 | 44.3 | 37 | 42 | 55 | 74 | 98 | 143 | 175 |
| 20-24 | 327 | 94.9 | 53.7 | 39 | 45 | 60 | 84 | 109 | 167 | 207 |
| 25-29 | 432 | 130.8 | 104.8 | 47 | 54 | 74 | 104 | 150 | 221 | 297 |
| 30-34 | 550 | 144.2 | 100.7 | 49 | 57 | 81 | 115 | 182 | 253 | 306 |
| 35-39 | 773 | 151.8 | 90.7 | 54 | 65 | 90 | 130 | 190 | 268 | 316 |
| 40-44 | 742 | 162.6 | 99.0 | 58 | 69 | 93 | 137 | 206 | 288 | 335 |
| 45-49 | 640 | 165.4 | 114.6 | 52 | 68 | 94.5 | 139 | 201 | 303 | 348 |
| 50-54 | 704 | 166.6 | 102.2 | 58 | 68 | 96.5 | 139 | 205 | 302 | 355 |
| 55-59 | 691 | 159.3 | 103.7 | 53 | 66 | 95 | 136 | 200 | 274 | 326 |
| 60-64 | 714 | 145.8 | 84.6 | 50 | 59 | 86 | 128 | 186 | 253 | 316 |
| 65-69 | 621 | 135.4 | 76.2 | 47 | 61 | 83 | 118 | 166 | 240 | 279 |
| 70-74 | 611 | 129.7 | 71.7 | 49 | 57 | 77 | 111 | 162 | 226 | 274 |
| 75-79 | 360 | 120.2 | 70.2 | 47.5 | 55 | 73 | 104 | 144 | 215 | 258 |
| 80+ | 137 | 106.2 | 49.4 | 51 | 55 | 66 | 98 | 132 | 166 | 210 |
| Premenopausal female (n=5869) | ||||||||||
| 10-14 | 675 | 89.5 | 48.5 | 38 | 44 | 58 | 78 | 107 | 149 | 191 |
| 15-19 | 524 | 77.4 | 40.4 | 34 | 41 | 51 | 68 | 91 | 126 | 156 |
| 20-24 | 470 | 75.7 | 43.5 | 34 | 39.5 | 51 | 66 | 88 | 118 | 146 |
| 25-29 | 593 | 85.5 | 57.9 | 34 | 39 | 53 | 69 | 100 | 145 | 195 |
| 30-34 | 790 | 88.5 | 54.3 | 34 | 39 | 53 | 72 | 108 | 152 | 194 |
| 35-39 | 1043 | 91.8 | 57.8 | 36 | 42 | 56 | 75 | 110 | 153 | 194 |
| 40-44 | 850 | 95.5 | 55.7 | 41 | 47 | 60 | 80 | 116 | 160 | 198 |
| 45-49 | 645 | 110.6 | 68.9 | 43 | 49 | 67 | 93 | 129 | 193 | 246 |
| 50-54 | 279 | 109.2 | 57.9 | 46 | 51 | 68 | 94 | 135 | 191 | 221 |
| Postmenopausal female (n=3909) | ||||||||||
| 45-49 | 119 | 117.2 | 76.1 | 38 | 46 | 64 | 93 | 159 | 229 | 310 |
| 50-54 | 617 | 128.9 | 76.7 | 47 | 56 | 74 | 109 | 157 | 234 | 287 |
| 55-59 | 670 | 130.2 | 76.8 | 46 | 57.5 | 78 | 112 | 167 | 221 | 270 |
| 60-64 | 648 | 135.9 | 74.2 | 55 | 63 | 82 | 117 | 167 | 241 | 273 |
| 65-69 | 578 | 143.3 | 73.8 | 56 | 66 | 89 | 126 | 180 | 252 | 293 |
| 70-74 | 638 | 137.7 | 77.4 | 51 | 63 | 86 | 123 | 175 | 230 | 263 |
| 75-79 | 441 | 132.8 | 67.1 | 56 | 66 | 87 | 118 | 164 | 218 | 250 |
| 80+ | 198 | 141.9 | 66.7 | 63 | 74 | 95 | 125 | 173 | 248 | 290 |
Supplementary Table 5. Distribution of high density lipoprotein-cholesterol (mg/dL) by age, sex, menopausal status.
| Age | Number | Mean | Standard deviation | Percentiles | ||||||
|---|---|---|---|---|---|---|---|---|---|---|
| 5th | 10th | 25th | 50th | 75th | 90th | 95th | ||||
| Male (n=8284) | ||||||||||
| 10-14 | 788 | 54.4 | 10.9 | 37 | 41 | 47 | 53 | 62 | 69 | 74 |
| 15-19 | 566 | 50.3 | 9.7 | 36 | 39 | 44 | 49 | 56 | 63 | 68 |
| 20-24 | 327 | 53.2 | 11.6 | 38 | 40 | 45 | 52 | 59 | 69 | 74 |
| 25-29 | 431 | 50.5 | 11.5 | 35 | 38 | 42 | 49 | 57 | 65 | 71 |
| 30-34 | 548 | 49.4 | 11.1 | 34 | 37 | 41 | 48 | 56 | 65 | 71 |
| 35-39 | 765 | 49.8 | 11.5 | 34 | 37 | 42 | 48 | 56 | 65 | 70 |
| 40-44 | 729 | 48.7 | 10.8 | 34 | 36 | 40 | 48 | 55 | 63 | 69 |
| 45-49 | 617 | 48.5 | 11.5 | 33 | 36 | 41 | 47 | 55 | 62 | 69 |
| 50-54 | 659 | 49.4 | 12.2 | 34 | 36 | 41 | 47 | 56 | 65 | 73 |
| 55-59 | 631 | 48.9 | 12.2 | 33 | 35 | 40 | 47 | 55 | 65 | 73 |
| 60-64 | 643 | 50.0 | 13.1 | 34 | 36 | 40 | 48 | 57 | 67 | 76 |
| 65-69 | 554 | 48.9 | 12.9 | 32 | 35 | 40 | 46.5 | 56 | 66 | 74 |
| 70-74 | 559 | 48.9 | 12.7 | 32 | 34 | 40 | 47 | 56 | 65 | 72 |
| 75-79 | 339 | 48.6 | 12.5 | 31 | 34 | 40 | 47 | 55 | 65 | 72 |
| 80+ | 128 | 47.6 | 12.9 | 30 | 32 | 38 | 44 | 57 | 69 | 72 |
| Premenopausal female (n=5841) | ||||||||||
| 10-14 | 675 | 54.7 | 10.5 | 39 | 42 | 47 | 54 | 61 | 68 | 73 |
| 15-19 | 524 | 57.0 | 10.9 | 40 | 44 | 49.5 | 56 | 64 | 70 | 75 |
| 20-24 | 470 | 59.9 | 12.9 | 42 | 46 | 51 | 58 | 67 | 77 | 83 |
| 25-29 | 593 | 60.0 | 13.0 | 40 | 43 | 51 | 59 | 68 | 77 | 82 |
| 30-34 | 790 | 58.6 | 13.1 | 39 | 42 | 49 | 58 | 67 | 76 | 81 |
| 35-39 | 1039 | 57.4 | 12.2 | 39 | 43 | 49 | 57 | 65 | 73 | 79 |
| 40-44 | 843 | 55.9 | 12.7 | 39 | 42 | 47 | 55 | 63 | 71 | 77 |
| 45-49 | 633 | 56.6 | 11.8 | 39 | 43 | 48 | 56 | 64 | 72 | 78 |
| 50-54 | 274 | 55.9 | 12.9 | 37 | 40 | 47 | 54 | 63 | 71 | 80 |
| Postmenopausal female (n=3405) | ||||||||||
| 45-49 | 113 | 55.2 | 12.7 | 34 | 38 | 46 | 56 | 63 | 70 | 76 |
| 50-54 | 578 | 56.0 | 13.2 | 38 | 40 | 47 | 55 | 63 | 73 | 79 |
| 55-59 | 590 | 53.4 | 11.9 | 37 | 39 | 44 | 52 | 61 | 69 | 73 |
| 60-64 | 540 | 52.1 | 12.3 | 35 | 37 | 43 | 51 | 59 | 69 | 75 |
| 65-69 | 466 | 51.6 | 11.4 | 35 | 38 | 44 | 50 | 59 | 67 | 71 |
| 70-74 | 542 | 50.7 | 12.1 | 34 | 37 | 42 | 49 | 57 | 66 | 73 |
| 75-79 | 387 | 50.0 | 11.3 | 33 | 36 | 42 | 49 | 57 | 64 | 69 |
| 80+ | 189 | 47.9 | 10.4 | 34 | 36 | 40 | 47 | 54 | 61 | 68 |
Supplementary Table 6. Distribution of high density lipoprotein-cholesterol (mg/dL) by age, sex, menopausal status not excluding people taking lipid-lowering agents.
| Age | Number | Mean | Standard deviation | Percentiles | ||||||
|---|---|---|---|---|---|---|---|---|---|---|
| 5th | 10th | 25th | 50th | 75th> | 90th | 95th | ||||
| Male (n=8656) | ||||||||||
| 10-14 | 788 | 54.4 | 10.9 | 37 | 41 | 47 | 53 | 62 | 69 | 74 |
| 15-19 | 566 | 50.3 | 9.7 | 36 | 39 | 44 | 49 | 56 | 63 | 68 |
| 20-24 | 327 | 53.2 | 11.6 | 38 | 40 | 45 | 52 | 59 | 69 | 74 |
| 25-29 | 432 | 50.4 | 11.5 | 35 | 38 | 42 | 49 | 57 | 65 | 71 |
| 30-34 | 550 | 49.4 | 11.1 | 34 | 37 | 41 | 48 | 56 | 65 | 71 |
| 35-39 | 773 | 49.7 | 11.4 | 34 | 37 | 42 | 48 | 56 | 65 | 70 |
| 40-44 | 742 | 48.8 | 10.9 | 34 | 36 | 41 | 48 | 55 | 63 | 69 |
| 45-49 | 640 | 48.4 | 11.4 | 33 | 36 | 41 | 47 | 55 | 62 | 69 |
| 50-54 | 704 | 49.3 | 12.1 | 34 | 36 | 41 | 47 | 56 | 65 | 71 |
| 55-59 | 691 | 49.0 | 12.2 | 33 | 36 | 41 | 47 | 55 | 65 | 73 |
| 60-64 | 714 | 49.8 | 12.9 | 34 | 35 | 41 | 48 | 56 | 67 | 75 |
| 65-69 | 621 | 48.8 | 12.7 | 32 | 35 | 40 | 47 | 56 | 66 | 72 |
| 70-74 | 611 | 49.0 | 12.7 | 32 | 34 | 40 | 46 | 56 | 66 | 72 |
| 75-79 | 360 | 48.5 | 12.5 | 31 | 34 | 40 | 47 | 55 | 65 | 72 |
| 80+ | 137 | 48.2 | 13.0 | 30 | 33 | 38 | 46 | 57 | 69 | 72 |
| Premenopausal female (n=5869) | ||||||||||
| 10-14 | 675 | 54.7 | 10.5 | 39 | 42 | 47 | 54 | 61 | 68 | 73 |
| 15-19 | 524 | 57.0 | 10.9 | 40 | 44 | 50 | 56 | 64 | 70 | 75 |
| 20-24 | 470 | 59.9 | 12.9 | 42 | 46 | 51 | 58 | 67 | 77 | 83 |
| 25-29 | 593 | 60.0 | 13.0 | 40 | 43 | 51 | 59 | 68 | 77 | 82 |
| 30-34 | 790 | 58.6 | 13.1 | 39 | 42 | 49 | 58 | 67 | 76 | 81 |
| 35-39 | 1043 | 57.4 | 12.2 | 39 | 43 | 49 | 57 | 65 | 73 | 79 |
| 40-44 | 850 | 55.8 | 12.7 | 38 | 41 | 46 | 55 | 63 | 71 | 77 |
| 45-49 | 645 | 56.5 | 11.8 | 39 | 43 | 48 | 56 | 64 | 72 | 77 |
| 50-54 | 279 | 56.0 | 12.9 | 37 | 40 | 47 | 54 | 63 | 72 | 80 |
| Postmenopausal female (n=3909) | ||||||||||
| 45-49 | 119 | 54.5 | 12.8 | 34 | 38 | 45 | 56 | 63 | 70 | 76 |
| 50-54 | 617 | 56.1 | 13.2 | 38 | 41 | 47 | 55 | 63 | 73 | 79 |
| 55-59 | 670 | 53.3 | 12.0 | 36 | 39 | 44 | 52 | 61 | 69 | 73 |
| 60-64 | 648 | 52.4 | 12.4 | 35 | 37 | 43 | 51 | 60 | 69 | 75 |
| 65-69 | 578 | 51.6 | 11.3 | 35 | 38 | 43 | 50 | 59 | 67 | 71 |
| 70-74 | 638 | 51.1 | 12.5 | 33 | 37 | 43 | 49 | 58 | 67 | 73 |
| 75-79 | 441 | 50.1 | 11.5 | 33 | 36 | 42 | 50 | 57 | 64 | 70 |
| 80+ | 198 | 48.0 | 10.2 | 34 | 36 | 40 | 47 | 54 | 61 | 68 |
Supplementary Table 7. Distribution of low density lipoprotein-cholesterol (mg/dL) by age, sex, menopausal status.
| Age | Number | Mean | Standard deviation | Percentiles | ||||||
|---|---|---|---|---|---|---|---|---|---|---|
| 5th | 10th | 25th | 50th | 75th | 90th | 95th | ||||
| Male (n=8284) | ||||||||||
| 10-14 | 788 | 86.9 | 22.4 | 53 | 61 | 72 | 85 | 100 | 116 | 126 |
| 15-19 | 566 | 84.1 | 24.0 | 50 | 57 | 69 | 82 | 98 | 113 | 124 |
| 20-24 | 327 | 95.7 | 26.2 | 60 | 65 | 76 | 91 | 111 | 131 | 145 |
| 25-29 | 431 | 103.6 | 28.0 | 60 | 67 | 86 | 103 | 120 | 140 | 153 |
| 30-34 | 548 | 111.2 | 31.4 | 67 | 74 | 91 | 110 | 128 | 147 | 163 |
| 35-39 | 765 | 114.3 | 30.2 | 68 | 78 | 94 | 113 | 133 | 154 | 168 |
| 40-44 | 729 | 113.4 | 32.0 | 64 | 75 | 92 | 114 | 132 | 154 | 166 |
| 45-49 | 617 | 116.4 | 34.3 | 63 | 75 | 94 | 116 | 137 | 156 | 174 |
| 50-54 | 659 | 114.1 | 31.6 | 65 | 77 | 91 | 114 | 133 | 155 | 168 |
| 55-59 | 631 | 111.9 | 33.8 | 60 | 71 | 91 | 109 | 132 | 155 | 170 |
| 60-64 | 643 | 108.9 | 32.4 | 55 | 68 | 88 | 107 | 130 | 153 | 164 |
| 65-69 | 554 | 108.7 | 30.6 | 56 | 71 | 89 | 109 | 127 | 147 | 159 |
| 70-74 | 559 | 109.0 | 31.1 | 59 | 71 | 87 | 108 | 129 | 146 | 162 |
| 75-79 | 339 | 107.3 | 31.1 | 57 | 67 | 88 | 107 | 127 | 147 | 160 |
| 80+ | 128 | 104.7 | 29.2 | 60 | 66 | 83 | 104 | 124 | 142 | 159 |
| Premenopausal female (n=5841) | ||||||||||
| 10-14 | 675 | 91.2 | 21.9 | 58 | 64 | 77 | 89 | 105 | 121 | 130 |
| 15-19 | 524 | 89.9 | 22.4 | 58 | 63 | 74 | 88 | 102 | 119 | 130 |
| 20-24 | 470 | 92.1 | 24.2 | 57 | 64 | 76 | 89 | 106 | 123 | 134 |
| 25-29 | 593 | 97.1 | 25.9 | 61 | 69 | 81 | 93 | 110 | 131 | 144 |
| 30-34 | 790 | 100.7 | 27.2 | 63 | 68 | 81 | 97 | 117 | 135 | 149 |
| 35-39 | 1039 | 104.6 | 28.2 | 65 | 73 | 85 | 102 | 121 | 141 | 154 |
| 40-44 | 843 | 108.3 | 26.6 | 68 | 75 | 89 | 107 | 124 | 144 | 157 |
| 45-49 | 633 | 115.8 | 29.7 | 72 | 80 | 95 | 115 | 132 | 151 | 165 |
| 50-54 | 274 | 123.1 | 28.3 | 78 | 89 | 103 | 123 | 140 | 160 | 175 |
| Postmenopausal female (n=3405) | ||||||||||
| 45-49 | 113 | 116.7 | 29.8 | 68 | 86 | 97 | 115 | 134 | 151 | 176 |
| 50-54 | 578 | 127.4 | 31.6 | 78 | 90 | 106 | 126 | 144 | 168 | 183 |
| 55-59 | 590 | 131.0 | 33.0 | 78 | 89 | 109 | 130 | 154 | 173 | 188 |
| 60-64 | 540 | 127.6 | 31.9 | 75 | 86 | 105 | 127 | 148 | 168 | 181 |
| 65-69 | 466 | 125.5 | 32.4 | 76 | 83 | 104 | 125 | 145 | 168 | 180 |
| 70-74 | 542 | 123.1 | 32.4 | 70 | 82 | 101 | 123 | 146 | 165 | 177 |
| 75-79 | 387 | 121.7 | 33.2 | 72 | 81 | 98 | 119 | 143 | 164 | 178 |
| 80+ | 189 | 121.4 | 32.7 | 71 | 81 | 98 | 120 | 138 | 166 | 185 |
Supplementary Table 8. Distribution of low density lipoprotein-cholesterol (mg/dL) by age, sex, menopausal status not excluding people taking lipid-lowering agents.
| Age | Number | Mean | Standard deviation | Percentiles | ||||||
|---|---|---|---|---|---|---|---|---|---|---|
| 5th | 10th | 25th | 50th | 75th | 90th | 95th | ||||
| Male (n=8656) | ||||||||||
| 10-14 | 788 | 86.9 | 22.4 | 53 | 61 | 72 | 85 | 100 | 116 | 126 |
| 15-19 | 566 | 84.1 | 24.0 | 50 | 57 | 69 | 82 | 98 | 113 | 124 |
| 20-24 | 327 | 95.7 | 26.2 | 60 | 65 | 76 | 91 | 111 | 131 | 145 |
| 25-29 | 432 | 103.7 | 28.0 | 60 | 67 | 86 | 103 | 120 | 140 | 153 |
| 30-34 | 550 | 111.2 | 31.3 | 67 | 74 | 91 | 110 | 128 | 147 | 163 |
| 35-39 | 773 | 114.1 | 30.3 | 68 | 78 | 94 | 113 | 133 | 154 | 168 |
| 40-44 | 742 | 112.8 | 32.1 | 64 | 73 | 90 | 113 | 132 | 153 | 166 |
| 45-49 | 640 | 115.8 | 35.0 | 61 | 74 | 92 | 115 | 136 | 156 | 175 |
| 50-54 | 704 | 113.3 | 32.9 | 65 | 75 | 90 | 112 | 133 | 155 | 168 |
| 55-59 | 691 | 109.7 | 34.2 | 58 | 69 | 88 | 108 | 130 | 154 | 169 |
| 60-64 | 714 | 106.9 | 32.9 | 52 | 63 | 84 | 105 | 129 | 151 | 162 |
| 65-69 | 621 | 105.8 | 31.2 | 54 | 67 | 85 | 106 | 125 | 146 | 157 |
| 70-74 | 611 | 107.3 | 31.8 | 57 | 69 | 85 | 107 | 127 | 146 | 162 |
| 75-79 | 360 | 106.2 | 31.3 | 57 | 66 | 83 | 105 | 126 | 147 | 157 |
| 80+ | 137 | 103.8 | 29.4 | 59 | 65 | 80 | 103 | 123 | 142 | 159 |
| Premenopausal female (n=5869) | ||||||||||
| 10-14 | 675 | 91.2 | 21.9 | 58 | 64 | 77 | 89 | 105 | 121 | 130 |
| 15-19 | 524 | 89.9 | 22.4 | 58 | 63 | 74 | 88 | 102 | 119 | 130 |
| 20-24 | 470 | 92.1 | 24.2 | 57 | 64 | 76 | 89 | 106 | 123 | 134 |
| 25-29 | 593 | 97.1 | 25.9 | 61 | 69 | 81 | 93 | 110 | 131 | 144 |
| 30-34 | 790 | 100.7 | 27.2 | 63 | 68 | 81 | 97 | 117 | 135 | 149 |
| 35-39 | 1043 | 104.6 | 28.2 | 65 | 73 | 85 | 102 | 121 | 140 | 153 |
| 40-44 | 850 | 108.1 | 26.7 | 68 | 75 | 89 | 107 | 124 | 144 | 157 |
| 45-49 | 645 | 115.2 | 30.0 | 71 | 79 | 95 | 114 | 132 | 150 | 164 |
| 50-54 | 279 | 122.9 | 28.6 | 78 | 89 | 102 | 122 | 140 | 161 | 175 |
| Postmenopausal female (n=3909) | ||||||||||
| 45-49 | 119 | 115.6 | 30.7 | 61 | 79 | 95 | 114 | 134 | 155 | 176 |
| 50-54 | 617 | 125.9 | 32.2 | 75 | 86 | 105 | 124 | 144 | 167 | 183 |
| 55-59 | 670 | 127.5 | 34.7 | 74 | 82 | 104 | 127 | 152 | 172 | 187 |
| 60-64 | 648 | 123.1 | 33.0 | 72 | 81 | 99 | 122 | 146 | 165 | 176 |
| 65-69 | 578 | 119.4 | 33.9 | 67 | 76 | 94 | 118 | 142 | 163 | 177 |
| 70-74 | 638 | 119.3 | 33.2 | 67 | 76 | 97 | 118 | 142 | 163 | 177 |
| 75-79 | 441 | 118.8 | 33.5 | 70 | 78 | 94 | 117 | 140 | 160 | 176 |
| 80+ | 198 | 120.8 | 32.9 | 71 | 76 | 98 | 120 | 137 | 166 | 188 |
Supplementary Table 9. Distribution of total cholesterol/high density lipoprotein-cholesterol ratio by age, sex, menopausal status.
| Age | Number | Mean | Standard deviation | Percentiles | ||||||
|---|---|---|---|---|---|---|---|---|---|---|
| 5th | 10th | 25th | 50th | 75th> | 90th | 95th | ||||
| Male (n=8284) | ||||||||||
| 10-14 | 788 | 2.97 | 0.65 | 2.10 | 2.23 | 2.50 | 2.85 | 3.33 | 3.89 | 4.19 |
| 15-19 | 566 | 3.09 | 0.72 | 2.17 | 2.28 | 2.62 | 2.98 | 3.43 | 3.97 | 4.44 |
| 20-24 | 327 | 3.28 | 0.87 | 2.14 | 2.32 | 2.68 | 3.12 | 3.74 | 4.36 | 4.98 |
| 25-29 | 431 | 3.71 | 1.01 | 2.30 | 2.52 | 2.98 | 3.57 | 4.31 | 5.08 | 5.63 |
| 30-34 | 548 | 3.99 | 1.10 | 2.41 | 2.67 | 3.20 | 3.84 | 4.65 | 5.50 | 5.88 |
| 35-39 | 765 | 4.08 | 1.10 | 2.48 | 2.72 | 3.26 | 4.02 | 4.76 | 5.52 | 6.06 |
| 40-44 | 729 | 4.16 | 1.13 | 2.56 | 2.79 | 3.35 | 4.05 | 4.87 | 5.65 | 6.10 |
| 45-49 | 617 | 4.24 | 1.12 | 2.61 | 2.91 | 3.45 | 4.14 | 4.92 | 5.74 | 6.13 |
| 50-54 | 659 | 4.16 | 1.09 | 2.59 | 2.87 | 3.36 | 4.05 | 4.79 | 5.62 | 6.13 |
| 55-59 | 631 | 4.12 | 1.13 | 2.44 | 2.75 | 3.30 | 4.00 | 4.78 | 5.56 | 6.08 |
| 60-64 | 643 | 3.94 | 1.06 | 2.43 | 2.65 | 3.12 | 3.84 | 4.66 | 5.33 | 5.72 |
| 65-69 | 554 | 3.96 | 1.06 | 2.40 | 2.60 | 3.18 | 3.89 | 4.72 | 5.37 | 5.74 |
| 70-74 | 559 | 3.96 | 1.13 | 2.45 | 2.65 | 3.08 | 3.84 | 4.64 | 5.43 | 5.96 |
| 75-79 | 339 | 3.90 | 1.09 | 2.40 | 2.61 | 3.05 | 3.74 | 4.58 | 5.30 | 5.97 |
| 80+ | 128 | 3.85 | 1.13 | 2.35 | 2.54 | 3.05 | 3.71 | 4.25 | 5.47 | 6.48 |
| Premenopausal female (n=5841) | ||||||||||
| 10-14 | 675 | 3.08 | 0.66 | 2.26 | 2.41 | 2.61 | 2.97 | 3.40 | 3.91 | 4.35 |
| 15-19 | 524 | 2.93 | 0.68 | 2.09 | 2.21 | 2.49 | 2.81 | 3.23 | 3.77 | 4.19 |
| 20-24 | 470 | 2.88 | 0.67 | 2.07 | 2.21 | 2.43 | 2.78 | 3.17 | 3.69 | 4.26 |
| 25-29 | 593 | 3.01 | 0.78 | 2.08 | 2.24 | 2.52 | 2.84 | 3.34 | 4.00 | 4.53 |
| 30-34 | 790 | 3.14 | 0.78 | 2.16 | 2.28 | 2.56 | 2.98 | 3.56 | 4.15 | 4.70 |
| 35-39 | 1039 | 3.25 | 0.82 | 2.27 | 2.41 | 2.66 | 3.08 | 3.66 | 4.35 | 4.84 |
| 40-44 | 843 | 3.40 | 0.80 | 2.32 | 2.47 | 2.81 | 3.27 | 3.88 | 4.50 | 4.85 |
| 45-49 | 633 | 3.56 | 0.88 | 2.40 | 2.57 | 2.91 | 3.41 | 4.07 | 4.71 | 5.23 |
| 50-54 | 274 | 3.72 | 0.85 | 2.51 | 2.71 | 3.09 | 3.62 | 4.26 | 4.93 | 5.31 |
| Postmenopausal female (n=3405) | ||||||||||
| 45-49 | 113 | 3.69 | 0.91 | 2.39 | 2.56 | 3.02 | 3.61 | 4.23 | 4.87 | 5.49 |
| 50-54 | 578 | 3.90 | 1.03 | 2.56 | 2.74 | 3.11 | 3.70 | 4.46 | 5.36 | 5.91 |
| 55-59 | 590 | 4.08 | 0.99 | 2.59 | 2.89 | 3.42 | 3.97 | 4.66 | 5.32 | 5.85 |
| 60-64 | 540 | 4.14 | 1.02 | 2.63 | 2.86 | 3.32 | 4.08 | 4.85 | 5.57 | 5.96 |
| 65-69 | 466 | 4.15 | 1.04 | 2.61 | 2.90 | 3.38 | 4.03 | 4.76 | 5.63 | 6.07 |
| 70-74 | 542 | 4.15 | 1.08 | 2.59 | 2.80 | 3.33 | 4.06 | 4.88 | 5.53 | 6.03 |
| 75-79 | 387 | 4.14 | 1.09 | 2.68 | 2.91 | 3.39 | 4.02 | 4.73 | 5.59 | 6.03 |
| 80+ | 189 | 4.27 | 1.03 | 2.84 | 3.03 | 3.50 | 4.16 | 4.90 | 5.60 | 6.03 |
Supplementary Table 10. Distribution of total cholesterol/high density lipoprotein-cholesterol ratio by age, sex, menopausal status not excluding people taking lipid-lowering agents.
| Age | Number | Mean | Standard deviation | Percentiles | ||||||
|---|---|---|---|---|---|---|---|---|---|---|
| 5th | 10th | 25th | 50th | 75th | 90th | 95th | ||||
| Male (n=8656) | ||||||||||
| 10-14 | 788 | 3.0 | 0.6 | 2.10 | 2.23 | 2.50 | 2.85 | 3.33 | 3.89 | 4.19 |
| 15-19 | 566 | 3.1 | 0.7 | 2.17 | 2.28 | 2.62 | 2.98 | 3.43 | 3.97 | 4.44 |
| 20-24 | 327 | 3.3 | 0.9 | 2.14 | 2.32 | 2.68 | 3.12 | 3.74 | 4.36 | 4.98 |
| 25-29 | 432 | 3.7 | 1.0 | 2.30 | 2.52 | 2.98 | 3.57 | 4.32 | 5.12 | 5.64 |
| 30-34 | 550 | 4.0 | 1.1 | 2.41 | 2.67 | 3.20 | 3.84 | 4.65 | 5.48 | 5.88 |
| 35-39 | 773 | 4.1 | 1.1 | 2.48 | 2.72 | 3.27 | 4.02 | 4.76 | 5.51 | 6.06 |
| 40-44 | 742 | 4.1 | 1.1 | 2.56 | 2.80 | 3.33 | 4.04 | 4.86 | 5.62 | 6.10 |
| 45-49 | 640 | 4.2 | 1.1 | 2.61 | 2.90 | 3.45 | 4.13 | 4.89 | 5.73 | 6.13 |
| 50-54 | 704 | 4.2 | 1.2 | 2.57 | 2.87 | 3.34 | 4.04 | 4.77 | 5.62 | 6.13 |
| 55-59 | 691 | 4.1 | 1.1 | 2.40 | 2.71 | 3.25 | 3.94 | 4.74 | 5.51 | 6.06 |
| 60-64 | 714 | 3.9 | 1.1 | 2.42 | 2.63 | 3.07 | 3.82 | 4.66 | 5.37 | 5.72 |
| 65-69 | 621 | 3.9 | 1.1 | 2.37 | 2.58 | 3.14 | 3.81 | 4.67 | 5.31 | 5.72 |
| 70-74 | 611 | 3.9 | 1.1 | 2.40 | 2.62 | 3.06 | 3.81 | 4.60 | 5.36 | 5.93 |
| 75-79 | 360 | 3.9 | 1.1 | 2.40 | 2.58 | 3.02 | 3.72 | 4.58 | 5.32 | 5.99 |
| 80+ | 137 | 3.8 | 1.1 | 2.32 | 2.52 | 3.03 | 3.62 | 4.23 | 5.32 | 6.48 |
| Premenopausal female (n=5869) | ||||||||||
| 10-14 | 675 | 3.1 | 0.7 | 2.26 | 2.41 | 2.61 | 2.97 | 3.40 | 3.91 | 4.35 |
| 15-19 | 524 | 2.9 | 0.7 | 2.09 | 2.21 | 2.49 | 2.81 | 3.23 | 3.77 | 4.19 |
| 20-24 | 470 | 2.9 | 0.7 | 2.07 | 2.21 | 2.43 | 2.78 | 3.17 | 3.69 | 4.26 |
| 25-29 | 593 | 3.0 | 0.8 | 2.08 | 2.24 | 2.52 | 2.84 | 3.34 | 4.00 | 4.53 |
| 30-34 | 790 | 3.1 | 0.8 | 2.16 | 2.28 | 2.56 | 2.98 | 3.56 | 4.15 | 4.70 |
| 35-39 | 1043 | 3.3 | 0.8 | 2.27 | 2.41 | 2.66 | 3.08 | 3.66 | 4.35 | 4.84 |
| 40-44 | 850 | 3.4 | 0.8 | 2.31 | 2.47 | 2.81 | 3.27 | 3.88 | 4.51 | 4.87 |
| 45-49 | 645 | 3.6 | 0.9 | 2.39 | 2.57 | 2.91 | 3.40 | 4.07 | 4.71 | 5.16 |
| 50-54 | 279 | 3.7 | 0.9 | 2.50 | 2.69 | 3.08 | 3.61 | 4.26 | 4.95 | 5.31 |
| Postmenopausal female (n=3909) | ||||||||||
| 45-49 | 119 | 3.7 | 1.0 | 2.39 | 2.56 | 3.02 | 3.61 | 4.23 | 5.04 | 5.56 |
| 50-54 | 617 | 3.9 | 1.0 | 2.51 | 2.70 | 3.08 | 3.66 | 4.44 | 5.36 | 5.90 |
| 55-59 | 670 | 4.0 | 1.0 | 2.57 | 2.82 | 3.33 | 3.91 | 4.60 | 5.29 | 5.83 |
| 60-64 | 648 | 4.0 | 1.0 | 2.55 | 2.79 | 3.24 | 3.95 | 4.72 | 5.44 | 5.85 |
| 65-69 | 578 | 4.0 | 1.0 | 2.52 | 2.79 | 3.25 | 3.89 | 4.66 | 5.54 | 5.90 |
| 70-74 | 638 | 4.1 | 1.1 | 2.49 | 2.74 | 3.22 | 3.97 | 4.78 | 5.50 | 5.98 |
| 75-79 | 441 | 4.1 | 1.1 | 2.64 | 2.86 | 3.30 | 3.91 | 4.63 | 5.46 | 5.91 |
| 80+ | 198 | 4.3 | 1.0 | 2.84 | 3.06 | 3.48 | 4.14 | 4.88 | 5.54 | 6.03 |
Supplementary Table 11. Distribution of low density lipoprotein-cholesterol/high density lipoprotein-cholesterol ratio by age, sex, menopausal status.
| Age | Number | Mean | Standard deviation | Percentiles | ||||||
|---|---|---|---|---|---|---|---|---|---|---|
| 5th | 10th | 25th | 50th | 75th | 90th | 95th | ||||
| Male (n=8284) | ||||||||||
| 10-14 | 788 | 1.66 | 0.52 | 0.91 | 1.04 | 1.29 | 1.59 | 1.97 | 2.38 | 2.62 |
| 15-19 | 566 | 1.74 | 0.62 | 0.92 | 1.05 | 1.34 | 1.65 | 2.02 | 2.50 | 2.86 |
| 20-24 | 327 | 1.89 | 0.70 | 0.99 | 1.12 | 1.40 | 1.77 | 2.28 | 2.75 | 3.14 |
| 25-29 | 431 | 2.14 | 0.78 | 1.01 | 1.22 | 1.59 | 2.05 | 2.59 | 3.19 | 3.61 |
| 30-34 | 553 | 2.34 | 0.86 | 1.03 | 1.37 | 1.76 | 2.23 | 2.82 | 3.33 | 3.81 |
| 35-39 | 786 | 2.39 | 0.87 | 1.11 | 1.38 | 1.80 | 2.31 | 2.94 | 3.46 | 3.93 |
| 40-44 | 740 | 2.41 | 0.88 | 1.14 | 1.38 | 1.81 | 2.34 | 2.97 | 3.52 | 3.95 |
| 45-49 | 626 | 2.48 | 0.90 | 1.13 | 1.43 | 1.84 | 2.42 | 3.02 | 3.68 | 4.00 |
| 50-54 | 673 | 2.39 | 0.89 | 1.07 | 1.42 | 1.79 | 2.33 | 2.88 | 3.59 | 4.07 |
| 55-59 | 637 | 2.40 | 0.92 | 1.05 | 1.29 | 1.76 | 2.32 | 2.91 | 3.57 | 3.94 |
| 60-64 | 648 | 2.29 | 0.86 | 1.05 | 1.29 | 1.63 | 2.22 | 2.82 | 3.48 | 3.79 |
| 65-69 | 558 | 2.34 | 0.87 | 0.95 | 1.28 | 1.74 | 2.26 | 2.89 | 3.49 | 3.81 |
| 70-74 | 563 | 2.37 | 0.92 | 1.10 | 1.30 | 1.70 | 2.27 | 2.91 | 3.62 | 3.97 |
| 75-79 | 341 | 2.34 | 0.87 | 1.08 | 1.27 | 1.71 | 2.27 | 2.89 | 3.48 | 3.88 |
| 80+ | 129 | 2.33 | 0.93 | 1.16 | 1.22 | 1.68 | 2.26 | 2.73 | 3.58 | 4.18 |
| Premenopausal female (n=5841) | ||||||||||
| 10-14 | 675 | 1.72 | 0.52 | 1.01 | 1.15 | 1.37 | 1.64 | 2.00 | 2.39 | 2.68 |
| 15-19 | 524 | 1.64 | 0.54 | 0.92 | 1.02 | 1.28 | 1.54 | 1.92 | 2.34 | 2.63 |
| 20-24 | 470 | 1.61 | 0.56 | 0.88 | 1.00 | 1.22 | 1.54 | 1.88 | 2.29 | 2.79 |
| 25-29 | 593 | 1.70 | 0.63 | 0.92 | 1.05 | 1.29 | 1.60 | 2.02 | 2.44 | 2.81 |
| 30-34 | 790 | 1.80 | 0.63 | 0.97 | 1.10 | 1.35 | 1.72 | 2.17 | 2.59 | 3.04 |
| 35-39 | 1039 | 1.91 | 0.67 | 1.05 | 1.19 | 1.44 | 1.80 | 2.23 | 2.81 | 3.12 |
| 40-44 | 843 | 2.03 | 0.65 | 1.12 | 1.27 | 1.56 | 1.95 | 2.40 | 2.89 | 3.23 |
| 45-49 | 633 | 2.13 | 0.71 | 1.13 | 1.33 | 1.63 | 2.05 | 2.55 | 3.05 | 3.44 |
| 50-54 | 274 | 2.29 | 0.67 | 1.32 | 1.47 | 1.79 | 2.21 | 2.78 | 3.21 | 3.42 |
| Postmenopausal female (n=3405) | ||||||||||
| 45-49 | 113 | 2.22 | 0.70 | 1.14 | 1.31 | 1.74 | 2.23 | 2.64 | 3.16 | 3.43 |
| 50-54 | 578 | 2.39 | 0.80 | 1.32 | 1.47 | 1.80 | 2.29 | 2.85 | 3.44 | 3.76 |
| 55-59 | 590 | 2.55 | 0.79 | 1.36 | 1.60 | 2.02 | 2.49 | 3.01 | 3.55 | 3.97 |
| 60-64 | 540 | 2.57 | 0.81 | 1.31 | 1.54 | 1.94 | 2.55 | 3.10 | 3.68 | 3.99 |
| 65-69 | 466 | 2.53 | 0.81 | 1.36 | 1.53 | 1.99 | 2.45 | 3.00 | 3.64 | 4.02 |
| 70-74 | 542 | 2.55 | 0.86 | 1.29 | 1.50 | 1.90 | 2.47 | 3.09 | 3.67 | 4.14 |
| 75-79 | 387 | 2.54 | 0.85 | 1.32 | 1.61 | 1.95 | 2.48 | 2.98 | 3.73 | 4.01 |
| 80+ | 189 | 2.63 | 0.84 | 1.40 | 1.68 | 2.04 | 2.50 | 3.21 | 3.68 | 4.14 |
Supplementary Table 12. Distribution of low density lipoprotein-cholesterol/high density lipoprotein-cholesterol ratio by age, sex, menopausal status not excluding people taking lipid-lowering agents.
| Age | Number | Mean | Standard deviation | Percentiles | ||||||
|---|---|---|---|---|---|---|---|---|---|---|
| 5th | 10th | 25th | 50th | 75th | 90th | 95th | ||||
| Male (n=8656) | ||||||||||
| 10-14 | 788 | 1.7 | 0.5 | 0.91 | 1.04 | 1.29 | 1.59 | 1.97 | 2.38 | 2.62 |
| 15-19 | 566 | 1.7 | 0.6 | 0.92 | 1.05 | 1.34 | 1.65 | 2.02 | 2.50 | 2.86 |
| 20-24 | 327 | 1.9 | 0.7 | 0.99 | 1.12 | 1.40 | 1.77 | 2.28 | 2.75 | 3.14 |
| 25-29 | 432 | 2.2 | 0.8 | 1.04 | 1.23 | 1.61 | 2.09 | 2.62 | 3.21 | 3.62 |
| 30-34 | 550 | 2.4 | 0.9 | 1.11 | 1.41 | 1.80 | 2.27 | 2.84 | 3.33 | 3.85 |
| 35-39 | 773 | 2.4 | 0.9 | 1.17 | 1.40 | 1.82 | 2.34 | 2.95 | 3.51 | 3.96 |
| 40-44 | 742 | 2.4 | 0.9 | 1.19 | 1.40 | 1.83 | 2.35 | 2.95 | 3.50 | 3.91 |
| 45-49 | 640 | 2.5 | 0.9 | 1.21 | 1.47 | 1.85 | 2.41 | 3.01 | 3.68 | 4.04 |
| 50-54 | 704 | 2.4 | 0.9 | 1.18 | 1.45 | 1.83 | 2.33 | 2.92 | 3.59 | 4.07 |
| 55-59 | 691 | 2.4 | 0.9 | 1.08 | 1.29 | 1.73 | 2.28 | 2.87 | 3.52 | 3.92 |
| 60-64 | 714 | 2.3 | 0.9 | 0.98 | 1.29 | 1.60 | 2.19 | 2.81 | 3.44 | 3.79 |
| 65-69 | 621 | 2.3 | 0.9 | 0.97 | 1.26 | 1.70 | 2.22 | 2.86 | 3.44 | 3.78 |
| 70-74 | 611 | 2.3 | 0.9 | 1.08 | 1.28 | 1.65 | 2.22 | 2.89 | 3.58 | 3.93 |
| 75-79 | 360 | 2.3 | 0.9 | 1.08 | 1.25 | 1.67 | 2.23 | 2.88 | 3.50 | 3.93 |
| 80+ | 137 | 2.3 | 0.9 | 1.14 | 1.22 | 1.65 | 2.19 | 2.73 | 3.55 | 4.18 |
| Premenopausal female (n=5869) | ||||||||||
| 10-14 | 675 | 1.7 | 0.5 | 1.01 | 1.15 | 1.37 | 1.64 | 2.00 | 2.39 | 2.68 |
| 15-19 | 524 | 1.6 | 0.5 | 0.92 | 1.02 | 1.28 | 1.54 | 1.92 | 2.34 | 2.63 |
| 20-24 | 470 | 1.6 | 0.6 | 0.88 | 1.00 | 1.22 | 1.54 | 1.88 | 2.29 | 2.79 |
| 25-29 | 593 | 1.7 | 0.6 | 0.92 | 1.05 | 1.29 | 1.60 | 2.02 | 2.44 | 2.81 |
| 30-34 | 790 | 1.8 | 0.6 | 0.97 | 1.10 | 1.35 | 1.72 | 2.17 | 2.59 | 3.04 |
| 35-39 | 1043 | 1.9 | 0.7 | 1.05 | 1.19 | 1.44 | 1.80 | 2.23 | 2.80 | 3.12 |
| 40-44 | 850 | 2.0 | 0.7 | 1.12 | 1.26 | 1.56 | 1.95 | 2.40 | 2.89 | 3.25 |
| 45-49 | 645 | 2.1 | 0.7 | 1.11 | 1.33 | 1.63 | 2.03 | 2.54 | 3.05 | 3.43 |
| 50-54 | 279 | 2.3 | 0.7 | 1.28 | 1.41 | 1.79 | 2.21 | 2.78 | 3.23 | 3.43 |
| Postmenopausal female (n=3909) | ||||||||||
| 45-49 | 119 | 2.2 | 0.8 | 1.14 | 1.31 | 1.74 | 2.20 | 2.64 | 3.23 | 3.46 |
| 50-54 | 617 | 2.4 | 0.8 | 1.26 | 1.44 | 1.77 | 2.26 | 2.83 | 3.44 | 3.76 |
| 55-59 | 670 | 2.5 | 0.8 | 1.26 | 1.46 | 1.91 | 2.43 | 2.95 | 3.53 | 3.90 |
| 60-64 | 648 | 2.5 | 0.8 | 1.24 | 1.41 | 1.84 | 2.42 | 3.00 | 3.60 | 3.93 |
| 65-69 | 578 | 2.4 | 0.8 | 1.21 | 1.42 | 1.83 | 2.30 | 2.91 | 3.48 | 3.97 |
| 70-74 | 638 | 2.5 | 0.9 | 1.20 | 1.40 | 1.80 | 2.40 | 2.99 | 3.60 | 4.09 |
| 75-79 | 441 | 2.5 | 0.9 | 1.27 | 1.51 | 1.86 | 2.42 | 2.92 | 3.53 | 3.96 |
| 80+ | 198 | 2.6 | 0.8 | 1.40 | 1.66 | 2.02 | 2.47 | 3.20 | 3.67 | 4.14 |
Supplementary Table 13. Distribution of triglycerides/high density lipoprotein-cholesterol ratio by age, sex, menopausal status.
| Age | Number | Mean | Standard deviation | Percentiles | ||||||
|---|---|---|---|---|---|---|---|---|---|---|
| 5th | 10th | 25th | 50th | 75th | 90th | 95th | ||||
| Male (n=8284) | ||||||||||
| 10-14 | 788 | 1.55 | 1.12 | 0.50 | 0.60 | 0.85 | 1.20 | 1.85 | 3.14 | 3.84 |
| 15-19 | 566 | 1.76 | 1.11 | 0.68 | 0.79 | 1.05 | 1.46 | 2.12 | 3.09 | 3.84 |
| 20-24 | 327 | 1.96 | 1.42 | 0.63 | 0.76 | 1.03 | 1.58 | 2.30 | 3.64 | 4.88 |
| 25-29 | 431 | 2.88 | 2.90 | 0.73 | 0.94 | 1.36 | 2.06 | 3.42 | 5.35 | 7.07 |
| 30-34 | 553 | 3.33 | 2.95 | 0.86 | 1.05 | 1.51 | 2.35 | 4.25 | 6.33 | 8.66 |
| 35-39 | 786 | 3.65 | 3.13 | 0.90 | 1.19 | 1.71 | 2.75 | 4.41 | 7.17 | 9.22 |
| 40-44 | 740 | 3.81 | 2.99 | 1.02 | 1.26 | 1.79 | 2.95 | 4.88 | 7.56 | 9.57 |
| 45-49 | 626 | 3.90 | 3.36 | 0.86 | 1.22 | 1.88 | 2.98 | 4.71 | 7.71 | 9.72 |
| 50-54 | 673 | 3.95 | 3.33 | 0.96 | 1.22 | 1.84 | 3.06 | 4.79 | 7.66 | 10.45 |
| 55-59 | 637 | 3.71 | 3.07 | 0.91 | 1.16 | 1.88 | 2.89 | 4.63 | 6.53 | 8.70 |
| 60-64 | 648 | 3.27 | 2.41 | 0.78 | 1.02 | 1.53 | 2.54 | 4.27 | 6.51 | 8.20 |
| 65-69 | 558 | 3.21 | 3.03 | 0.76 | 1.02 | 1.57 | 2.59 | 3.86 | 5.86 | 7.39 |
| 70-74 | 563 | 2.99 | 2.10 | 0.81 | 1.00 | 1.45 | 2.45 | 3.81 | 5.91 | 7.33 |
| 75-79 | 341 | 2.88 | 2.48 | 0.78 | 0.93 | 1.43 | 2.27 | 3.30 | 5.28 | 7.65 |
| 80+ | 129 | 2.70 | 2.64 | 0.82 | 0.93 | 1.32 | 2.07 | 3.00 | 5.36 | 5.96 |
| Premenopausal female (n=5841) | ||||||||||
| 10-14 | 675 | 1.78 | 1.31 | 0.62 | 0.72 | 1.00 | 1.40 | 2.14 | 3.14 | 4.13 |
| 15-19 | 524 | 1.47 | 1.04 | 0.55 | 0.63 | 0.86 | 1.20 | 1.70 | 2.38 | 3.26 |
| 20-24 | 470 | 1.37 | 1.05 | 0.51 | 0.61 | 0.82 | 1.14 | 1.56 | 2.32 | 2.72 |
| 25-29 | 593 | 1.56 | 1.29 | 0.48 | 0.58 | 0.84 | 1.16 | 1.75 | 3.05 | 4.14 |
| 30-34 | 790 | 1.67 | 1.34 | 0.51 | 0.62 | 0.85 | 1.28 | 2.00 | 3.05 | 3.90 |
| 35-39 | 1039 | 1.75 | 1.42 | 0.55 | 0.67 | 0.92 | 1.35 | 2.07 | 3.15 | 4.16 |
| 40-44 | 843 | 1.86 | 1.36 | 0.62 | 0.75 | 0.98 | 1.48 | 2.27 | 3.36 | 4.24 |
| 45-49 | 633 | 2.12 | 1.58 | 0.64 | 0.77 | 1.10 | 1.67 | 2.60 | 4.13 | 5.39 |
| 50-54 | 274 | 2.15 | 1.48 | 0.69 | 0.83 | 1.10 | 1.78 | 2.62 | 3.85 | 5.48 |
| Postmenopausal female (n=3405) | ||||||||||
| 45-49 | 113 | 2.35 | 2.12 | 0.65 | 0.83 | 1.11 | 1.51 | 2.88 | 5.35 | 7.65 |
| 50-54 | 578 | 2.57 | 2.02 | 0.71 | 0.88 | 1.28 | 1.91 | 3.18 | 5.16 | 6.67 |
| 55-59 | 590 | 2.68 | 2.04 | 0.73 | 0.92 | 1.35 | 2.12 | 3.43 | 5.06 | 6.26 |
| 60-64 | 540 | 2.89 | 2.02 | 0.82 | 1.02 | 1.43 | 2.36 | 3.67 | 5.55 | 7.01 |
| 65-69 | 466 | 3.07 | 2.10 | 0.88 | 1.03 | 1.53 | 2.45 | 4.06 | 5.98 | 7.00 |
| 70-74 | 542 | 3.02 | 2.18 | 0.86 | 1.11 | 1.64 | 2.45 | 3.95 | 5.83 | 6.88 |
| 75-79 | 387 | 2.98 | 2.06 | 0.93 | 1.05 | 1.61 | 2.39 | 3.70 | 5.44 | 7.12 |
| 80+ | 189 | 3.20 | 1.97 | 1.02 | 1.30 | 1.83 | 2.63 | 4.03 | 5.70 | 7.26 |
Supplementary Table 14. Distribution of triglycerides/high density lipoprotein-cholesterol ratio by age, sex, menopausal status not excluding people taking lipid-lowering agents.
| Age | Number | Mean | Standard deviation | Percentiles | ||||||
|---|---|---|---|---|---|---|---|---|---|---|
| 5th | 10th | 25th | 50th | 75th | 90th | 95th | ||||
| Male (n=8656) | ||||||||||
| 10-14 | 788 | 1.6 | 1.1 | 0.50 | 0.60 | 0.85 | 1.20 | 1.85 | 3.14 | 3.84 |
| 15-19 | 566 | 1.8 | 1.1 | 0.68 | 0.79 | 1.05 | 1.46 | 2.12 | 3.09 | 3.84 |
| 20-24 | 327 | 2.0 | 1.4 | 0.63 | 0.76 | 1.03 | 1.58 | 2.30 | 3.64 | 4.88 |
| 25-29 | 432 | 2.9 | 2.9 | 0.73 | 0.94 | 1.37 | 2.06 | 3.42 | 5.38 | 7.22 |
| 30-34 | 550 | 3.2 | 2.8 | 0.86 | 1.05 | 1.49 | 2.33 | 4.21 | 6.26 | 8.43 |
| 35-39 | 773 | 3.4 | 2.5 | 0.90 | 1.18 | 1.68 | 2.71 | 4.20 | 6.36 | 7.92 |
| 40-44 | 742 | 3.7 | 2.8 | 1.02 | 1.27 | 1.79 | 2.91 | 4.81 | 7.09 | 8.68 |
| 45-49 | 640 | 3.8 | 3.1 | 0.87 | 1.23 | 1.89 | 2.97 | 4.63 | 7.42 | 9.04 |
| 50-54 | 704 | 3.8 | 2.8 | 0.96 | 1.22 | 1.85 | 3.05 | 4.71 | 7.24 | 9.00 |
| 55-59 | 691 | 3.6 | 2.8 | 0.92 | 1.17 | 1.85 | 2.85 | 4.56 | 6.44 | 8.21 |
| 60-64 | 714 | 3.3 | 2.4 | 0.80 | 1.03 | 1.59 | 2.57 | 4.27 | 6.45 | 8.15 |
| 65-69 | 621 | 3.1 | 2.2 | 0.79 | 1.04 | 1.58 | 2.58 | 3.96 | 5.80 | 7.17 |
| 70-74 | 611 | 3.0 | 2.0 | 0.81 | 1.02 | 1.47 | 2.43 | 3.78 | 5.65 | 7.11 |
| 75-79 | 360 | 2.8 | 2.3 | 0.76 | 0.91 | 1.42 | 2.23 | 3.30 | 5.30 | 7.46 |
| 80+ | 137 | 2.5 | 1.7 | 0.82 | 0.93 | 1.29 | 2.02 | 2.98 | 5.16 | 5.96 |
| Premenopausal female (n=5869) | ||||||||||
| 10-14 | 675 | 1.8 | 1.3 | 0.62 | 0.72 | 1.00 | 1.40 | 2.14 | 3.14 | 4.13 |
| 15-19 | 524 | 1.5 | 1.0 | 0.55 | 0.63 | 0.86 | 1.20 | 1.70 | 2.38 | 3.26 |
| 20-24 | 470 | 1.4 | 1.1 | 0.51 | 0.61 | 0.82 | 1.14 | 1.56 | 2.32 | 2.72 |
| 25-29 | 593 | 1.6 | 1.3 | 0.48 | 0.58 | 0.84 | 1.16 | 1.75 | 3.05 | 4.14 |
| 30-34 | 790 | 1.7 | 1.3 | 0.51 | 0.62 | 0.85 | 1.28 | 2.00 | 3.05 | 3.90 |
| 35-39 | 1043 | 1.8 | 1.4 | 0.56 | 0.67 | 0.92 | 1.35 | 2.08 | 3.15 | 4.16 |
| 40-44 | 850 | 1.9 | 1.4 | 0.62 | 0.76 | 0.99 | 1.49 | 2.28 | 3.46 | 4.36 |
| 45-49 | 645 | 2.1 | 1.6 | 0.65 | 0.77 | 1.11 | 1.68 | 2.61 | 4.15 | 5.39 |
| 50-54 | 279 | 2.2 | 1.5 | 0.69 | 0.83 | 1.10 | 1.78 | 2.67 | 3.90 | 5.48 |
| Postmenopausal female (n=3909) | ||||||||||
| 45-49 | 119 | 2.5 | 2.2 | 0.65 | 0.83 | 1.11 | 1.51 | 3.14 | 5.79 | 7.65 |
| 50-54 | 617 | 2.6 | 2.0 | 0.71 | 0.88 | 1.29 | 1.91 | 3.18 | 5.16 | 6.66 |
| 55-59 | 670 | 2.7 | 2.0 | 0.73 | 0.92 | 1.35 | 2.16 | 3.44 | 5.08 | 6.39 |
| 60-64 | 648 | 2.9 | 2.0 | 0.82 | 1.02 | 1.45 | 2.32 | 3.69 | 5.57 | 6.83 |
| 65-69 | 578 | 3.1 | 2.0 | 0.89 | 1.07 | 1.57 | 2.50 | 4.02 | 5.94 | 7.02 |
| 70-74 | 638 | 3.0 | 2.1 | 0.82 | 1.05 | 1.62 | 2.43 | 3.89 | 5.66 | 6.87 |
| 75-79 | 441 | 2.9 | 2.0 | 0.93 | 1.10 | 1.61 | 2.38 | 3.63 | 5.32 | 7.12 |
| 80+ | 198 | 3.2 | 1.9 | 1.02 | 1.31 | 1.87 | 2.70 | 4.03 | 5.70 | 7.26 |
Supplementary Table 15. Distribution of non-high density lipoprotein-cholesterol (mg/dL) by age, sex, menopausal status.
| Age | Number | Mean | Standard deviation | Percentiles | ||||||
|---|---|---|---|---|---|---|---|---|---|---|
| 5th | 10th | 25th | 50th | 75th | 90th | 95th | ||||
| Male (n=8284) | ||||||||||
| 10-14 | 788 | 102.5 | 24.8 | 65 | 74 | 85 | 100 | 118 | 134 | 144 |
| 15-19 | 566 | 100.9 | 26.5 | 65 | 70 | 83 | 98 | 115 | 133 | 145 |
| 20-24 | 327 | 114.7 | 29.8 | 74 | 81 | 92 | 109 | 133 | 153 | 170 |
| 25-29 | 431 | 128.6 | 32.6 | 82 | 89 | 105 | 126 | 149 | 171 | 186 |
| 30-34 | 553 | 139.4 | 35.7 | 84 | 95 | 116 | 139 | 163 | 182 | 195 |
| 35-39 | 786 | 144.9 | 35.0 | 91 | 103 | 120 | 144 | 167 | 191 | 210 |
| 40-44 | 740 | 146.1 | 37.0 | 90 | 102 | 122 | 144 | 169 | 191 | 203 |
| 45-49 | 626 | 149.2 | 38.3 | 95 | 103 | 124 | 146 | 172 | 195 | 214 |
| 50-54 | 673 | 147.1 | 34.2 | 96 | 106 | 124 | 146 | 168 | 191 | 205 |
| 55-59 | 637 | 143.8 | 37.0 | 88 | 97 | 118 | 142 | 166 | 188 | 206 |
| 60-64 | 648 | 137.5 | 33.8 | 83 | 94 | 113 | 136 | 160 | 181 | 196 |
| 65-69 | 558 | 135.4 | 33.5 | 82 | 92 | 114 | 134 | 157 | 178 | 189 |
| 70-74 | 563 | 135.2 | 35.2 | 82 | 95 | 110 | 133 | 156 | 179 | 195 |
| 75-79 | 341 | 131.4 | 33.6 | 80 | 91 | 109 | 130 | 152 | 176 | 192 |
| 80+ | 129 | 126.1 | 32.5 | 77 | 84 | 102 | 124 | 142 | 171 | 185 |
| Premenopausal female (n=5841) | ||||||||||
| 10-14 | 675 | 109.1 | 23.6 | 73 | 81 | 93 | 106 | 123 | 140 | 150 |
| 15-19 | 524 | 105.4 | 25.3 | 69 | 76 | 88 | 102 | 119 | 137 | 153 |
| 20-24 | 470 | 107.3 | 26.7 | 71 | 77 | 89 | 104 | 123 | 142 | 155 |
| 25-29 | 593 | 114.1 | 29.8 | 75 | 83 | 95 | 110 | 129 | 151 | 171 |
| 30-34 | 790 | 118.4 | 30.6 | 76 | 83 | 96 | 114 | 136 | 158 | 175 |
| 35-39 | 1039 | 122.9 | 31.6 | 80 | 87 | 100 | 119 | 140 | 163 | 180 |
| 40-44 | 843 | 127.2 | 29.6 | 83 | 92 | 107 | 125 | 144 | 167 | 180 |
| 45-49 | 633 | 137.6 | 32.9 | 89 | 96 | 115 | 136 | 156 | 179 | 195 |
| 50-54 | 274 | 144.8 | 31.4 | 97 | 104 | 121 | 144 | 166 | 184 | 200 |
| Postmenopausal female (n=3405) | ||||||||||
| 45-49 | 113 | 139.4 | 30.8 | 96 | 104 | 116 | 140 | 158 | 171 | 194 |
| 50-54 | 578 | 152.9 | 35.5 | 102 | 111 | 128 | 150 | 172 | 198 | 218 |
| 55-59 | 590 | 156.7 | 35.3 | 100 | 112 | 132 | 156 | 180 | 203 | 217 |
| 60-64 | 540 | 154.7 | 34.4 | 98 | 110 | 131 | 154 | 179 | 198 | 211 |
| 65-69 | 466 | 154.0 | 35.6 | 97 | 109 | 128 | 154 | 177 | 200 | 210 |
| 70-74 | 542 | 150.7 | 36.0 | 93 | 103 | 127 | 150 | 174 | 197 | 208 |
| 75-79 | 387 | 148.4 | 36.0 | 94 | 102 | 125 | 148 | 167 | 191 | 209 |
| 80+ | 189 | 149.6 | 34.6 | 100 | 109 | 125 | 147 | 167 | 195 | 215 |
Supplementary Table 16. Distribution of non-high density lipoprotein-cholesterol (mg/dL) by age, sex, menopausal status not excluding people taking lipid-lowering agents.
| Age | Number | Mean | Standard deviation | Percentiles | ||||||
|---|---|---|---|---|---|---|---|---|---|---|
| 5th | 10th | 25th | 50th | 75th | 90th | 95th | ||||
| Male (n=8656) | ||||||||||
| 10-14 | 788 | 102.5 | 24.8 | 65 | 74 | 85 | 100 | 118 | 134 | 144 |
| 15-19 | 566 | 100.9 | 26.5 | 65 | 70 | 83 | 98 | 115 | 133 | 145 |
| 20-24 | 327 | 114.7 | 29.8 | 74 | 81 | 92 | 109 | 133 | 153 | 170 |
| 25-29 | 432 | 128.8 | 32.9 | 82 | 89 | 105 | 126 | 150 | 172 | 187 |
| 30-34 | 550 | 139.0 | 35.3 | 84 | 95 | 116 | 139 | 163 | 182 | 194 |
| 35-39 | 773 | 144.0 | 34.6 | 90 | 102 | 119 | 143 | 166 | 189 | 207 |
| 40-44 | 742 | 144.8 | 36.3 | 90 | 102 | 122 | 143 | 167 | 190 | 202 |
| 45-49 | 640 | 147.9 | 38.5 | 93 | 102 | 124 | 145 | 171 | 192 | 212 |
| 50-54 | 704 | 145.9 | 35.5 | 94 | 103 | 122 | 144 | 167 | 191 | 205 |
| 55-59 | 691 | 141.0 | 37.2 | 85 | 94 | 115 | 140 | 164 | 185 | 204 |
| 60-64 | 714 | 135.8 | 34.3 | 81 | 89 | 110 | 134 | 159 | 181 | 193 |
| 65-69 | 621 | 132.6 | 32.9 | 80 | 88 | 112 | 131 | 154 | 175 | 188 |
| 70-74 | 611 | 133.2 | 34.5 | 79 | 93 | 108 | 131 | 155 | 178 | 194 |
| 75-79 | 360 | 130.1 | 33.9 | 78 | 90 | 107 | 128 | 151 | 176 | 192 |
| 80+ | 137 | 125.0 | 32.5 | 77 | 82 | 101 | 124 | 142 | 168 | 185 |
| Premenopausal female (n=5869) | ||||||||||
| 10-14 | 675 | 109.1 | 23.6 | 73 | 81 | 93 | 106 | 123 | 140 | 150 |
| 15-19 | 524 | 105.4 | 25.3 | 69 | 76 | 88 | 102 | 119 | 137 | 153 |
| 20-24 | 470 | 107.3 | 26.7 | 71 | 77 | 89 | 104 | 123 | 142 | 155 |
| 25-29 | 593 | 114.1 | 29.8 | 75 | 83 | 95 | 110 | 129 | 151 | 171 |
| 30-34 | 790 | 118.4 | 30.6 | 76 | 83 | 96 | 114 | 136 | 158 | 175 |
| 35-39 | 1043 | 122.9 | 31.6 | 80 | 87 | 100 | 119 | 140 | 162 | 179 |
| 40-44 | 850 | 127.1 | 29.8 | 82 | 92 | 106 | 125 | 143 | 168 | 181 |
| 45-49 | 645 | 137.1 | 32.9 | 89 | 95 | 114 | 135 | 156 | 179 | 193 |
| 50-54 | 279 | 144.7 | 31.5 | 97 | 103 | 120 | 144 | 166 | 186 | 200 |
| Postmenopausal female (n=3909) | ||||||||||
| 45-49 | 119 | 139.0 | 31.7 | 93 | 100 | 114 | 139 | 158 | 175 | 194 |
| 50-54 | 617 | 151.5 | 36.0 | 98 | 109 | 126 | 148 | 171 | 198 | 218 |
| 55-59 | 670 | 153.5 | 36.7 | 96 | 106 | 127 | 152 | 177 | 203 | 217 |
| 60-64 | 648 | 150.3 | 35.3 | 91 | 104 | 125 | 149 | 174 | 195 | 209 |
| 65-69 | 578 | 148.1 | 36.4 | 90 | 102 | 122 | 145 | 172 | 197 | 208 |
| 70-74 | 638 | 146.8 | 36.7 | 89 | 100 | 122 | 146 | 171 | 196 | 207 |
| 75-79 | 441 | 145.3 | 36.3 | 91 | 99 | 120 | 144 | 165 | 189 | 206 |
| 80+ | 198 | 149.2 | 34.6 | 98 | 109 | 124 | 147 | 167 | 195 | 217 |