

Abstract
The metabolic syndrome is a risk factor that increases the risk for development of renal and vascular complications. This study addresses the effects of chronic administration of the endogenous dipeptide carnosine (β-alanyl-L-histidine, L-CAR) and of its enantiomer (β-alanyl-D-histidine, D-CAR) on hyperlipidaemia, hypertension, advanced glycation end products, advanced lipoxidation end products formation and development of nephropathy in the non-diabetic, Zucker obese rat. The Zucker rats received a daily dose of L-CAR or D-CAR (30 mg/kg in drinking water) for 24 weeks. Systolic blood pressure was recorded monthly. At the end of the treatment, plasma levels of triglycerides, total cholesterol, glucose, insulin, creatinine and urinary levels of total protein, albumin and creatinine were measured. Several indices of oxidative/carbonyl stress were also measured in plasma, urine and renal tissue. We found that both L- and D-CAR greatly reduced obese-related diseases in obese Zucker rat, by significantly restraining the development of dyslipidaemia, hypertension and renal injury, as demonstrated by both urinary parameters and electron microscopy examinations of renal tissue. Because the protective effect elicited by L- and D-CAR was almost superimposable, we conclude that the pharmacological action of L-CAR is not due to a pro-histaminic effect (D-CAR is not a precursor of histidine, since it is stable to peptidic hydrolysis), and prompted us to propose that some of the biological effects can be mediated by a direct carbonyl quenching mechanism.
Keywords: carnosine, L and D enantiomers, carbonyl quenching activity, metabolic syndrome, obese Zucker rats, chronic treatment, renoprotection
Introduction
Obesity and overweight are linked with a cluster of metabolic and vascular disorders that have been termed the metabolic syndrome, characterized by impaired insulin sensitivity, hyperglycaemia, dyslipidaemia, obesity and hypertension. It has been estimated [1] that the syndrome affects a substantial percentage (10–20%) of the middle-aged and elderly populations of most European countries, and confers increased risk for type 2 diabetes (2–8.8-fold) and cardiovascular disease (1.5–6-fold), that ultimately will lead to economically unsustainable costs of health care in the next 10–20 years [2, 3]. The metabolic syndrome might be also an important factor in the cause of chronic kidney disease which is a major risk factor for end-stage renal disease and premature death [4]. Preventive strategies are required to slow the progression of the metabolic syndrome complications, and the research in this field has been facilitated by the availability of a hyperlipidaemic, non-diabetic animal model of nephropathy, the Zucker fa/fa rat. This rat model, showing many features of human syndrome X [5, 6] is not only hyperlipidaemic and obese (resulting from a homozygous defect in the leptin heparin receptor) but also hypertensive, insulin resistant and highly susceptible to the development of chronic renal disease in the absence of hyperglycaemia [7, 8].
Using this animal model, Alderson et al. [9] demonstrated that a long-term administration of pyridoxamine, a potent inhibitor of advanced lipoxidation end products (ALEs), restrained ALEs and advanced glycation end product (AGE) formation and hyperlipidaemia, preventing renal and vascular injury. This protective effect is explained by taking into account that the chemical modification of proteins by lipoxidation breakdown products is considered a primary cause of vascular and renal disease in fa/fa rats, even in the absence of hyperglycaemia.
An excessive or sustained increase in reactive oxygen species (ROS) and lipoxidation products (reactive carbonyl species, RCS) has indeed been implicated in the pathogenesis of several diseases, as well as in the co-morbidity of atherosclerosis and diabetes mellitus associated with obesity [10]. Lipid peroxides and 8-epi-PGF2α, a specific marker of oxidative stress, were doubled in the plasma of Zucker rats as compared to lean controls [11]. More recently, the involvement of lipid peroxidation in the renal injury of Zucker rats has been immunohistochemically demonstrated by the heavy deposition of 4-hydroxy-trans-2-nonenal (HNE) adducts with proteins in glomeruli and renal arteries [12, 13], and by the increased urinary excretion of carbonylation biomarkers, such as 1,4-dihydroxynonane mercapturic acid (DHN-MA), carnosine-HNE (CAR-HNE), His-1,4-dihydroxynonane (His-DHN), all arising by Michael adduction of HNE to cysteine and histidine-containing peptides [14]. In particular, the increased urinary amount of CAR-HNE, recognized in previous in vitro studies as a new potential biomarker of carbonyl stress [15], represents the first evidence of the in vivo ability of endogenous CAR to act as detoxifying agent of HNE. This finding definitively confirms CAR-HNE as a stable and reliable biomarker of lipid peroxidation and carbonylation in vivo.
Therefore RCS, (mainly HNE) along with the corresponding adducts with peptides and proteins, not only represent useful and predictive biomarkers of lipid peroxidation and, in general, of oxidative stress, but also a biological target for drug discovery in light of the convincing evidence supporting their pathogenic role in diabetic-related diseases, age-dependent tissue dysfunction and metabolic distress syndrome [10, 16, 17]. In this context, the most promising therapeutic approach to prevent/inhibit carbonyl stress-related diseases is based on those compounds able to deactivate the intermediate products of lipid peroxidation (as shown for pyridoxamine) or to scavenge/neutralize RCS, leading to non-reactive and non-cytotoxic reaction products. The clinical evidence that aldehyde-sequestering agents act as protective drugs is still limited to pyridoxamine (being now on the FDA ‘fast track’ to phase III clinical trials for prevention of diabetic nephropathy), and for this reason the development of novel aldehyde sequestering agents represents an emerging field of interest in medicinal chemistry. Although there is ample experimental evidence demonstrating the protective effects of several RCS scavengers in in vitro models and in some animal models, greater effort is required to confirm their carbonyl trapping capacity in vivo[10, 16, 17]. In previous studies we have demonstrated that L-CAR, besides its ability to act as an antioxidant, metal chelator, free radical scavenger and/or inhibitor of protein glycosylation, is an efficient and selective quencher of reactive and cytotoxic carbonyl species generated by lipooxidation, such as HNE and acrolein (ACR) [15, 18–21]. Up to now several studies reported a beneficial effect of CAR. Hipkiss reviewed the possible beneficial effects of CAR and related structures on protein carbonyl stress, AGE formation, secondary diabetic complications and age-related neuropathology [22]. Over the last 5 years, two independent studies have found an association between a trinucleotide repeat in exon 2 of the carnosine dipeptidase (CNDP)1 gene, which encodes carnosinase and diabetic nephropathy [23, 24]. A link between low serum concentrations of CAR and the risk for this late complication of diabetes has been proposed. Higher expression of carnosinase causes enhanced CAR degradation, resulting in a lower renal protective effect by CAR, because serum and urine CAR concentrations depend on carnosinase activity. Moreover, CAR was found to be effective in preventing several diseases associated to the carbonylation process, such as ageing [25], diabetes-related diseases [26, 27], brain, heart and renal ischemia damage [28–31] and bleomycin-induced lung injury [32]. However, no pharmacological studies to date have been conducted to demonstrate the carbonyl quenching activity of L-CAR. This represents the first aim of the current study, which was undertaken to determine whether a long-term administration of L-CAR can inhibit the carbonylation damage and the development of renal disease in Zucker fa/fa rat. In addition, recent findings seem to indicate that the reno-protective effect of L-CAR on ischemia/reperfusion-induced renal injury in rats is not explained by its antioxidant activity, but rather to a histamine dependent pathway. In particular, it has been proposed that L-CAR is enzymatically hydrolysed by carnosinase to form the two constitutive aminoacids, β-alanine and L-histidine, the latter converted to histamine which may be involved in the protective effect through the activation of histamine H3 receptors in the central nervous system [33]. Hence, to gain a deeper insight into the mechanism of action of CAR, we used a molecular modelling approach for designing a novel derivative which, maintaining the trapping activity and safety of the parent compound, is resistant to the enzymatic hydrolysis catalysed by serum carnosinase. The enantiomer β-alanyl-D-histidine (D-CAR) was chosen as a candidate and was evaluated, in parallel to L-CAR, for its carbonyl quenching activity and plasma stability in vitro, as well as for its protective effects (long-term administration) in the same hyperlipidaemic, non-diabetic animal model of nephropathy.
Materials and methods
Chemicals
All chemicals and reagents were of analytical grade and purchased from Sigma-Aldrich Chemical Co. (Milan, Italy). High-performance liquid chromatography (HPLC) grade and analytical-grade organic solvents were from Sigma-Aldrich Chemical Co. HPLC-grade water was prepared with a Milli-Q water purification system (0.22 μm filter, Millipore, Milan, Italy). L-Carnosine (β-alanyl-L-histidine, L-CAR), D-carnosine (β-alanyl-D-histidine, D-CAR) and the internal standard (IS) H-His-Tyr-OH were a generous gift from Flamma S.p.A (Chignolo d’Isola, Bergamo, Italy). Heptafluorobutyric acid (HFBA), ACR, 2,4-dinitrophenylhydrazine and the protease inhibitor cocktail were purchased from Sigma-Aldrich Chemical Co.; thiopentone sodium (Pentothal®) was obtained from Abbott S.p.A (Campoverde, Latina, Italy).
The enzymatic-colorimetric kits for total cholesterol (#17644), triglycerides ((#17624), glucose (#17630), creatinine (#17609), proteins (#17275) and albumin (#17600) determinations were obtained from Sentinel Diagnostic (Milan, Italy); enzyme immunoassay kits for 8-isoprostane (#516351), thromboxane B2 (TXB2; #519031) and insulin (#589501) determinations were obtained from Cayman Chemical Company (Ann Arbor, MI, USA).
HNE was prepared by acid hydrolysis of 4-hydroxy-non-2-enal-diethylacetal (HNE-DEA) (1 mM HCl, for 1 hr at room temperature), synthesized as previously described [15] and quantified by UV spectroscopy (λmax 224 nm; ɛ= 13.75 × 10⁴/cm/M). The CAR-HNE adduct was prepared according to the published method [15].
Instrumentation
Spectrophotometric and spectrofluorimetric measurements were carried out with a computer-aided Perkin Elmer UV-VIS Lambda 16 spectrophotometer and a computer-aided Perkin Elmer LS50B luminescence spectrometer (Perkin Elmer Life and Analytical Science Monza, Milan, Italy). Arterial blood pressure was measured using a modified BP-Recorder sphygmomanometer (Ugo Basile, Varese, Italy).
HPLC analyses for evaluating the HNE/ACR quenching ability were carried out on a Thermo Finnigan Surveyor LC system equipped with a quaternary pump, a Surveyor UV-Vis Diode Array (DAD) programmable detector 6000LP, a vacuum degasser, a thermostated column compartment and a Surveyor autosampler. HPLC-ESI-MS/MS analyses were performed on a ThermoFinnigan Surveyor LC system (see above) connected to a TSQ Quantum Triple Quadruple Mass Spectrometer (ThermoFinnigan Italia, Milan Italy) with electrospray ionization (ESI) source. Data acquisition and processing were performed by the Xcalibur 1.4 version software.
All observations in light microscopy were performed with a Leitz Laborlux S microscope (Leica Microsystems GmbH, Wetzlar, Germany). Electron microscopy examinations were carried out on a Jeol JEM 1010 instrument (Tokyo, Japan).
Computational studies
The homology model for human serum carnosinase was obtained based on β-alanine synthetase, as previously described [34]. L- and D-carnosine were built using the VEGA software (Molecular Modeling Toolkit, Milan, Italy). Carboxylic and amino groups were ionized, whereas the histidine imidazole ring was neutral (Nɛ-H tautomer). After a preliminary minimization, partial charges attribution and geometry optimization were performed by MOPAC 6.0. The ligand underwent a MonteCarlo conformational search using the VEGA, which generated 1000 conformers by randomly rotating the rotors. All conformers were minimized to avoid high-energy interactions, and the lowest energy one was used in docking calculations. All geometries obtained as such were optimized and clustered according to similarity (in order to discard redundant ones). In detail, two geometries were considered as non-redundant if they differed by more than 60 degrees in at least one torsion angle.
The docking and scoring procedure involved extensive rigid-body sampling with the OpenEye Scientific Software package FRED (OpenEye Scientific Software, Santa Fe, NM, USA). The FRED-based sampling was performed in 15 Å side box around the catalytic zinc ions. The obtained complexes were then refined focusing the minimization on the atoms inside a 10 Å sphere around the bound ligand.
In vitro studies
HNE and ACR quenching ability
The HNE and ACR quenching ability of L- and D-CAR was studied in homogenous solution by HPLC analysis, monitoring the time-dependent consumption of the aldehydes. HNE or ACR (200 μM) was incubated with L-CAR or D-CAR (2 mM) in 100 mM phosphate buffer (pH 7.4) for 60 min. and 24 hrs at 37°C. Some experiments were also performed by incubating ACR and L- or D-CAR at final concentrations of 50 μM and 500 μM, respectively. Sample aliquots relative to the different incubation times were directly analysed by HPLC in the following experimental conditions: reverse-phase elution with a Fusion-RP column (150 × 2 mm; particle size 4 μm) protected by a Fusion-RP guard column (4 × 2 mm; particle size 4 μm) (Chemtek Analytica, Anzola Emilia, Italy); isocratic mobile phase: 60% A (water/acetonitrile/formic acid; 9:1:0.01, v/v/v) and 40% B (water/acetonitrile; 1:9, v/v), at a flow rate of 0.2 ml/min.; UV detection set at 223 nm. Calibration plots in the 5–200 μM concentration range were used for quantization. Aldehydes quenching by L- and D-CAR was confirmed by ESI-MS/MS analysis of the incubates by detecting the HNE-CAR and ACR-CAR Michael adducts, according to the method previously published [18, 20].
Serum, liver and renal metabolic stability of L- and D-carnosine
Stability of D-CAR versus L-CAR was studied by incubating 90 μl of human serum (from 25–30-year-old healthy volunteers), human liver or S 9000 rat kidney fraction (0.25 g/ml) with 10 μl of 1 mM L- or D-CAR solution in 10 mM PBS (pH 7.4), or PBS (control). Matrices were pre-incubated at 37°C for 10 min. before adding the peptides. After incubation for different time periods (0, 15, 30, 60 and 120 min. and 24 hrs for serum; 0, 15, 30, 60 and 120 min. for liver and kidney), samples were spiked with 10 μl I.S. (500 μM solution in 1 mM PBS, pH 7.4) and then deproteinized by adding 110 μl of a 700 mM perchloric acid solution. After 15 min. at 4°C, the samples were centrifuged (17,000 rpm, 10 min.), and the supernatants were diluted (1:1 v/v) with the mobile phase A (water/acetonitrile/HFBA; 90:10:0.1, v/v/v), filtered and analysed by LC-MS/MS for L-CAR and D-CAR quantization as previously described [15].
In vivo studies
Pharmacokinetic profile of L-CAR and D-CAR in the rat
L-CAR or D-CAR was orally administered at a dose of 100 mg/kg to three male Sprague-Dawley rats/test compound. The compounds, dissolved in tap water, were given by gastric gavage. Approximately 3 days before treatment and while under anaesthesia, animals were fitted with a cannula implanted in the superior vena cava via the jugular vein. At the day of the experiment, approximately 150 μl of blood/sampling time were taken from the cannula in heparinized syringes, transferred immediately into tubes (pre-cooled in an ice/water bath) and centrifuged at 10,000 g for 3 min. at 4°C. Plasma was stored at –80°C until analysis. Blood was taken at the following times: pre-dose, 0.25, 0.5, 1, 2, 4, 6 and 24 hrs after dosing. Plasma samples were analysed by the LC-MS/MS method previously described [15] and the pharmacokinetics of both compounds were evaluated using a non-compartmental approach with the aid of WinNonlin version 3.1 (Pharsight Corporation, Mountain View, CA, USA) and Excel spreadsheet (Microsoft Inc., Seattle, WA, USA).
Pharmacokinetic profile of L-CAR was calculated by subtracting the pre-dose concentration of the dipeptide (endogenous content) to each plasma concentration determined after the oral dosing. Because in our experimental conditions L- and D-CAR are not separated, the same approach was also used for calculating the pharmacokinetic profile of D-CAR.
Cmax as well as tmax in plasma were read from the raw data as the coordinates of the highest concentration observed. The corresponding area under the plasma concentration versus time curve to finite time, AUC0 –t(last) was determined by the linear trapezoidal rule up to the last detectable concentration.
Animals and treatment
All experiments were carried out maintaining the animals in compliance with the Guide for the Care and Use of Laboratory Animals published by the US National Institutes of Health (NIH Publication No. 85–23, revised in 1996).
Male Zucker obese (fa/fa) rats (ZK, n= 36) and lean littermates (Fa/Fa) (LN, n= 12) were purchased at 5 weeks of age from Charles River Laboratories (Calco, Lecco, Italy). The animals were housed individually in a conditioned environment (22 ± 1°C, 55 ± 5% relative humidity, 12 hr light/dark cycles), and were fed standard laboratory rat chow (#C-52; Laboratorio Dottori Piccioni s.n.c, Gessate, Milano, Italy) and water. After 1 week of acclimation period, Zucker obese fa/fa rats were randomly divided into three groups of 12 each: untreated obese control (ZK), L-CAR-treated (ZK + L) and D-CAR-treated (ZK + D) animals. D-CAR and L-CAR were administered to fa/fa rats in the drinking water. Water consumption was monitored, and the concentration of both L- and D-CAR in the drinking water was adjusted weekly with the intended 24 hr drug dose of 30 mg/kg. The fa/fa rats received both D-CAR and L-CAR starting from the sixth week of age and the treatment continued until the 30th week of age. The dose of both the CAR enantiomers was chosen to be lower than that of pyrydoxamine (more than 2.5-folds on molar level), used by Alderson et al. in the same experimental model [9].
Plasma, urine and tissue sampling
At baseline, 12 hr fasting blood samples were collected from the tail vein in heparinized capillary tubes. At the end of the experiment, rats were anaesthetized with 60 mg/kg i.p. thiopentone sodium and blood was collected from the inferior cava vein. Blood samples were centrifuged for 15 min. (5000 rpm at 4°C), and plasma samples (500 μl aliquots) stored at –80°C until analysis. The animals were then killed by decapitation for kidney, liver, heart, lung, brain, muscles, aorta, cerebellum and tail collagen harvesting. For tissue analysis, only six rats within each group were randomly used because the other 6 rats within each group were killed for cardiovascular experiments, with isolated perfused rat hearts submitted to ischemia-reperfusion damage (manuscript in preparation). One kidney from each animal was cut in half transversely: one half was fixed in formalin for light microscopy and the other half was prepared for electron microscopy examination. The second kidney was immediately frozen in liquid nitrogen, and stored at –80°C until assayed. Just before analysis, tissue samples were thawed, rinsed in ice-cold physiological saline, weighed and minced. A 25% homogenate (w/v) of kidney was prepared in 0.15 M KCl buffer (pH 7.4), containing the protease inhibitor cocktail (50 μl/g wet tissue), and centrifuged at 12,000 ×g for 10 min. The pellet was discarded and the supernatant used for determination of CAR levels and total PCOs.
At 6 (basal) and 30 weeks of age, six rats within each group were placed in individual metabolic cages (#3600M021; Tecniplast S.p.A, Buguggiate, Varese, Italy) for urine collections while continuing to have access to food and water. After a 24 hr acclimation period, urines were collected for a 24 hr period, and then the animals were returned to their usual cages. During the 24 hr period spent in the metabolic cage, the animals did not receive L- or D-CAR. One millilitre of a 360 mM BHT ethanolic solution was added to the urine conical collection tubes (maintained at 4°C), and 5 ml aliquots were frozen and stored at –80°C until analysis.
Indirect systolic blood pressure (SBP) and heart rate measurements
At baseline and throughout the experiment, SBP was measured monthly in conscious rats by tail-cuff plethysmography [35]. The animals where pre-warmed at 37°C for 30 min., and the measurements were obtained with the rats restrained in a plastic chamber without anaesthesia. A pneumatic pulse transducer positioned on the ventral surface of the tail distal to the occlusion cuff detected the return of the pulse after a slow deflation of the cuff. Cuff pressure was determined by a pneumatic pulse transducer with a programmed electrosphygmomanometer (mod 58500; U. Basile, Comerio, Varese, Italy). SBP values for individual rats were obtained from the average of three consecutive measurements and were considered valid only when these readings did not differ by more than 5 mmHg. At the same time, heart rate was measured from the arterial pulse wave.
Plasma parameters
Plasma levels of cholesterol, triglycerides, glucose, creatinine and insulin were measured using available and specific enzymatic-colorimetric kits, and in accordance with the manufacturer’s instructions. Homeostatic model assessment of insulin resistance (HOMA-IR) was calculated from fasting glucose and insulin levels as a measure of insulin resistance [36]. Lipofuscins were spectrofluorimetrically determined according to the method reported by [37], setting the excitation/emission wavelengths at 330 nm and 455 nm, respectively.
Urinary parameters
Renal disease was assessed by measuring the 24 hr urinary excretion of albumin, total urinary protein and creatinine, using commercially available kits. The glomerular filtration rate (GFR; ml/min.) was calculated based on 24-hr urine creatinine clearance, using the standard formula C = U*V/P*1440, where U is the creatinine concentration in urine (mg/ml), V is the 24-hr urine volume, and P is the plasma creatinine concentration (mg/ml). The levels of 8-epi-prostaglandin F2α (8-epi-PGF2α; a marker of oxidative stress) and thromboxane B2 (TXB2; a stable metabolite of thromboxane A2) in urine were measured using the enzyme immunoassay according to the manufacturer’s instructions.
Low molecular weight AGE levels were determined by measuring AGE-specific fluorescence (λex 370 nm; λem 440 nm) according to the method reported by Kirschbaum [38]. AGE values were expressed as fluorescence units/mg urinary creatinine.
The Michael adduct of HNE to carnosine (CAR-HNE) was used as stable biomarker for lipid peroxidation and carbonyl stress, and was determined in urines by the LC-ESI-MS/MS method recently developed and validated [14]. Quantitations were performed in multiple reaction monitoring mode (MRM), at 2.00 kV multiplier voltage, and data processing was performed by Xcalibur 1.4 version software.
Renal tissue parameters
Morphology and morphometry
Renal histology and morphometry were conducted on formalin fixed and paraffin-embedded renal sections from half kidney for each animal. Four-micrometer sections were stained with haematoxylin and eosin, PAS (periodic acid-Schiff), PAS-m, Gomori and Masson trichrome. Glomerulosclerosis, defined as increases in glomerular matrix, segmental collapse, obliteration of capillary lumina and accumulation of hyaline PAS positive material, was estimated performing a semi-quantitative score [39]. In each specimen 100 glomeruli were examined at 400× magnification and the percentage of glomerular involvement was graded from 0 to 4+ according to the following scores: 0 (absent); 1+ (1→25%); 2+ (26→50%); 3+ (51→75%) and 4+ (>76%). Glomerulosclerosis data were expressed as a percentage of the number of glomeruli considered. Tubulointerstitial injury, defined as inflammatory cell infiltrates, tubular dilatation and/or atrophy (epithelial cell attenuation and tubular cystic dilatation), and interstitial fibrosis were assessed on 10 consecutive microscopic fields at 100× magnification, and the severity of the injury was graded as mild, moderate or severe according to the number of microscopic fields involved. Thus, mild lesion represented an involvement of 1 to 3 microscopic fields, moderate 4 to 6 and severe 7 to 10. The mean glomerular corpuscle diameter for each rat was measured in 10 glomeruli per kidney at ×400 magnification.
The cortical kidney from four rats within each group were cut in small samples (2 × 2 × 1 mm) fixed in 2.5% glutaraldehyde (in 0.13 M phopsphate buffer), routinely processed and embedded in epoxy resin for electron microscopy examination. The Marquez simplified method was applied in order to assess the median glomerular basement membrane (GBM) thickness in each group of rats [40]. Briefly: about five points per glomerular loop at a distance of 4 mm on micrographs taken at 4000× microscope magnification, printed at 16,000× final magnification, were measured. Three to five glomeuli per rat and four to five capillary loop per glomerulus were considered.
Protein carbonylation
Protein carbonyl content (PCOs) was quantified by reaction with 2,4-dinitrophenylhydrazine (2,4-DNPH) according to [41] with slight modifications (increased washings to quantitatively remove un-reacted DNPH). Total PCOs were determined from the absorbance at 366 nm using a molar absorption coefficient of 22,000/M/cm [41], and expressed as nmoles/mg protein.
Cholesterol and triglycerides content
Total cholesterol and triglycerides content (μg/mg protein) in S 9.000 kidney fraction (0.25 g/ml) were determined by using commercial kits (Sentinel Diagnostic) and following the procedure described by Allain CC et al. [42].
Plasma, urine and tissue levels of carnosine
Plasma and urine levels of L- and D-CAR were determined by the HPLC-MS/MS method previously developed and validated [15]. Briefly, renal tissue homogenates (0.1 ml aliquots) were spiked with the internal standard (final concentration 5 μM), deproteinized with perchloric acid, centrifuged and the L- and D-CAR concentrations (expressed as nmoles CAR/g wet tissue) were determined in the supernatants.
Tail tendon collagen
Tail tendons were removed surgically, cleaned free of bone segments, debris and fat. After washing with ice-cold phosphate buffer (pH = 7.00; 75 mM), samples were frozen in liquid nitrogen and then lyophilized. Collagen solubility was determined on 10 mg samples as described by Yang et al. [43], with determination of hydroxyproline content by the method of Reddy and Enwemeka [44] following acid hydrolysis [45]. Collagen amount in tail tendon samples was calculated assuming 14% content of hydroxyproline [46, 47]. For the determination of collagen fluorescence and Ehrich’s adducts, 50 mg aliquots of lyophilized collagen were enzymatically hydrolysed and analysed as reported by Stefek et al. [46]. Aliquots of pepsin-digested samples were used to assay hydroxyproline, as above described. Fluorescence was measured at excitation and emission wavelengths of 365 and 416 nm, respectively. All fluorescence values were corrected for the fluorescence of a blank of pepsine and expressed per milligram of collagen. Erlich’s adducts absorbance, following reaction of digested collagen with p-dimethylaminobenzaldehyde, was normalized to collagen content.
Statistical analysis
Data are expressed as mean ± S.E.M unless stated otherwise. For statistical analysis, ANOVA, followed by the Tukey’s post-test for multiple group comparison was performed with the GraphPad Prism software 4.00 (GraphPad Prism Software, Inc., San Diego, CA, USA), with statistical significance set at P < 0.05. Student’s unpaired t-test was used wherever appropriate to compare variations between the groups.
Results
In silico studies
Figure 1 compares the best position of L- and D-CAR within the catalytic site of serum carnosinase as obtained by docking calculations which unveiled that the two carnosine isomers similarly accommodate the imidazole ring which contacts Leu254 and Thr424 in both cases, whereas the ionized groups are arranged in a totally different way. In detail, the carboxyl group in L-CAR interacts with Zn++ ion and the ammonium head stabilizes ion-pairs with Asp116 and Glu451, whereas in D-isomer the carboxylate cannot generate significant interactions and the ammonium head clashes against the Zn++ ion. In the considered D-CAR complex, the peptidic carbonyl is accommodated near to Zn++ ion in a position plausibly conducive to the catalysis, but the bad contacts of carboxyl and ammonium functions prevent a stable complex with carnosinase. When analysing all computed positions, one can also find complexes in which the ionized groups of D-CAR are suitably arranged but the amidic carbonyl cannot approach the Zn++ ion. This suggests that D-CAR cannot bind the enzyme in a position catalytically efficient thus justifying its marked stability in plasma as reported below.
Fig 1.
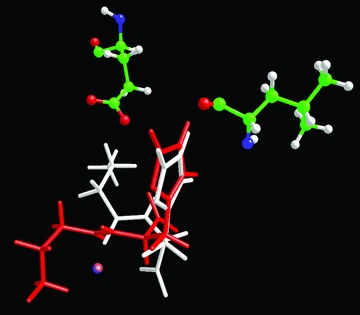
Comparison of the best pose for L- (white) and D- (red) carnosine. The figure shows that the imidazole ring is accommodated in a very similar mode, but the charged groups assume totally different arrangements, thus explaining the incapacity of D-carnosine to assume a pose conducive to the catalysis.
In vitro studies
HNE and ACR quenching
The quenching ability of L-CAR towards HNE and ACR was found to be similar to that of the enantiomer, indicating that the chiral carbon configuration does not affect the quenching reactivity. In particular, the residual amount of HNE incubated for 60 min. with L-CAR (1:10 molar excess) was of 46.2 ± 2.73%, and not significantly different (P > 0.5, t-test) when using D-CAR (46.9 ± 2.3%). Both the enantiomers quenched almost 100% HNE after 24 hrs of incubation. When ACR (200 μM) was incubated with L-CAR or D-CAR (1:10 molar excess), almost 100% of the aldehyde disappeared after 60 min. of incubation, and this is well explained by considering the higher electrophilic reactivity of ACR compared to that of HNE. In order to compare the reactivity of L- versus D-CAR towards ACR, the reaction rate was reduced by lowering the ACR concentration to 50 μM, maintaining the molar ratio aldehyde: quencher unmodified (1:10). In these conditions, after 60 min. of incubation, the percentage amount of ACR quenched by L-CAR was 63.8 ± 3.5% not statistically different to the effect elicited by D-CAR (65.0 ± 3.3%; P > 0.05 t-test).
Serum and liver/kidney stability
The kinetics of the enzymatic hydrolysis of L-CAR and D-CAR in human serum was followed over 24 hrs, and the results are shown in Figure 2A. The resistance of the two enantiomers to serum carnosinase was significantly different: although L-CAR rapidly disappeared in human serum at the first time-point (60 min.), D-CAR remained unchanged until 6 hrs incubation, and decreased by only 6% after 24 hrs of incubation. It should be noted that L-CAR is rapidly hydrolized in human serum within 5 min. of incubation, as recently reported [48].
Fig 2.
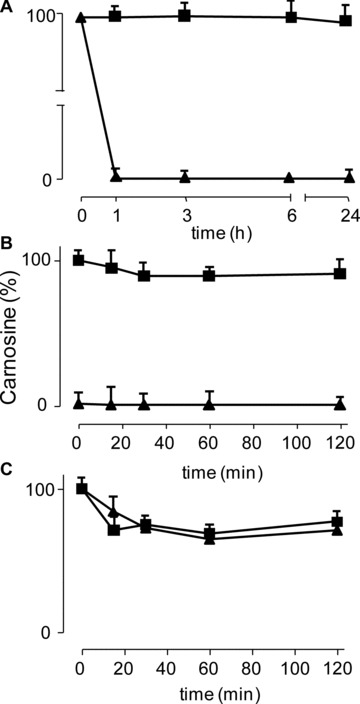
In vitro studies: kinetics of the enzymatic hydrolysis of L-CAR (triangle) and D-CAR (square) in (A) human serum, (B) rat kidney and (C) human liver.
The same experiment was then done in rat kidney (Fig. 2B) and human liver S 9.000 fraction (Fig. 2C). In the human liver, both the compounds were found to be hydrolized by almost 30% within 15 min. and then remained unchanged until 120 min. incubation. In the rat kidney, L-CAR was completely hydrolized in a few minutes (about 93% of hydrolysis during the sample processing time) whereas D-CAR remained almost unchanged for at least up to 120 min. of incubation (91% remaining).
In vivo studies
Pharmacokinetic profile of L-CAR and D-CAR in the rat
Figure 3 reports the PK profiles of L- and D-CAR. Endogenous concentration of L-CAR before the treatment was 0.193 ± 0.04 nmoles/ml. After an oral administration of L-CAR (100 mg/kg), the maximal plasma level of the compound was reached 1 hr after dosing (Cmax 147.7 ± 6.50 nmoles/ml). The plasma concentration declined rapidly and returned to the baseline at 2 hrs after dosing. The half-life of the compound was estimated to be 0.24 ± 0.02 hrs. The systemic exposure up to infinite time was 118.45 ± 9.24 nmoles*hr/ml. The variability (CV%) of the systemic exposures descriptors, Cmax and AUC(0 –∞), was 8.97% and 12.04%, respectively.
Fig 3.
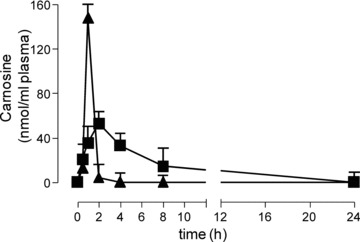
Time course of L-CAR (triangle) and D-CAR (square) in rat plasma, after oral administration of 100 mg/kg.
After an oral administration of D-CAR (100 mg/kg), the maximal plasma concentration of the compound (Cmax) was 52.86 ± 2.86 nmoles/ml, reached at 2 hrs after dosing. The plasma concentration declined with an apparent terminal half-life of 3.36 hrs ± 0.74 and was above the baseline level until 24 hrs after dosing. The systemic exposure up to infinite time was 318.62 ± 24.75 nmoles*hr/ml. The variability (CV%) of the systemic exposures descriptors, Cmax and AUC(0 –∞), was 7.64% and 11.01%, respectively.
Hence, the two enantiomers of carnosine showed a different pharmacokinetic behaviour. L-CAR was more rapidly absorbed, as well as more rapidly cleared from the circulation, than the D-form.
Effect of L- and D-CAR supplementation on metabolic syndrome risk factors
Water and food intake
All the 12 LN (Fa/Fa) and 36 ZK (fa/fa) rats participating in the study survived up to the end of the experiment and appeared generally healthy. The water intake was not significantly different among the four groups (data not shown), although food intake significantly increased from 24 ± 5 g/day in LN rats to 35 ± 5 g/day in ZK rats (P < 0.05). Food intake was also increased in ZK + D (33 ± 4 g/day) and ZK + L rats (30 ± 6 g/day) (P < 0.01 versus LN; not significant versus ZK) (data not shown).
Anti-obesity effect
At the beginning of the study, the 6-week-old LN animals weighed significantly less than ZK rats (Table 1). All animals gained weight throughout the study period, and at the end of the experiment (30 weeks) the body weight of ZK rats was significantly higher (+53.5%) than that of LN animals (Fig. 4A). In both the groups supplemented with L-CAR and D-CAR the body weight gain was significantly restrained compared to ZK (+35.8% and +40% respectively versus LN; –12% and –9%versus ZK), indicating a significant anti-obesity effect of both the enantiomers.
Table 1.
Plasma and urinary parameters at baseline (6 weeks)
| LN | ZK | |
|---|---|---|
| Rat weight (g) | 144 ± 2 | 174 ± 2* |
| Food intake (g/day) | 13 ± 1 | 15 ± 2 |
| SBP (mmHg) | 118 ± 4 | 126 ± 4 |
| Plasma cholesterol (mg/dl) | 84 ± 9 | 105 ± 6 |
| Plasma triglycerides (mg/dl) | 69 ± 5 | 80 ± 6 |
| Plasma glucose (mmol/l) | 6.2 ± 0.5 | 7.0 ± 0.5 |
| Plasma insulin (pmol/l) | 47.5 ± 6.3 | 78.5 ± 5.5 |
| Plasma creatinine (mg/dl) | 0.75 ± 0.05 | 0.82 ± 0.03 |
| Urinary creatinine (mg/ml) | 6.7 ± 0.4 | 6.6 ± 0.4 |
| Urinary albumin (mg/ml) | 2.1 ± 0.3 | 2.5 ± 0.2 |
| Urinary proteins (mg/ml) | 5.0 ± 0.4 | 5.6 ± 0.3 |
| Urinary volume (ml/day) | 15.3 ± 0.5 | 15.8 ± 0.8 |
| Urinary creatinine (mg/day) | 102.5 ± 6.1 | 104.3 ± 6.3 |
| Urinary albumin (mg/day) | 32.1 ± 4.1 | 39.5 ± 3.1 |
| Urinary proteins (mg/day) | 76.5 ± 6.3 | 88.5 ± 4.8 |
All values are expressed as means ± S.E.M. (N= 12 for plasma values; n= 6 for urinary values).
P < 0.05 versus LN group; not significant if no indications are reported.
Fig 4.
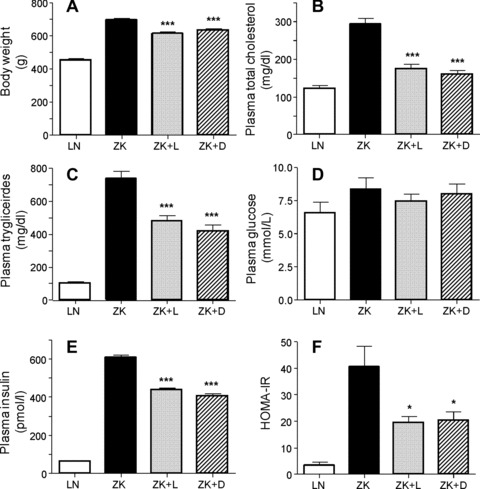
Body weight and plasma analytical determinations in LN, ZK and Zucker treated animals (ZK + L; ZK + D). Values are expressed as mean ± S.E.M. relative to six animals/group. All ZK values statistically different from LN (P < 0.001), except for glucose (not statistically different). All ZK + L and ZK + D values not statistically different. *P < 0.05 versus ZK, ***P < 0.001 versus ZK.
Hypolipidaemic effect
Plasma–Table 1 summarizes the plasma parameters relative to LN and ZK rats at the beginning of the study. Among all the considered parameters, only the body weight was found significantly different between the two groups. In line with previous results [9, 49], the age-dependent increase of body weight in ZK was associated to a significant increase in plasma cholesterol and triglycerides, but not in plasma glucose, over the 24 week period (Fig. 4). In particular, in ZK rats, the plasma cholesterol and triglycerides levels were elevated by 2.4- and 7.0-fold, respectively, compared to LN animals. The changes in metabolic parameters that occurred in L- and D-carnosine-fed rats after 24 weeks are shown in Figure 4. As compared to ZK rats, plasma cholesterol (Fig. 4B) and triglycerides (Fig. 4C) levels were significantly reduced in both ZK + L and ZK + D animals. Although D-CAR was slightly more effective than L-CAR in decreasing cholesterol (–45%versus–40%) and triglycerides (–43%versus–35%), overall, no statistically significant differences were observed between the two treated ZK groups.
Kidney– The total cholesterol content (μg/mg protein) in kidney was 2.4-fold increased in ZK (9.757 ± 0.895) compared to LN rats (LN: 4.095 ± 0.125; P < 0.05), and significantly restrained in both groups of treated animals, by 35–32% and in particular: ZK + L: 6.31 ± 0.5115 (P < 0.05 versus ZK); ZK + D: 6.668 ± 0.5087 (P < 0.05 versus ZK, data not shown). Similar results were obtained for triglycerides content (μg/mg protein): the levels in ZK rats (17.92 ± 2.135) was 2.3-fold compared to LN rats (7.893 ± 1.387; P < 0.05), with a significant restraint (33–41%) in both groups of treated animals: ZK + L: 12.01 ± 0.9528 (P < 0.05 versus ZK); ZK + D: 10.66 ± 0.3616 (P < 0.05 versus ZK, data not shown).
Insulin/glucose levels
In agreement with previous studies [9, 49], despite the large differences in body weights, the mean fasting blood glucose concentration between LN and ZK groups did not significantly change, ranging from 6.2 to 8.4 mmol/l throughout the entire experiment (LN 6.5 ± 0.8 mmol/l; ZK 8.4 ± 0.9 mmol/l). Treatment with L- or D-CAR did not significantly affect the plasma glucose levels (Fig. 4D). At the beginning of the study (6 weeks), plasma insulin concentrations were 47.5 ± 6.3 pmol/l and 75.8 ± 5.5 pmol/l in LN and ZK rats, respectively (Table 1). At the end of the experiment, plasma insulin concentration did not change significantly in LN (64.4 ± 3.5 pmol/l), whereas it dramatically increased in ZK rats (608.3 ± 12.7 pmol/l) (Fig. 4E), as reported by other authors [13, 50]. L- and D-CAR treatment significantly restrained the development of hyperinsulinaemia (28.08% and 33.03% reduction, respectively) (Fig. 4E).
As expected, the ZK rats had greater insulin resistance, expressed as HOMA-IR, than did the LN rats and this parameter was significantly improved in both the ZK + L and ZK + D animals (Fig. 4F).
Anti-hypertensive effect
At the baseline, mean SBP was almost superimposable in all the experimental groups, ranging from 118 ± 4 to 126 ± 4 mmHg (Fig. 5). In accordance with the literature data [39], the monthly evaluation showed a time-dependent increase of SBP in ZK but not in LN rats (Fig. 5). At the end of the study (30 weeks), the untreated ZK rats developed a significant hypertensive status, as demonstrated by the significant rise in SPB (+42%) compared to LN animals.
Fig 5.
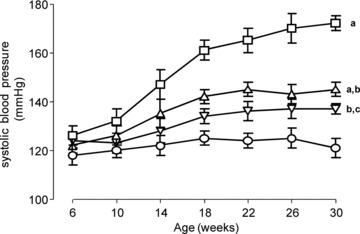
Evolution of SBP, during the study, in LN (circle), ZK (square) and Zucker treated animals (ZK + L, triangle up; ZK + D, triangle down). (A) P < 0.001 versus LN; (B) P < 0.001 versus ZK; (C) P < 0.05 versus LN. ZK + L and ZK + D values not statistically different.
The magnitude of SBP elevation was significantly restrained in ZK rats treated with either L- and D-CAR, and the extent of decrease was quite similar and not significantly different at all the time-points. In particular, the SBP values measured at the end of the experiment in ZK + L and ZK + D treated animals (Fig. 5) were reduced by 11.5% (145 ± 3 mmHg) and 15.7% (137 ± 4 mmHg), respectively. No changes in heart rate measurements were observed in the four experimental groups, neither at the start nor at the end of the study (data not shown).
Renal function
The onset and progression of the renal damage in obese rats, as well as the protective effect of L- and D-CAR, were evaluated by considering several indicators such as plasma and urine creatinine levels (24 hrs), urinary excretion of total proteins and albumin (24 hrs), as well as by light and electron microscopy analysis of the kidney tissue.
A 2.4-fold increase in plasma creatinine concentration was observed in ZK compared to LN rats (P < 0.001), an effect that was significantly restrained by both L-CAR (–31.7%versus ZK; P < 0.001) and D-CAR (–36%versus ZK; P < 0.001) (data not shown). A similar protective trend was also observed by considering the urinary albumin, creatinine and protein excretions, which were increased 14-fold (P < 0.001), 2.5-fold (P < 0.001) and 6.8-fold (P < 0.001), respectively, in ZK rats compared to the LN animals. Both L-CAR and D-CAR provided a significant protection against the development of proteinuria/albuminuria/creatininuria, which was restrained by approximately 50% (data not shown). The overall renoprotective effect of both the compounds is well described by the parameters reported in Figure 6. Creatinine clearance (expressed as GFR), was reduced by 45.8% in ZK compared to LN rats, and was significantly improved by both L-CAR (+28.3%versus ZK) and D-CAR (+25.1%versus ZK) (Fig. 6A). A more pronounced protective effect was induced by both the compounds on the urinary albumin-to-creatinine ratio, which is the early, easily measurable and reliable biomarker of nephropathy [51] (Fig. 6C). The 35-fold increase observed in ZK compared to LN animals was, in fact, restrained by 65–70% in both L- and D-CAR treated animals.
Fig 6.
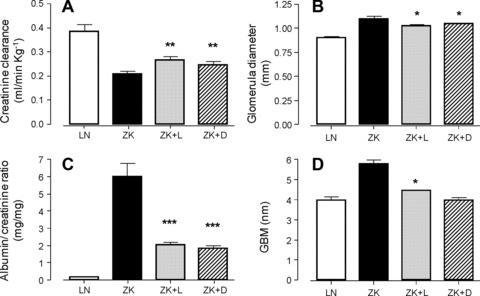
Renal functions and histological alterations in LN, ZK and Zucker treated animals (ZK + L; ZK + D). Values are expressed as mean ± S.E.M. relative to six animals/group. All ZK values statistically different from LN (P < 0.001). All ZK + L and ZK + D values not statistically different. *P < 0.05 versus ZK, **P < 0.01 versus ZK, ***P < 0.001 versus ZK.
As previously reported for plasma parameters D-CAR was slightly, but not significantly, more effective than L-CAR in reducing all the indicators of renal impairment.
Light microscopy examinations clearly indicate the development of glomerulosclerosis (mild degree) and tubulointerstitial damage in 30 week ZK rats when compared with those of age-matched control LN, in accordance with the literature data [52] (data not shown). These glomerular and interstitial changes, although appearing less common in ZK + L and ZK + D versus ZK rats, were not significantly modified by both treatments (data not shown), which conversely were able to slightly but significantly restrain the increase in the mean glomerular diameter (Fig. 6B), from 1.098 ± 0.05 in ZK to 1.023 ± 0.02 (L-CAR) and 1.042 ± 0.005 (D-CAR).
At the ultrastructural level, the increase in GBM thickness in ZK rats compared to LN animals (5.8 ± 0.6 nm versus 3.9 ± 0.5 nm; P < 0.01) is another important morphologic modification in renal disease linked to metabolic syndrome, already reported in Zucker obese rats [52] and in FVBdb/db diabetic mice [51]. Although measurements were done on only four animals for each group, the results reported in Figure 6D clearly indicate the ability of both the treatments to prevent GBM alteration, with D-CAR being able to maintain the GBM thickness in the range of the LN controls (3.75 ± 0.8 nm). Furthermore, in treated rats, glomeruli foot processes of podocytes show normal appearance whereas in ZK they are swollen, as clearly shown in Figure 7A–D.
Fig 7.
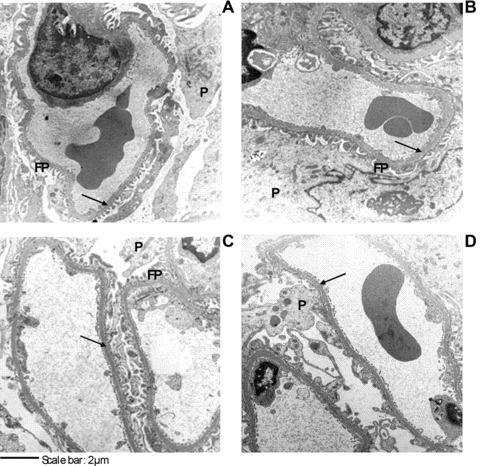
Glomerular capillary loops in LN (A), ZK (B) and Zucker treated animals (ZK + L, C; ZK + D, D). Arrows point to GBM. Up left: LN rat with normal GBM thickness, podocyte and foot processes; up right: ZK rat with thick GBM, edematous podocyte and foot processes; down left and down right: ZK + L and ZK + D rats with almost normal GBM thickness, podocyte and foot processes. GBM: glomerular basement membrane; P: podocyte, FP: foot processes.
Oxidative/carbonyl stress indices
The urinary excretion rate of cyclooxygenase metabolites, determined at the end of experiments, is reported in Table 2. The levels of TXB2 increased 2.6-fold in ZK rats compared to LN animals. Likewise, urinary excretion rates of 8-epi-PGF2α were 3.9-fold higher in ZK rats compared to LN animals. Treatment with L-CAR and D-CAR largely prevented the increase in the specific urinary marker of oxidative stress, but did not affect urinary TXB2 excretion rates. This confirms the involvement of both the CAR enantiomers in attenuating the oxidative stress, and excludes any effect in the inflammation pathway.
Table 2.
Oxidative/carbonyl stress parameters at the end of the experiment
| LN | ZK | ZK + L | ZK + D | |
|---|---|---|---|---|
| TXB2 level (ng/day)† | 12.8 ± 1.6 | 32.8 ± 4.2°° | 35.3 ± 3.3** | 27.4 ± 3.1** |
| 8-epi-PGF2α level (ng/day)† | 15.8 ± 2.3 | 62.4 ± 5.2°° | 37.6 ± 4.3* | 42.1 ± 3.9* |
| AGEs (FU/mg creatinine/day)‡ | 182.9 ± 24.4 | 610.1 ± 36.6°°° | 337.2 ± 28.7** | 324.4 ± 21.8*** |
| CAR-HNE level (nmol/day)‡ | 0.069 ± 0.01 | 0.436 ± 0.07°° | 0.749 ± 0.37 | 0.982 ± 0.33 |
| Kidney PCOs (nmol/mg prot)‡ | 5.94 ± 0.76 | 11.52 ± 1.59° | 8.83 ± 1.91* | 6.61 ± 1.52** |
| Ehrlich adducts (μmol/mg)‡ | 0.275 ± 0.09 | 0.955 ± 0.31°° | 0.868 ± 0.39 | 0.747 ± 0.384 |
| Collagen solubility (%)‡ | 89.4 ± 2.83 | 39.3 ± 2.87°°° | 65.4 ± 2.58** | 71.4 ± 3.14*** |
Studies on urine fluorescence have been previously reported to correlate with the concentrations of AGEs, and increased levels of AGEs have been associated with aging and with the onset and development of chronic and degenerative diseases, renal injury included [38, 53]. The results of this study show that the 24 hr urinary excretion of AGEs (FU/mg creatinine/24 hr), as determined by the measurement of their typical fluorescence, was 3.3-fold increased in ZK compared to LN rats, despite the reduced GFR, and were significantly reduced in both the treated groups, by 45–47% (Table 2).
By applying a recently developed LC-MS/MS method [14], we have shown that the Michael adduct between CAR and HNE is a stable and reliable biomarker of lipid peroxidation and carbonylation in vivo. By demonstrating higher levels of this adduct in urine from ZK rats compared to LN animals, we confirmed HNE overproduction in obese animals and the role of CAR as an endogenous detoxifying agent of RCS. The same analytical approach was applied in this study to confirm the in vivo RCS-trapping ability of exogenous L- and D-CAR. Figure 8 summarizes these results and shows typical LC-ESI-MS/MS profiles of urine, relative to the four groups of animals, acquired in MRM by setting the precursor ion at m/z 383.1 (CID@40.00 V). As reported in Table 2, the CAR-HNE levels increased 6.3-fold in ZK rats compared with LN animals. The treatment with L-CAR provides a further 1.7-fold increase in CAR-HNE levels compared to ZK rats, and D-CAR was slightly, but not significantly, more effective (2.2-fold increase).
Fig 8.
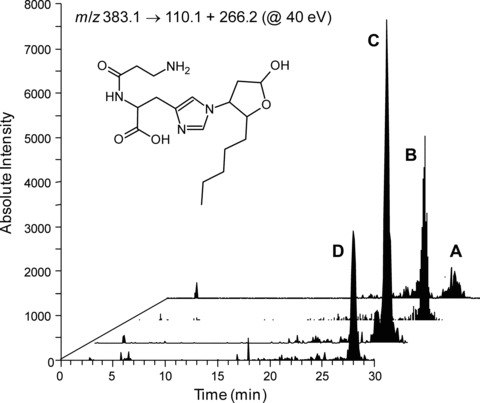
Selected Reaction Monitoring (SRM) chromatogram, relative to CAR-HNE parent ion → product ions transition, in LN (A), ZK (B) and Zucker treated animals (ZK + D, C; ZK + L, D) and CAR-HNE structure.
Solubility of collagen isolated from tail tendon of control and obese rats was taken as an indicator of the extent of collagen crosslinking. As shown in Table 2, tail collagen from ZK rats was significantly more crosslinked than that of control animals, based on its decreased solubility in acetic acid (56.1% reduction). The treatment with L-CAR resulted in a significantly increased solubility compared to ZK rats (66.4% increase), whereas D-CAR was slightly, but not significantly, more effective in respect to the L-enantiomer.
The lower ZK collagen solubility was not associated to an increase of collagen fluorescence (ZK 8.8 ± 1.8 UF/mg versus LN 8.0 ± 2.0 UF/mg; P > 0.05) (data not shown). Conversely, we found more than a 3-fold increase in the content of Ehrlich positive material in ZK compared to LN animals (Table 2), reflecting a higher degree of protein pyrrolization as a consequence of lipid peroxidation and oxidative stress [54]. D-CAR and L-CAR slightly, but not significantly, reduced these changes by almost 21.7% and 9.1%, respectively.
The results obtained by the analysis of the protein carbonyls content in kidney homogenates are shown in Table 2. The levels of PCOs in ZK rats were nearly doubled than those found in LN rats. The treatment with L-CAR provided a 23.4% reduction, whereas D-CAR was significantly more effective (42.61% decrease).
Carnosine levels in plasma, urine and renal tissue
Plasma, urine and tissue concentration of L- and D-CAR were determined at the end of the experiment in the four experimental groups (Table 3). Plasma concentration of endogenous CAR was reduced, but not significantly, in ZK compared to LN animals and was not statistically different following the chronic treatment with L-CAR. By contrast, more than a 10-fold increase was observed in ZK + D treated animals. As expected, the urinary concentration of D-CAR was found to be greatly increased in ZK + D rats, in respect to LN and ZK + L rats. The kidney content of carnosine in ZK rats was slightly, but not significantly, reduced in respect to LN rats. Treatment with L-CAR provided a slight increase in CAR content compared to ZK rats (1.6-fold increase), and D-CAR was markedly more effective, providing a 14.4-fold increase in tissue levels.
Table 3.
Carnosine levels in plasma, urine and renal tissue at the end of the experiment
The higher amount of D-CAR in respect to L-CAR in urine and plasma are explained by considering that during the 24 hrs in metabolic cages, the rats were not treated with the compounds. As reported in the pharmacokinetic studies (see above), L-CAR is rapidly absorbed and also rapidly excreted (half-life = 0.24 ± 0.02 hrs). Hence, it is reasonable to suppose that the amount of L-CAR absorbed by the rats was rapidly eliminated before entering into the metabolic cage, and this explains the lack of CAR increase in plasma after 24 hrs, as well as the slight increase of L-CAR in the urine and in the kidney tissue in respect to ZK rats. By contrast, D-CAR reached the Cmax after 3.36 hrs and was more stable in plasma, reaching pre-dose plasma concentration after 24 hrs. Hence, the D-CAR absorbed by the rats prior to entering the metabolic cage was absorbed and then slowly excreted during the 24 hrs spent into the metabolic cage, thus explaining the significant amount of D-CAR in the plasma, urine as well as in the kidney.
Discussion
In this study we found that CAR greatly reduced obese-related diseases in obese Zucker rats, significantly restraining the development of dyslipidaemia, hypertension and renal injury. We here propose that some of the biological effects of CAR in Zucker obese rat can be mediated by a direct carbonyl quenching mechanism. This hypothesis is firstly sustained by the in vivo capacity of supplemented CAR to quench RCS, as demonstrated by detecting CAR-HNE Michael adduct in the urine of obese rats, following CAR treatment. In addition, the higher CAR-HNE levels found in obese untreated animals compared to the lean counterpart, further confirm a systemic overproduction of RCS (and HNE in particular) in this animal model. Hence, the obese Zucker rat can be considered a suitable animal model of carbonylation damage involved in obese-related diseases, and that CAR acts as a RCS detoxifying agent.
Further evidence suggesting a RCS-quenching mechanism is that the diseases inhibited by CAR have a common pathogenetic route, i.e. the oxidative/carbonyl stress, which represents the molecular target of CAR itself. CAR was found to significantly restrain kidney damage by reducing the urine albumin-to-creatinine ratio, as well as the increase in glomerular base membrane thickness. The improved renal function is confirmed by the ultrastructural analysis, showing reduction of podocytes swelling and GBM thickness. In obese Zucker rats, the renal damage can be induced by several oxidative-based mechanisms. Dominguez et al. [12] proposed that nephropathy can be in part caused by renal lipid peroxidation. Renal injury was found to be linked to expression of glomerular oxidized low-density lipoprotein receptor 1, to renal inflammatory cell infiltrates, and to heavy accumulation of HNE, which is thought to be a causal agent of renal injury, as indicated by its inhibitory action on 3-hydroxyisobutyrate dehydrogenase, a redox-sensitive mitochondria enzyme that is rate limiting for valine catabolism and critical in gluconeogenic flow. In particular, oxidized lipoproteins cleared by the kidney release ROS species, including HNE, and damage glomerular endothelium. Carbonylation damage and accumulation of HNE-protein adducts in the kidney of obese Zucker rats has been further confirmed by several other authors. Namikoshi T et al. [13] recently found an HNE accumulation in glomeruli, arterioles and renal arteries of Zucker obese rats, accompanied by an increased expression of reduced form of nicotinamide adenine dinucleotide phosphate [NADP(H)] oxidase components in the renal cortex. Hence, one possible protective effect induced by CAR can be ascribed to a direct HNE-quenching mechanism in the vasculature and the kidney. This is confirmed by the significant reduction of RCS-protein adducts deposition afforded by the CAR treatment. Moreover, as discussed by Alderson et al. [9], dyslipidaemia and hyperlipidaemia are recognized as independent risk factors for development of renal diseases. Glomerulosclerosis infiltration by macrophages preceeds albuminuria in the kidney of Zucker rats, possibly the result of a lipid-induced inflammatory process. The extremely high levels of cholesterol and triglycerides in obese rats likely contributed to the marked elevations of circulating hydroperoxides. Thus, assuming that hyperlipidaemia causes renal injury via inflammation and associated lipid peroxidation reactions, CAR may protect kidney by both its lipid-lowering effect and RCS quenching mechanism.
Beside nephropathy, CAR treatment was effective in reducing other Zucker obese related-diseases, which have a common pathogenetic oxidative stress/carbonylation route. In particular, causative link between RCS and development of hypertension has been recently found [55, 56]. RCS are well known to induce chemical modification and crosslinking of renal and vascular collagen, thus to induce thickening and loss of elasticity of vascular wall, contributing to hypertension development [57, 58]. Protein crosslinks can be induced by α,β-unsaturated aldehydes, di-aldehydic compounds such as glyoxal or malondialdehyde, as well as by keto-aldehyde such as methylglyoxal [17]. Zucker rats undergoes a massive RCS-induced collagen crosslinks. In particular, Alderson et al. [9] reported a significant increase of malondialdehyde and HNE adducts to lysine (ALEs) in rat skin collagen of Zucker obese in respect to lean rats, beside to AGEs (pentosidine) and AGEs/ALEs such as Nɛ-(carboxymethyl)lysine and Nɛ-(carboxyethyl)lysine. In vitro experiments previously reported demonstrated the ability of CAR to quench all the different RCS inducing collagen crosslinks. Hipkiss first demonstrated the ability of CAR to react with electrophilic aldehydes and ketons and to inhibit protein crosslinking induced by a range of potential toxic aldehydes, including aldose and ketose sugars, trioses, malondialdehyde, acetaldehyde and formaldehyde, presumably acting as a sacrificial nucleophile [26, 59]. This would explain the ability of the CAR treatment in reducing collagen crosslinks in tail tendon and hence the remarkable anti-hypertensive effect. Furthermore, HNE promotes endothelial oxidative stress, nitric oxide release and metabolism impairment, leading to a reduced bioavailability of nitric oxide, resulting in increased vascular resistance [60, 61]. This situation is worsened in obese Zucker rats, because obesity markedly reduces renal nitric oxide synthase (NOS) activity (cortex and outer medulla), and cortical endothelial NOS (eNOS) expression [62]. In particular, HNE was found to inhibit eNOS by modifying endothelial guanosine triphosphate (GTP) cyclohydrolase I GTP cyclohydrolase 1 (GTPCH) and hsp90 resulting in tetrahydrobiopterin depletion and inhibition of phosphorylated eNOS-serine 1179. Also, HNE increased superoxide anion radical release thus inactivating released nitric oxide and inducing nitrosative damage [60]. The inhibitory effect of HNE on endothelial nitric oxide production is also mediated by a significant dimethylarginine dimethylaminohydrolase enzyme activity, leading to an increased bioavailability of nitric oxide synthase inhibitors [61, 63]. Hence, the antihypertensive effect could be also ascribed to the effect of CAR in maintaining nitric oxide release and metabolism by a direct HNE-quenching effect.
L- and D-CAR were found to significantly reduce hyperlipidaemia in Zucker rats. Up to now there are some convincing data reporting a causative link between oxidative/carbonylation with dyslipidaemia. In particular, Tamamizu-Kato et al. [64] found that ACR causes oxidative modification of apoE and tertiary conformational alteration and impairs the ability of apoE to interact with heparin and the LDL receptor. Furthermore, ACR modified apoE displayed a 5-fold decrease in its ability to interact with lipid surfaces. Hence ACR disrupts the key role of apoE in regulating plasma cholesterol and triglycerides levels. Beside ACR, also HNE has been shown to cause greater crosslinking of apoE [65]. Although we do not have any direct evidence of apoE carbonylation and dysfunction in Zucker rats, we can suggest that the effect of CAR on lipid content may be mediated by an increased detoxification of unsaturated aldehydes, which have been found to affect plasma cholesterol and triglycerides levels through apoE dysfunction.
Most of the pharmacological properties of CAR, including the anti-ischemic and anti-hypertensive activity, have been ascribed to a pro-histaminic effect [33, 66, 67]. To understand whether this mechanism can be involved in the pharmacological effects reported herein, an analogue of CAR, resistant to carnosinase and characterized by the same RCS sequestering effect of the parent compound has been designed and supplemented. Among several CAR derivatives designed to be resistant to carnosinase, D-carnosine (β-alanyl-D-histidine), the L-CAR enantiomer characterized by D-histidine instead of L-histidine was found to be stable to the enzymatic hydrolysis and characterized by a quenching reactivity towards α,β-unsaturated aldehydes superimposable to that of L-CAR. The bioavailability of L- and D-CAR was then compared in rats. D-CAR is less absorbed in respect to L-CAR, but being more metabolically stable it reaches an AUC value even higher in respect to that of L-CAR. D-CAR showed a protective effect in Zucker rats superimposable to that of L-CAR. Taken together, these data well indicate that the pharmacological action of L-CAR is not due to a pro-histaminic effect (D-CAR is not a pre-cursor of histidine since it is stable to peptidic hydrolysis), nor to a plausible receptor-mediated mechanism (L- and D-CAR have a different 3D arrangement of the key functional groups), but more likely to a RCS detoxyfication mechanism, which is a property common to both the two enantiomers.
Interestingly, it should be noted that the two well-known RCS-sequestering agents, pyridoxamine and CAR, although belonging to different chemical classes, posses a common RCS quenching mechanism and a similar effect in the Zucker model, thus strengthening the causal role of RCS in this animal model.
By considering the effect of L- and D-CAR in reducing the oxidative stress as measured by urinary isoprostanes, it could be suggested that besides a RCS sequestering mechanism, the protective effect of CAR is also partially mediated by a radical scavenging activity and/or transition metal chelating effect. Carnosine has been shown to inactivate ROS, scavenge free radicals and chelate prooxidant metals [68]. However, it has been recently reported that carnosine has a relatively lower binding constant with Cu(II) ions as compared to histidine, which seems to exclude a metal ion chelating mechanism [69]. Also, a mechanism based on a direct radical scavenging should be excluded. The real antioxidant/radical scavenging activity of CAR is controversial and in particular it has been suggested that CAR cannot be as effective in vivo as other antioxidants such as α-tocopherol [68]. To further exclude a radical scavenging/ antioxidant mechanism of CAR, it has been recently observed that a fortified antioxidant diet designed to incorporate direct radical scavenging antioxidants (vitamin E, ascorbic acid, β-carotene) and substances acting to fortify oxidative stress-reducing enzymes (selenium, zinc, copper, manganese) were ineffective in reducing arterial pressure, cholesterol, insulin resistance and nephropathy in male obese Zucker rats [70]. The in vivo antioxidant activity of CAR could be addressed to the RCS quenching activity and to the inhibition of AGE formation, a well-known pro-oxidant species. In fact, it is well known that RCS such as HNE act as a pro-oxidant by inducing the formation of ROS [71], peroxides and by depleting endogenous antioxidants such as GSH [72].
Hence, L-CAR, a diet component devoid of toxicity (2–2.5 mg carnosine/g of meat) represents a prototype of a RCS sequestering agent potentially effective for the treatment of metabolic syndrome-related diseases. However, great care should be taken to extrapolate these data to human studies. Firstly, it should be considered that the pharmacological effects reported in this study have been obtained using rodents which lack serum carnosinase, a specific dipeptidase present in human serum and mainly responsible for the plasma instability of carnosine (in rodents, the catalytical activity of carnosine mainly takes place in kidney where is located the tissue carnosinase). In vitro studies conducted in our laboratories confirmed the rapid disappearance of L-CAR in human serum within 5 min. and a significant stability in rat serum (no significant reduction within at least 6 hrs). However, to be effective in metabolic syndrome, CAR should quench RCS in blood and kidney, and hence should be metabolically stable in these locations. This happens in rodents but not in human beings. The metabolic instability of supplemented CAR was verified in human beings receiving 450 mg of CAR. No CAR was detected in serum specimens, already after 15 min. from the oral supplementation and for all the time-points considered (up to 300 min.), to indicate that it is rapidly hydrolysed in human serum by carnosinase [48]. Similar results have been obtained by Harris et al. [73]. D-CAR was used in this study as a tool to better understand the mechanism of CAR and in particular to exclude a pro-histamine and receptor-mediated mechanism. D-CAR was designed to be significantly stable to carnosinase, as confirmed in in vitro experiments, showing a significant stability in human serum. However, the drug likeness of D-CAR is significantly limited due to the reduced absorption in respect to L-CAR. This different behaviour could be explained by considering that CAR is readily absorbed intact, primarily in the jejunum by a carrier-mediated transport system. The uptake of CAR across the intestinal mucosa has been compared with the permeability of sugars. By contrast, D-CAR, is probably less recognized by transport carrier due to the inverted stereocenter. Hence D-CAR, although stable to carnosinase, has a limited drug-likeness due to the reduced intestinal absorption. We are currently focusing our efforts to design and develop L-CAR derivatives characterized by a selective quenching activity towards RCS, stable to carnosinase and characterized by a suitable bioavailability.
Acknowledgments
This work was supported by funds from the University of Milan (PUR 2007, 2008) MIUR (PRIN 2007) and from Regione Lombardia-MIUR (L.297 – Art. 12/BioTech DM27909). The authors are grateful to Jaclyn Michelle Winkel for English language corrections.
Conflict of interest
Dr. Gianpaolo Negrisoli is the General Manager of Flamma, a chemical company producing L-Carnosine.
References
- 1.Shaw DI, Hall WL, Williams CM. Metabolic syndrome: what is it and what are the implications? Proc Nutr Soc. 2005;64:349–57. doi: 10.1079/pns2005442. [DOI] [PubMed] [Google Scholar]
- 2.Haffner SM. The metabolic syndrome: inflammation, diabetes mellitus, and cardiovascular disease. Am J Cardiol. 2006;97:3A–11A. doi: 10.1016/j.amjcard.2005.11.010. [DOI] [PubMed] [Google Scholar]
- 3.Grundy SM. A constellation of complications: the metabolic syndrome. Clin Cornerstone. 2005;7:36–45. doi: 10.1016/s1098-3597(05)80066-3. [DOI] [PubMed] [Google Scholar]
- 4.Chen J, Muntner P, Hamm LL, et al. The metabolic syndrome and chronic kidney disease in U.S. adults. Ann Intern Med. 2004;140:167–74. doi: 10.7326/0003-4819-140-3-200402030-00007. [DOI] [PubMed] [Google Scholar]
- 5.Hansen BC. The metabolic syndrome X. Ann N Y Acad Sci. 1999;892:1–24. doi: 10.1111/j.1749-6632.1999.tb07782.x. [DOI] [PubMed] [Google Scholar]
- 6.Timar O, Sestier F, Levy E. Metabolic syndrome X: A review. Can J Cardiol. 2000;16:779–89. [PubMed] [Google Scholar]
- 7.Kasiske BL, O’Donnell MP, Keane WF. The Zucker rat model of obesity, insulin resistance, hyperlipidemia, and renal injury. Hypertension. 1992;19:I110–5. doi: 10.1161/01.hyp.19.1_suppl.i110. [DOI] [PubMed] [Google Scholar]
- 8.Stevenson FT, Kaysen GA. Hyperlipidemia and renal disease: The use of animal models in understanding pathophysiology and approaches to treatment. Wien Klin Wochenschr. 1999;111:307–14. [PubMed] [Google Scholar]
- 9.Alderson NL, Chachich ME, Youssef NN, et al. The AGE inhibitor pyridoxamine inhibits lipemia and development of renal and vascular disease in Zucker obese rats. Kidney Int. 2003;63:2123–33. doi: 10.1046/j.1523-1755.2003.00027.x. [DOI] [PubMed] [Google Scholar]
- 10.Dalle-Donne I, Aldini G, Carini M, et al. Protein carbonylation, cellular dysfunction, and disease progression. J Cell Mol Med. 2006;10:389–406. doi: 10.1111/j.1582-4934.2006.tb00407.x. [DOI] [PMC free article] [PubMed] [Google Scholar]
- 11.Rosen P, Osmers A. Oxidative stress in young Zucker rats with impaired glucose tolerance is diminished by acarbose. Horm Metab Res. 2006;38:575–86. doi: 10.1055/s-2006-950397. [DOI] [PubMed] [Google Scholar]
- 12.Dominguez JH, Wu P, Hawes JW, et al. Renal injury: similarities and differences in male and female rats with the metabolic syndrome. Kidney Int. 2006;69:1969–76. doi: 10.1038/sj.ki.5000406. [DOI] [PubMed] [Google Scholar]
- 13.Namikoshi T, Tomita N, Satoh M, et al. Olmesartan ameliorates renovascular injury and oxidative stress in Zucker obese rats enhanced by dietary protein. Am J Hypertens. 2007;20:1085–91. doi: 10.1016/j.amjhyper.2007.05.007. [DOI] [PubMed] [Google Scholar]
- 14.Orioli M, Aldini G, Benfatto MC, et al. HNE Michael adducts to histidine and histidine-containing peptides as biomarkers of lipid-derived carbonyl stress in urines: LC-MS/MS profiling in Zucker obese rats. Anal Chem. 2007;79:9174–84. doi: 10.1021/ac7016184. [DOI] [PubMed] [Google Scholar]
- 15.Orioli M, Aldini G, Beretta G, et al. LC-ESI-MS/MS determination of 4-hydroxy-trans-2-nonenal Michael adducts with cysteine and histidine-containing peptides as early markers of oxidative stress in excitable tissues. J Chromatogr B. 2005;827:109–18. doi: 10.1016/j.jchromb.2005.04.025. [DOI] [PubMed] [Google Scholar]
- 16.Aldini G, Dalle-Donne I, Milzani A, et al. Advanced lipoxidation end-products as potential drug targets in preventing protein carbonylation and related cellular dysfunction. Chem Med Chem. 2006;1:1045–58. doi: 10.1002/cmdc.200600075. [DOI] [PubMed] [Google Scholar]
- 17.Aldini G, Dalle-Donne I, Maffei Facino R, et al. Intervention strategies to inhibit protein carbonylation by lipoxidation-derived reactive carbonyls. Med Res Rev. 2007;6:817–68. doi: 10.1002/med.20073. [DOI] [PubMed] [Google Scholar]
- 18.Aldini G, Carini M, Beretta G, et al. Carnosine is a quencher of 4-hydroxy-nonenal: through what mechanism of reaction? Biochem Biophys Res Commun. 2002;298:699–706. doi: 10.1016/s0006-291x(02)02545-7. [DOI] [PubMed] [Google Scholar]
- 19.Aldini G, Granata P, Carini M. Detoxification of cytotoxic α,β-unsaturated aldehydes by carnosine: characterization of conjugated adducts by electrospray ionization tandem mass spectrometry and detection by liquid chromatography/mass spectrometry in rat skeletal muscle. J Mass Spectrom. 2002;37:1219–28. doi: 10.1002/jms.381. [DOI] [PubMed] [Google Scholar]
- 20.Carini M, Aldini G, Beretta G, et al. Acrolein-sequestering ability of endogenous dipeptides: characterization of carnosine and homocarnosine/acrolein adducts by electrospray ionization tandem mass spectrometry. J Mass Spectrom. 2003;38:996–1006. doi: 10.1002/jms.517. [DOI] [PubMed] [Google Scholar]
- 21.Aldini G, Maffei Facino R, Beretta G, et al. Carnosine and related dipeptides as quencher of reactive carbonyl species: from structural studies to therapeutic intervention. Biofactors. 2005;24:77–87. doi: 10.1002/biof.5520240109. [DOI] [PubMed] [Google Scholar]
- 22.Hipkiss AR. Glycation, ageing and carnosine: are carnivorous diets beneficial? Mech Ageing Dev. 2005;126:1034–9. doi: 10.1016/j.mad.2005.05.002. [DOI] [PubMed] [Google Scholar]
- 23.Janssen B, Hohenadel D, Brinkkoetter P, et al. Carnosine as a protective factor in diabetic nephropathy. Diabetes. 2005;54:2320–7. doi: 10.2337/diabetes.54.8.2320. [DOI] [PubMed] [Google Scholar]
- 24.Freedman BI, Hicks PJ, Sale MM, et al. A leucine repeat in the carnosinase gene CNDP1 is associated with diabetic end-stage renal disease in European Americans. Nephrol Dial Transplant. 2007;22:1131–5. doi: 10.1093/ndt/gfl717. [DOI] [PubMed] [Google Scholar]
- 25.Gallant S, Semyonova M, Yuneva M. Carnosine as a potential anti-senescence drug. Biochemistry. 2000;65:866–8. [PubMed] [Google Scholar]
- 26.Hipkiss AR, Brownson C, Carrier MJ. Carnosine, the anti-ageing, anti-oxidant dipeptide, may react with protein carbonyl groups. Mech Ageing Dev. 2001;122:1431–45. doi: 10.1016/s0047-6374(01)00272-x. [DOI] [PubMed] [Google Scholar]
- 27.Lee Y, Hsu C, Lin M, et al. Histidine and carnosine delay diabetic deterioration in mice and protect human low density lipoprotein against oxidation and glycation. Eur J Pharmacol. 2005;513:145–50. doi: 10.1016/j.ejphar.2005.02.010. [DOI] [PubMed] [Google Scholar]
- 28.Stvolinsky SL, Dobrota D. Anti-ischemic activity of carnosine. Biochemistry (Mosc) 2000;65:849–55. [PubMed] [Google Scholar]
- 29.Stvolinsky S, Kukley M, Dobrota D, et al. Carnosine protects rats under global ischemia. Brain Res Bull. 2000;53:445–8. doi: 10.1016/s0361-9230(00)00366-x. [DOI] [PubMed] [Google Scholar]
- 30.Dobrota D, Fedorova T, Stvolinsky S, et al. Carnosine protects the brain of rats and Mongolian gerbils against ischemic injury: after-stroke-effect. Neurochem Res. 2005;30:1283–8. doi: 10.1007/s11064-005-8799-7. [DOI] [PubMed] [Google Scholar]
- 31.Fujii T, Takaoka M, Tsuruoka N, et al. Dietary supplementation of L-carnosine prevents ischemia/reperfusion-induced renal injury in rats. Biol Pharm Bull. 2005;28:361–3. doi: 10.1248/bpb.28.361. [DOI] [PubMed] [Google Scholar]
- 32.Cuzzocrea S, Genovese T, Failla M, et al. Protective effect of orally administered carnosine on bleomycin-induced lung injury. J Physiol Lung Cell Mol Physiol. 2007;292:L1095–104. doi: 10.1152/ajplung.00283.2006. [DOI] [PubMed] [Google Scholar]
- 33.Kurata H, Fujii T, Tsutsui H, et al. Renoprotective effects of l-carnosine on ischemia/reperfusion-induced renal injury in rats. J Pharmacol Exp Ther. 2006;319:640–7. doi: 10.1124/jpet.106.110122. [DOI] [PubMed] [Google Scholar]
- 34.Vistoli G, Pedretti A, Cattaneo M, et al. Homology modeling of human serum carnosinase, a potential medicinal target, and MD simulations of its allosteric activation by citrate. Med Chem. 2006;49:3269–77. doi: 10.1021/jm0602099. [DOI] [PubMed] [Google Scholar]
- 35.Buñag RD. Blood pressure measurement in rats. In: Garten D, De Jong W, editors. Experimental and genetic models of hypertension. Handbook of Hypertension. Amsterdam: Elsevier; 1994. pp. 1–17. [Google Scholar]
- 36.Rivera L, Morón R, Sánchez M, et al. Quercetin ameliorates metabolic syndrome and improves the inflammatory status in obese Zucker rats. Obesity. 2008;16:2081–7. doi: 10.1038/oby.2008.315. [DOI] [PubMed] [Google Scholar]
- 37.Dillard CJ, Tappel AL, Fletcher BL. Measurement of fluorescent lipid peroxidation products in biological system and tissues. Anal Biochem. 1973;52:1–9. doi: 10.1016/0003-2697(73)90327-8. [DOI] [PubMed] [Google Scholar]
- 38.Kirschbaum B. Correlative studies of urine fluorescence and free radical indicators. Clin Nephrol. 2002;58:344–9. doi: 10.5414/cnp58344. [DOI] [PubMed] [Google Scholar]
- 39.Toblli JE, Derosa G, Cao G, et al. ACE inhibitor and angiotensin type I receptor antagonist in combination reduce renal damage in obese Zucker rats. Kidney Int. 2004;65:2343–59. doi: 10.1111/j.1523-1755.2004.00661.x. [DOI] [PubMed] [Google Scholar]
- 40.Marquez B, Zouvani I, Karagrigoriu A, et al. A simplified method for measuring the thickness of glomerular basement membranes. Ultrastruct Pathol. 2003;27:409–16. [PubMed] [Google Scholar]
- 41.Reznick AZ, Packer L. Oxidative damage to proteins: spectrophotometric method for carbonyl assay. Methods Enzymol. 1994;233:357–63. doi: 10.1016/s0076-6879(94)33041-7. [DOI] [PubMed] [Google Scholar]
- 42.Allain CC, Ponn LS, Chan CSG, et al. Enzymatic determination of total serum cholesterol. Clin Chem. 1974;20:470–5. [PubMed] [Google Scholar]
- 43.Yang S, Litchfield JE, Baynes JW. AGE-breakers cleave model compounds, but do not break Maillard crosslinks in skin and tail collagen from diabetic rats. Arch Biochem Biophys. 2003;412:42–6. doi: 10.1016/s0003-9861(03)00015-8. [DOI] [PubMed] [Google Scholar]
- 44.Reddy GK, Enwemeka CS. A simplified method for the analysis of hydroxyproline in biological tissues. Clin Biochem. 1996;29:225–9. doi: 10.1016/0009-9120(96)00003-6. [DOI] [PubMed] [Google Scholar]
- 45.Stegemann H, Stalder K. Determination of hydroxyproline. Clin Chim Acta. 1967;18:267–73. doi: 10.1016/0009-8981(67)90167-2. [DOI] [PubMed] [Google Scholar]
- 46.Stefek M, Gajdosik A, Gajdosikova A, et al. p-Dimethylamino-benzaldehyde-reactive substances in tail tendon collagen of streptozotocin-diabetic rats: temporal relation to biomechanical properties and advanced glycation endproduct (AGE)-related fluorescence. Biochim Biophys Acta. 2000;1502:398–404. doi: 10.1016/s0925-4439(00)00064-8. [DOI] [PubMed] [Google Scholar]
- 47.Hamlin CR, Kohn RR. Evidence for progressive, age-related structural changes in post-mature human collagen. Biochim Biophys Acta. 1971;236:458–67. doi: 10.1016/0005-2795(71)90226-1. [DOI] [PubMed] [Google Scholar]
- 48.Yeum KJ, Orioli M, Regazzoni L, et al. Profiling histidine dipeptides in plasma and urine after ingesting beef, chicken or chicken broth in humans. Amino Acids. 2009 doi: 10.1007/s00726-009-0291-2. 10.1007/s00726-009-0291-2. [DOI] [PubMed] [Google Scholar]
- 49.Maddox DA, Alavy FK, Silbernick EM, et al. Protective effects of a soy diet in preventing obesity-linked renal disease. Kidney Int. 2002;61:96–104. doi: 10.1046/j.1523-1755.2002.00091.x. [DOI] [PubMed] [Google Scholar]
- 50.Zhou S, Dickinson LC, Yang L, et al. Identification of hydrazine in commercial preparations of carnosine and its influence on carnosine’s antioxidative properties. Anal Biochem. 1998;261:79–86. doi: 10.1006/abio.1998.2724. [DOI] [PubMed] [Google Scholar]
- 51.Wang Z, Jiang T, Li J, et al. Regulation of renal lipid metabolism, lipid accumulation, and glomerulosclerosis in FVBdb/db mice with type 2 diabetes. Diabetes. 2005;54:2328–35. doi: 10.2337/diabetes.54.8.2328. [DOI] [PubMed] [Google Scholar]
- 52.Coimbra TM, Janssen U, Grone HJ, et al. Early events leading to renal injury in obese Zucker (fatty) rats with type II diabetes. Kidney Int. 2000;57:167–82. doi: 10.1046/j.1523-1755.2000.00836.x. [DOI] [PubMed] [Google Scholar]
- 53.Tomas O, Forbes JM, MacIsaac R, et al. Low–molecular weight advanced glycation end products: markers of tissue AGE accumulation and more? Ann NY Acad Sci. 2005;1043:644–54. doi: 10.1196/annals.1333.073. [DOI] [PubMed] [Google Scholar]
- 54.Hidalgo FJ, Alaiz M, Zamora R. A spectrophotometric method for the determination of proteins damaged by oxidized lipids. Anal Biochem. 1998;262:129–36. doi: 10.1006/abio.1998.2758. [DOI] [PubMed] [Google Scholar]
- 55.Wang X, Chang T, Jiang B, et al. Attenuation of hypertension development by aminoguanidine in spontaneously hypertensive rats: role of methylglyoxal. Am J Hypertens. 2007;20:629–36. doi: 10.1016/j.amjhyper.2006.12.003. [DOI] [PubMed] [Google Scholar]
- 56.Chang T, Wu L. Methylglyoxal, oxidative stress, and hypertension. Can J Physiol Pharmacol. 2006;84:1229–38. doi: 10.1139/y06-077. [DOI] [PubMed] [Google Scholar]
- 57.Zieman SJ, Kass DA. Advanced glycation end product cross-linking: pathophysiologic role and therapeutic target in cardiovascular disease. Congest Heart Fail. 2004;10:144–51. doi: 10.1111/j.1527-5299.2004.03223.x. [DOI] [PubMed] [Google Scholar]
- 58.Zieman SJ, Kass DA. Advanced glycation endproduct crosslinking in the cardiovascular system: potential therapeutic target for cardiovascular disease. Drugs. 2004;64:459–70. doi: 10.2165/00003495-200464050-00001. [DOI] [PubMed] [Google Scholar]
- 59.Hipkiss AR, Preston JE, Himsworth DT, et al. Pluripotent protective effects of carnosine, a naturally occurring dipeptide. Ann NY Acad Sci. 1998;854:37–53. doi: 10.1111/j.1749-6632.1998.tb09890.x. [DOI] [PubMed] [Google Scholar]
- 60.Whitsett J, Picklo MJ, Sr, Vasquez-Vivar J. 4-Hydroxy-2-nonenal increases superoxide anion radical in endothelial cells via stimulated GTP cyclohydrolase proteasomal degradation. Arterioscler Thromb Vasc Biol. 2007;27:2340–7. doi: 10.1161/ATVBAHA.107.153742. [DOI] [PubMed] [Google Scholar]
- 61.Pope AJ, Druhan L, Guzman JE, et al. Role of DDAH-1 in lipid peroxidation product-mediated inhibition of endothelial NO generation. Am J Physiol Cell Physiol. 2007;293:C1679–86. doi: 10.1152/ajpcell.00224.2007. [DOI] [PubMed] [Google Scholar]
- 62.Riazi S, Madala-Halagappa VK, Dantas AP, et al. Sex differences in renal nitric oxide synthase, NAD(P)H oxidase, and blood pressure in obese Zucker rats. Gend Med. 2007;4:214–29. doi: 10.1016/s1550-8579(07)80042-8. [DOI] [PubMed] [Google Scholar]
- 63.Forbes SP, Druhan LJ, Guzman JE, et al. Mechanism of 4-HNE mediated inhibition of hDDAH-1: implications in no regulation. Biochemistry. 2008;47:1819–26. doi: 10.1021/bi701659n. [DOI] [PubMed] [Google Scholar]
- 64.Tamamizu-Kato S, Wong JY, Jairam V, et al. Modification by acrolein, a component of tobacco smoke and age-related oxidative stress, mediates functional impairment of human apolipoprotein. Biochemistry. 2007;46:8392–400. doi: 10.1021/bi700289k. [DOI] [PMC free article] [PubMed] [Google Scholar]
- 65.Montine TJ, Huang DY, Valentine WM, et al. Crosslinking of apolipoprotein E by products of lipid peroxidation. J Neuropathol Exp Neurol. 1996;55:202–10. doi: 10.1097/00005072-199602000-00009. [DOI] [PubMed] [Google Scholar]
- 66.Shen J, Yao JF, Tanida M, et al. Regulation of sympathetic nerve activity by L-carnosine in mammalian white adipose tissue. Neurosci Lett. 2008;441:100–4. doi: 10.1016/j.neulet.2008.06.027. [DOI] [PubMed] [Google Scholar]
- 67.Tanida M, Niijima A, Fukuda Y, et al. Dose-dependent effects of L-carnosine on the renal sympathetic nerve and blood pressure in urethane-anesthetized rats. Am J Physiol Regul Integr Comp Physiol. 2005;288:R447–55. doi: 10.1152/ajpregu.00275.2004. [DOI] [PubMed] [Google Scholar]
- 68.Decker EA, Livisay SA, Zhou S. A re-evaluation of the antioxidant activity of purified carnosine. Biochemistry. 2000;65:766–70. [PubMed] [Google Scholar]
- 69.Velez S, Nair NG, Reddy VP. Transition metal ion binding studies of carnosine and histidine: biologically relevant antioxidants. Colloids Surf B Biointerfaces. 2008;66:291–4. doi: 10.1016/j.colsurfb.2008.06.012. [DOI] [PubMed] [Google Scholar]
- 70.Slyvka Y, Inman SR, Malgor R, et al. Protective effects of antioxidant-fortified diet on renal function and metabolic profile in obese Zucker rat. Endocrine. 2009;35:89–100. doi: 10.1007/s12020-008-9121-7. [DOI] [PMC free article] [PubMed] [Google Scholar]
- 71.Nakamura K, Miura D, Kusano KF, et al. 4-Hydroxy-2-nonenal induces calcium overload via the generation of reactive oxygen species in isolated rat cardiac myocytes. J Card Fail. 2009;15:709–16. doi: 10.1016/j.cardfail.2009.04.008. [DOI] [PubMed] [Google Scholar]
- 72.Uchida K, Shiraishi M, Naito Y, et al. Activation of stress signaling pathways by the end product of lipid peroxidation. 4-hydroxy-2-nonenal is a potential inducer of intracellular peroxide production. J Biol Chem. 1999;274:2234–42. doi: 10.1074/jbc.274.4.2234. [DOI] [PubMed] [Google Scholar]
- 73.Harris RC, Tallon MJ, Dunnett M, et al. The absorption of orally supplied b-alanine and its effect on muscle carnosine synthesis in human vastus lateralis. Amino Acids. 2006;30:279–89. doi: 10.1007/s00726-006-0299-9. [DOI] [PubMed] [Google Scholar]