Abstract
Monitoring the degree of anaerobic respiration of cells in high density microscale culture systems is an enabling key technology and essential for cell-based biosensors. We have fabricated and incorporated miniature amperometric lactate sensing electrodes with working areas from 3 to 5×10⁻² mm2 into a microfluidic-based microscale cell culture system to measure the lactate production rate of fibroblasts in nanoliter volumes. Planar thin film platinum electrode arrays on glass substrates were spin coated with lactate oxidase and a protective Nafion layer. The lactate electrodes had a high enzymatic activity described by a Michaelis-Menten constant of 2.6±0.1 mM, a linear response in the range 0.01÷2.5mM and a sensitivity of 7.3×10⁻²mA/mM·cm2. A replica-molded polydimethylsiloxane (PDMS) microfluidic device with nanoliter sensing volumes was aligned and sealed to a glass substrate with the sensing electrodes. We trapped fibroblasts in the cell culture volume and measured the lactate production rate using a stop and flow protocol. The average lactate production rate was 0.011±0.0049mM/min. The lactate production was suppressed with the addition of 2-deoxy-D-glucose, which binds to hexokinase. The blocking of hexokinase prevents the generation of pyruvate, the intermittent substrate required for lactate production even in the presence of glucose.
Keywords: lactate sensor, lactate oxidase, spin coating deposition, microfluidic device, fibroblast cells
1. Introduction
Microfluidic-based microscale cell culture systems have the potential to support high throughput drug screening efforts (Robitzki et al., 2008), environmental monitoring or toxin detection (Curtis et al., 2009; Joshi et al., 2009) or the study of complex cell biology, which requires the precise control of the cellular microenvironment (El-Ali et al., 2006; Griffith et al., 2006). Adding analytical sensing capabilities to these microdevices allows for increased sensitivity and fast detection capabilities at low cost, leading to the concept of cell-based biosensors for toxin or pathogen detection (DeBusschere et al., 2001; Werdich et al., 2004). Many metabolic toxins interfere with the tricarboxylic acid (TCA) cycle and increase the degree of anaerobic respiration. In anaerobic conditions the cells produce lactate instead of pyruvate, which enters the TCA cycle in the mitochondrion. An increase in lactate is therefore an indication of toxin exposure or a shortage of oxygen supply. For example, it occurs in conditions such as myocardial ischemia or congestive heart failure. Monitoring lactate production rates is also vital for many bioprocessing applications; for example, an increase in lactate concentrations inhibits cell growth and antibody formation in hybridoma cells (Ozturk et al., 1992).
Lactate concentrations can be quantified using optical (Wu et al., 2007) or electrochemical (Cheng et al., 2008; Kurita et al., 2002; Romero et al., 2008; Shkotova et al., 2008; Tsai et al., 2007)-based detection schemes. Optical detection of lactate requires mixing with reagents and subsequently measuring optical absorbance is relatively slow, leading to relatively long response times. Enzyme-modified microelectrodes, on the other hand, provide high temporal resolution, can be miniaturized and directly incorporated into micro-cell culture chambers (Ges et al., 2010). Lactate biosensors are typically based on the immobilization of two enzymes, either lactate dehydrogenase (Cheng et al., 2008; Ma et al., 2008; Rahman et al., 2009) or lactate oxidase (LOx) (Huang et al., 2008; Romero et al., 2008; Schuvailo et al., 2006; Sung et al., 2006) on electrodes. LOx-based biosensors contain a natural cofactor flavin adenine dinucleotide (FAD), have a high selectivity and sensitivity and a wide range of linear response, are fast and can operate at room temperatures (Shkotova et al., 2008).
In this paper, we report the fabrication and characteristics of a LOx-coated platinum microelectrode array and the integration of the lactate sensor in nL cell culture systems to measure lactate production rates of fibroblasts in a stop flow configuration. A cell-based biosensor concept could be demonstrated by exposing the cells to 2-deoxy-D-glucose (doDg).
2. Materials and reagent
Polydimethylsiloxane (PDMS) elastomer composed of prepolymer and curing agent (Sylgard 184 kit, Dow Corning, Midland, MI) was purchased from Essex Chemical. Titanium (99.95%, rod diam. 2mm), and platinum (99.95%, rod diam. 2mm) were purchased from Goodfellow Corp. Fisherbrand ® (Fisher Scientific) microscope glass slides (75×25×1mm) were used as substrates for the lactate sensors. L-(+)–Lactic acid was purchased from Fisher Scientific, Nafion® (perfluorosulfonic acid-PTFE copolymer, 5% w/w solution) from Alfa Aesar; universal pH buffers were used (buffers for pH 7 and 7.4) from VWR Scientific, PA; H2SO4 and NaOH from EM Science. Triton X-100 was purchased from Acros, 2-DEOXY-D–Glucose, bovine serum albumin (BSA, fraction V, 96%), 25% solution of glutaraldehyde in water were purchased from Sigma. 1mM PBS (phosphate buffered saline) was prepared from HQ® Phosphate Buffered Saline from HyClone (South Logan, UT). LOx (38u/mg) was purchased from Genzyme Diagnostics, Framingham, MA. The salts used for the Tyrode’s solution (potassium chloride, sodium chloride, magnesium chloride, sodium phosphate, sodium bicarbonate) were supplied by Fisher Scientific. All materials were used as received unless otherwise specified.
3. Instrumentation
A spin processor WS-400B-6NPP-Lite with a digital process controller (Laurell Technologies Corp., North Wales, PA) was used for the deposition of the two lactate sensor layers, LOx solution and Nafion. A surface profiler (Alphastep 200, Tencor Instruments) was used to measure the thickness of the photoresist, LOx and Nafion layers.
Electrochemical experiments were performed with a potentiostat from CH Instruments (Austin, TX). A three-electrode configuration was used for calibration of the lactate sensors and lactate production measurements from fibroblast cells. The counter electrode was either a Pt wire in beaker experiments or a thin Pt film in microfluidic devices. In all experiments a Dri-Ref-450 from WPI, Inc. was used as a reference electrode (diameter 0.45mm).
Thin film Ti-Pt electrodes were fabricated on microscope glass substrates using e-beam vacuum evaporation (Inotec Corp.) of titanium and platinum from carbon crucible liners (Kurt J. Lesker Company). An inverted microscope (AXIOVERT 25CFL, Carl Zeiss, Germany) in combination with a color CCD camera (KP-D20BU, Hitachi, Japan) was used to image the microfluidic device. The fluidic flow was controlled and maintained using a microsyringe pump controller MICRO-4 (WPI, Sarasota, FL) for flow rates ranging from 0.1 to 30nl/s.
4. Cells
Mice fibroblast cells (#CRL-10225) were obtained from the American Type Culture Collection (ATCC, Rockville, MD). Cells were maintained in Dulbecco Modified Eagle Medium (DMEM) supplemented with 10% fetal bovine serum, 1mM sodium pyruvate, 50mg/ml gentamicin and 0.25μg/ml Amphotericin B. Cells were grown in 100mm dishes to 75–80% confluence. Cells were washed with DPBS to resuspend and incubated with 1ml standard trypsin EDTA solution (0.25% trypsin, 1mM EDTA) for 10–15min at room temperature. Trypsin was inactivated by adding 1.5ml soybean trypsin inhibitor. The suspension was filtered through an 11μm nylon filter (Millipore) and centrifugated for 10min at 1000rpm. Before use, the cell pellet was washed and resuspended in Tyrode’s solution.
5. Experimental
The microfluidic cell culture device to measure lactate production from fibroblast cells in nanoliter volumes was made following these steps: i) fabrication of the thin film Pt-microelectrode array; ii) spin coating of the lactate sensor components on specific electrodes; iii) replica molding of the microfluidic device with 2nL cell culture volumes. Fig. 1 shows the schematic overview of the microelectrode array with the lactate sensors and the microfluidic channel network. In the next section we describe each of these processes in detail.
Figure 1.
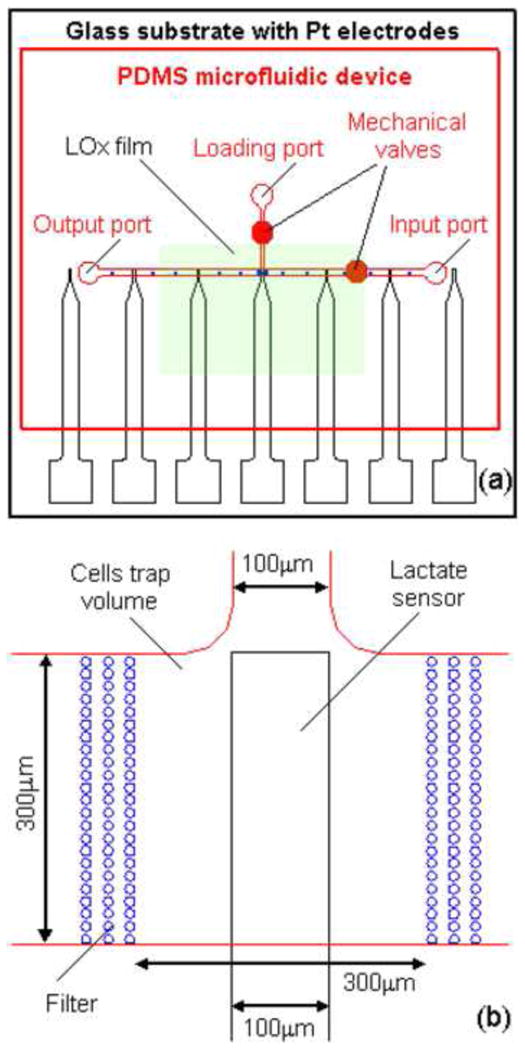
Schematic overview of a microfluidic device to measure lactate production from fibroblast cells in nanoliter volume. (a) Red – PDMS microfluidic device with channel network; black – glass substrate with microelectrode array; green – spin-coated lactate sensitive (LOx) film. (b) Enlarged view of lactate sensitive electrode in the cell culture volume (CCV). The CCV is ~2nL (300×300×20μm3), the lactate sensitive electrode is 100×300μm2, and the diameter of the filter posts is 3μm.
5.1. Thin film conducting electrodes
The thin film conductive electrodes were fabricated on microscope glass slides, which were cut into sections of 25×25mm2. The microelectrodes consist of two layers: a Ti adhesive layer (100Å) and a Pt layer (900Å). The deposition of the metal layer was described previously (Ges et al., 2005; Ges et al., 2008). The microelectrode arrays were patterned using standard photolithography with a 1μm-thick photoresist (NR7-1000P, Futurrex, Inc.). The unprotected Ti–Pt film was removed by ion beam etching. Finally, the electrodes were cleaned with isopropyl alcohol and electrochemically cleaned by cycling the potential between −0.3 and +1.2V versus Ag/AgCl in 0.5M H2SO4 until a steady-state voltammogram was obtained. A schematic of the electrode array is shown in Fig. 1a. Three to five central electrodes with sensing areas of 100×500 and 50×500μm2 were functionalized to measure lactate concentrations as described below. The lateral bare Pt electrodes were used as counter electrodes.
5.2. Lactate electrode fabrication
The enzyme solution for the lactate electrodes was prepared according to the protocol published by S. Eklund (Eklund et al., 2004). In our protocol, the LOx film solution was prepared by dissolving 5mg LOx and 100mg of BSA in 1000μL of 1mM PBS containing 0.02% v/v Triton X-100. After the BSA and LOx were completely dissolved, 60μL of 2.5% glutaraldehyde solution was added and thoroughly vortexed for 3–5min. After 2 hours (homogenization time) the enzyme solution was ready for deposition. For each lactate oxidase film deposition run we prepared fresh enzyme solution.
The enzyme solution was deposited by spin coating on freshly cleaned platinum microelectrode arrays. The enzyme solution (0.1–0.15mL) was added onto the substrate with a pipette. The substrates were spin coated at 1200rpm for 30s using a commercial spin coater (Laurell Model WS-400A-6TFM/LITE). The final thickness of the LOx films was typically between 0.45 and 0.55μm. The LOx films were dried at room temperature for 1 hour before coating them with a protective Nafion layer. As demonstrated by Koudelka (Koudelka et al., 1989) Nafion layers provide a selective permeability for lactate and oxygen. The authors investigated the interference for substances present in the interstitial fluid and found a typical suppression of three orders of magnitude due to the combined selectivity of Nafion and LOx. We have chosen Nafion to improve long-term stability and to prevent biofouling although our cell culture media is less complex and does not contain any of these interferents. For spin coating, we diluted a 5% Nafion solution with 9 parts of ethanol and used the following conditions: spin speed=1000rpm, acceleration=300rpm/s and spin time=30s. Under these conditions we obtained a transparent Nafion film with a thickness of ~0.04–0.06μm.
To characterize the lactate biosensors, we covered the surface of the electrodes, except for the working area (100×500μm2), with a thin PDMS film (~100μm in thickness). Biosensor devices were stored at room temperature before use.
5.3. PDMS microfluidic network
The microfluidic network was fabricated from PDMS by replica molding, using photoresist on a silicon wafer as a master as described previously (Ges et al., 2007). After curing, the elastomer was mechanically separated from the master and cut into discrete devices. Access holes for the fluidic connections were punched into the PDMS using sharpened blunt-tip 18 gauge needles.
The PDMS microfluidic device was manually aligned relative to the lactate sensitive electrodes (Fig. 1) using a stereo microscope. The PDMS device was sealed to the glass substrate by auto-adhesion, and stabilized with a mechanical clamp. Glass capillaries were inserted into the access holes to connect the microfluidic channels to syringes using standard microtubing (0.5mm inner diameter, Cole Parmer). Microsyringe pumps (“Micro 4,” WPI, Sarasota, FL) were used to control the flow of solution during the calibration of the lactate sensors in the microfluidic devices.
We developed miniature mechanical screw valves for precise control of the flow in microfluidic devices, as described in detail formerly (Ges et al., 2008). Our design allowed us to place two valves in close proximity to the cell culture volume (Fig. 1a). The valves were fabricated by drilling a pocket hole above the microfluidic channel into the PDMS. Into the pocket hole we inserted an oversized threaded sleeve and a screw which allowed us to compress the PDMS to pinch off the microfluidic channel beneath the screw.
5.4. NanoPhysiometer assembly
Fig. 1 shows the layout of the microfluidic device and the overlaid lactate electrodes. In our experiments, we used a T - configuration of microfluidic channels with input, output and loading ports. Two mechanical valves were created over the loading and input channels to control the flow during lactate production measurements. Cells were loaded into the cell culture volume (CCV) by applying a vacuum at the output port. The cells were confined by two filters with three rows of posts (Fig. 1b). The diameter of the posts and the distance between rows was 10μm and 3μm, respectively. The volume of CCV was ~ 2nL (300×300×20μm3).
The electrode array consists of seven independent electrodes; the three central ones were used as lactate sensors and the remaining as counter electrodes (bare Pt). Usually the central electrode was positioned in the CCV (Fig. 1b). Such electrode design could be used to measure the lactate concentration differentially in the input and output of the CCV. We used two types of lactate sensitive electrodes with a size of 100×500 and 50×500μm2. The distance between the electrodes was 2.5mm.
6. Results and discussion
6.1 Fabrication and characterization of lactate microelectrodes
Enzyme biosensors have been used for real-time monitoring of the metabolic activity of cells. For example, Eklund (Eklund et al., 2004) used a functionalized platinum-coated wire electrode with a working area of ~0.8mm2 to measure the lactate production rate of ~ 3×10⁵ fibroblasts or CHO in 4μL volumes. In order to scale down the number of cells and the measurement volume by 3 orders of magnitude, we need to reduce the working area of the lactate sensor to approximately 0.03mm2. Conventional drop deposition cannot be used because it is practically impossible to control and reach a uniform film thickness of the enzyme coating.
LOx catalyzes the conversion of lactate to pyruvate and hydrogen peroxide according to the following reactions (Romero et al., 2008):
Then, the hydrogen peroxide is oxidized at the Pt - electrode surface according to:
Amperometry is used to determine the concentration by measuring the current between the working and the counter electrode.
Based on our experience with miniaturizing glucose sensors for microfluidic devices, (Ges et al., 2010) we used a similar approach for the deposition protocol of LOx functionalized electrodes. Briefly, the protocol consists of the following steps: a) cleaning the Pt electrodes in a clean room; b) spin coating of LOx on the Pt microelectrodes; c) drying at RT for 30min; d) spin coating of a protective polymer membrane (Nafion film) onto the LOx-coated electrodes; e) drying of the Nafion film at RT for 20min. We measured the uniformity of LOx film thickness and found thickness variations of 3% measured over the entire substrate surface of 24×24mm2 using a standard profilometer.
The thickness of the LOx and Nafion films has a strong influence on the performance characteristics (sensitivity, stability, response time) of the lactate sensor. We optimized the sensor characteristics using different combinations of LOx and Nafion film thicknesses and found an optimum at a film thickness combination of 0.4 ÷ 0.6μm for LOx and 0.04 ÷ 0.05μm for Nafion.
We investigated the properties of spin-coated lactate sensors in Tyrode’s solution and compared them with the characteristics in standard phosphate buffer solution (PBS, pH7). The sensitivity of the lactate electrodes was first evaluated in a glass beaker with 25 mL of buffer solution. A commercial DRI-Ref-450 (diam. 0.45mm) was used as a reference electrode and a Pt wire (diam. 0.5mm) or bare on-chip Pt microelectrode was used as the counter electrode. Electrochemical measurements of lactate concentrations were performed in a three-electrode configuration. The lactate electrodes were set at a potential of +0.6V versus the Ag/AgCl reference electrode to oxidize hydrogen peroxide. A calibration of a typical lactate sensor was obtained by successively adding a fixed amount of stock lactate solution and is shown in Fig. 2a. The response of a lactate electrode was relatively fast and resulted in a stable plateau after the addition of stock solution. Calibration curves for four lactate sensors are presented in Fig. 2b. The sensitivities of the miniature electrodes were typically 20±4nA/mM. In comparison to electrochemically deposited lactate electrodes by (Ciobanu et al., 2008), our spin-coated electrodes had identical sensitivities in PBS and Tyrode’s solution.
Figure 2.
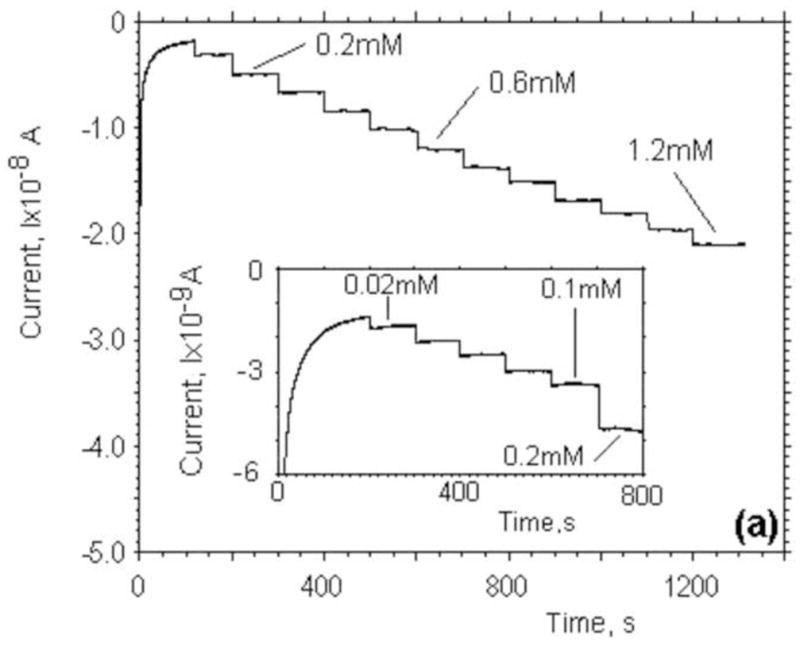
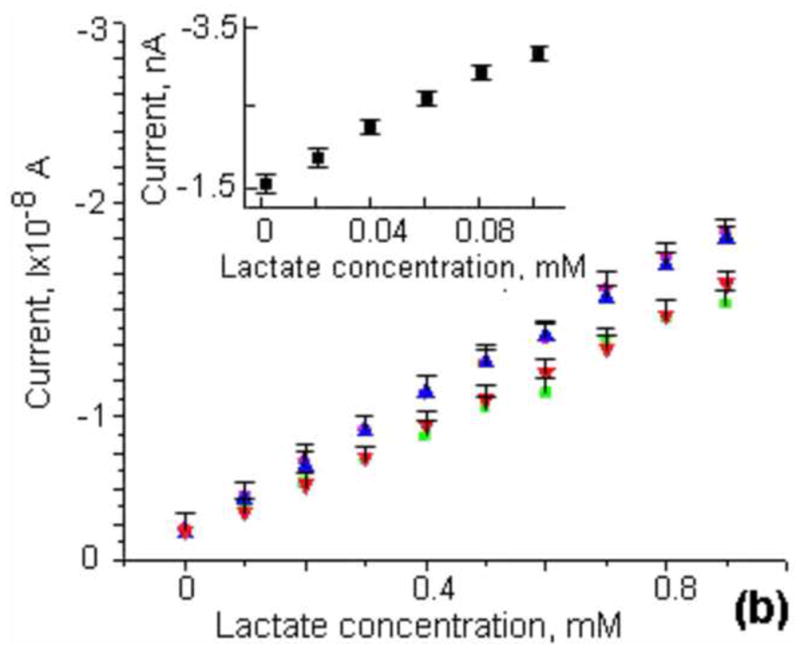
(a) Current-time curves recorded during calibration of our lactate sensors through the successive addition of 0.1mM lactate in Tyrode’s solution. The inset shows a calibration curve for small lactate concentrations (0–0.1mM) through the addition of 0.02mM. (b) Current as a function of lactate concentration for four different lactate sensors in Tyrode’s solution. The inset shows a calibration curve for small lactate concentrations in the range of 0–0.1mM.
Since there is no lactate in solution and we expect the lactate production of fibroblasts to be small, we evaluated the response of the lactate electrodes at low concentrations. The inserts in Fig. 2a and Fig. 2b show the result of a calibration in the range of 0–0.1mM of lactate. In this regime, the response is linear and the sensitivity is 7.3×10⁻²mA/mM·cm2. The limit of detection based on the three standard deviation criteria is estimated to be 3.5 μM. The current went into saturation at high lactate concentration (>3 mM, for Tyrod’s solutions), demonstrating Michaelis-Menten kinetics. The apparent Michaelis-Menten constant (K’M) can be determined using a Lineweaver-Burk plot (Lin et al., 2007). K’M has been found to be 2.6±0.1 mM. The values for K’M reported in the literature change over a wide range from 0.073mM (Lin et al., 2007) to 0.14mM (Prieto-Simon et al., 2007) for LDH and from 0.2mM (Tsai et al., 2007) to 16.7mM (Sung et al., 2006) for LOx and depend on the type of enzyme used, the method of immobilization, and the thickness and properties of the protective membrane.
The temporal stability of the spin-coated lactate sensors was tested by continuously monitoring the steady-state response in Tyrode’s solution (Fig. 3a) at lactate concentrations of 0.5mM at RT over a period of 1 hour. The averaged current did not change appreciably during a 1-hour period of continuous use, which is sufficient to perform multiple experiments in a microfluidic environment.
Figure 3.
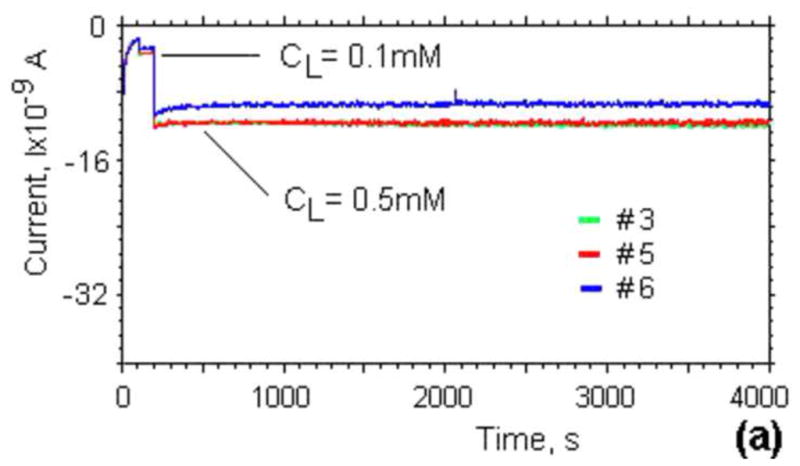
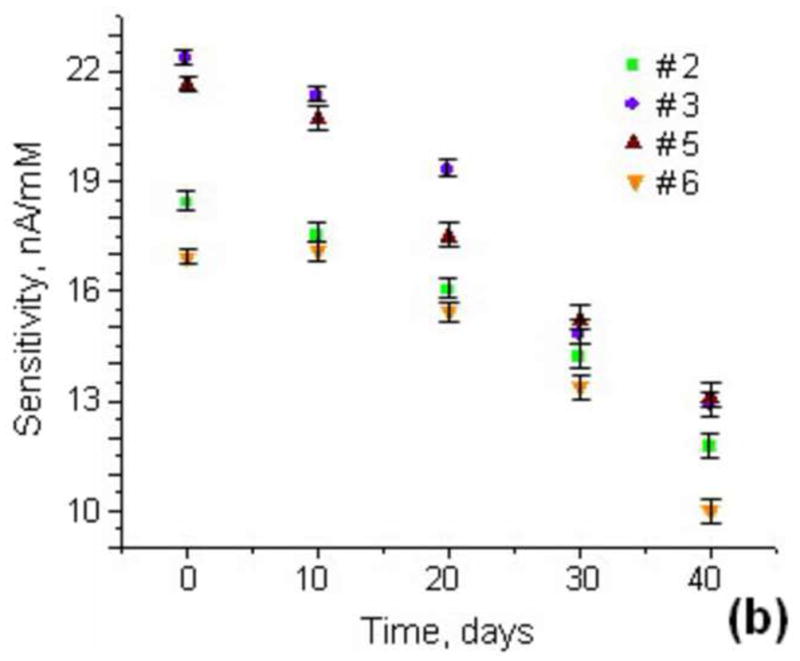
(a) Stability and noise in the current generated by three different lactate sensors over time in Tyrode’s solution with lactate concentrations of 0.1 and 0.5mM. (b) Long-term stability of the lactate sensor sensibility for 4 different lactate sensitive electrodes in Tyrode’s solution.
In order to determine the shelf life of our lactate sensors we determined the sensitivity, as described above, once every ten days over a period of 40 days. During these measurements the temperature of the Tyrode’s solution was held constant at 22° C. When not in use the lactate sensors were stored in a plastic silica-filled closed container at RT. The sensitivity over a period of 40 days for four different enzyme electrodes is shown in Fig. 3b. The calibration of the sensors was carried out several times (3–4) for 2 hours, and average values of sensitivity were displayed. After ten days the sensitivity of the sensor decreased by approximately 5%, and by 30% after the first month. However, the temporal baseline stability of the lactate sensor remained the same as the freshly fabricated sensors. From these findings we conclude that the lifetime of the spin-coated lactate sensors was at least 20 days. However, the sensor could be used for longer periods of time if calibrated before each use in a microfluidic device to measure the lactate production rate of cells.
6.2. Lactate production measurements from fibroblast cells
In order to operate the enzyme electrodes in a microfluidic environment, we placed a counter electrode in the input channel of the NanoPhysiometer and a reference electrode in the output port. Before each experiment, we performed a two point calibration in the NanoPhysiometer and recorded the current generated by the electrodes at lactate concentrations of 0.1mM and 0.4mM. Each calibration point represents 20min of stable recordings in the absence of drift. We determined the sensitivity of the lactate sensor in a microfluidic environment as 65μA/mM·cm2. These sensitivity values are only slightly smaller than observed in beaker experiments.
The microfluidic device (NanoPhysiometer) allowed us to trap small populations of cells (up to 400 cells) and use micro-lactate electrodes to quantify changes in lactate concentrations from cells trapped in the 2nL volume (Fig. 1). To trap the cell in the CCV we used the 5ml loading port as a cell reservoir. A concentrated cell suspension (2–3ml) was added to the loading port using a syringe. A combination of a negative pressure gradient and gravity driven flow was used to trap the cells in the CCV above the lactate sensitive electrodes within 1–5min after seeding the cells into the loading port. After the desired cell density was reached, mechanical pinch valves were engaged to block residual flow in the input and loading channels. Under these conditions fibroblasts are viable in the microfluidic device for at least 3–4 hours as confirmed by Trypan blue staining (Prokop et al., 2004). However, all our experiments were completed within 1–2 hours after loading.
Fig. 5 (insert) shows an optical image of the CCV combined with the lactate sensitive electrode. The cells are retained in the CCV by two vertical filter structures. The dimension of the CCV was 300μm×300μm×20μm (~2 nL). The reference electrode was placed in the output port. The bare Pt thin film counter electrode was situated in the output channel between the CCV and the reference electrode. In a typical experiment the CCV was occupied with a single layer of fibroblasts at a coverage of 50 – 80%. After the cells were loaded, we started to perfuse the NanoPhysiometer through the input port using an external syringe pump for about 5min before we started to record from the enzyme electrode amperometrically using a stop-flow protocol. A typical time trace of the current is shown in Fig. 5 during 5 cycles of stop and flow. After stopping the perfusion, we observed a reproducible increase in current, which returned to baseline during periods of flow. During the 10-min no-flow condition the current increased typically by 2–3nA, which corresponds to an increase in lactate concentration by 0.1–0.15mM. The small difference in the height and shape of the current peaks might be attributed to residual flow variation and redistribution of cells around the lactate sensitive electrode. We determined the lactate production rate in the linear regime for each stop-flow cycle and then averaged the lactate production rate for multiple stop-flow cycles for 12 experiments. For this particular experiment we calculated an average lactate production rate (LPR) of 0.011±0.0049mM/min and cell coverage of about 75%. We carried out a large number of stop-flow experiments with fibroblasts and found that the value of the LPR can vary up to two times depending on seeding density, electrode coverage, viability and cell isolation protocol (Prokop et al., 2004). Eklund (Eklund et al., 2004) measured a comparable lactate production of 3·105 fibroblasts in a 3 μL volume, which corresponds to a cell density of 102 cells/nL. The increased lactate production might be attributed to the limited oxygen supply in these high density cell culture conditions.
Figure 5.
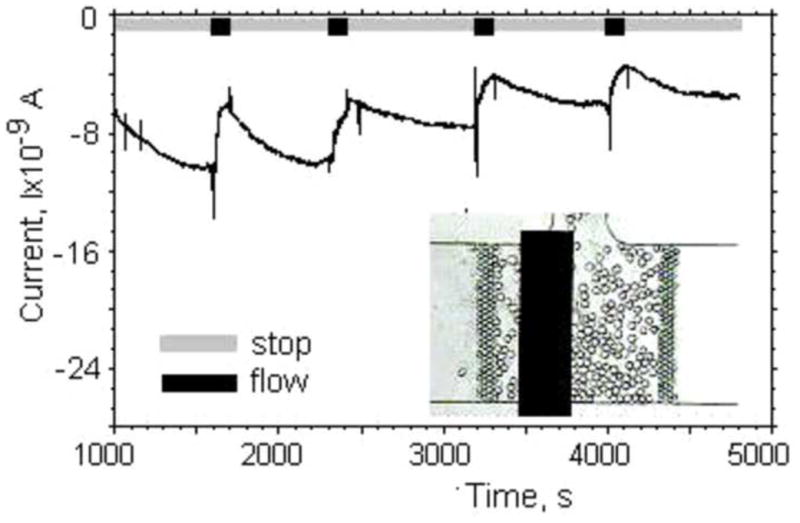
Current–time plot of our lactate sensor during a stop-flow protocol to measure the lactate production of fibroblast cells in a 2nL cell culture volume in Tyrode’s solution. The perfusion rate was 5nL/min. The inset shows an optical image of the lactate sensitive electrode inside the CCV filled with fibroblasts during lactate production measurements.
Under our cell culture conditions glucose is the dominant metabolic energy source. In a simple view of cellular metabolism glucose is converted into pyruvate. Pyruvate is an intermediate substrate which is mainly converted to acetyl-CoA and fed into the citric acid cycle. Under aerobic conditions acetyl-CoA is oxidized in the citric acid cycle and releases carbon dioxide as a waste product. In anaerobic conditions or a shortage of oxygen, pyruvate accumulates and is reduced to lactate. An increase in lactate production is therefore an indication that the supply of oxygen is limited or the citric acid cycle is otherwise disrupted. Most metabolic toxins, chemical agents and therapeutics interfere with the enzymatic reactions in the citric acid cycle. Therefore, monitoring lactate production of cells provides us with an indication of toxin interference and leads to the concept of a cell-based biosensor (Eklund et al., 2004). To demonstrate our cell-based biosensor concept, we used 2-deoxy-D-glucose (doDg). doDg cannot be metabolized and blocks glucose hexokinase. Glucose hexokinase is required for the phosphorylation of glucose to prepare it for later breakdown. Blocking hexokinases reduces the substrate available for glycolysis and even limits glucose uptake.
In order to verify that the toxins itself do not interfere with the enzymatic detection strategy utilized, we investigated the influence of doDg on the sensor itself. In Fig. 4 we show the results from our standard calibration protocol up to a concentration of 0.6 mM. At a lactate concentration of 0.6 mM, we added doDg solution to achieve 1, 2, 3, and 5mM concentrations in the beaker. At the end of the experiment, we increased the lactate concentration to 0.8mM to determine the sensitivity. We observed no changes in current generated by the lactate sensing electrodes or any change in sensitivity if the electrodes were exposed to doDg in the concentration range of interest.
Figure 4.
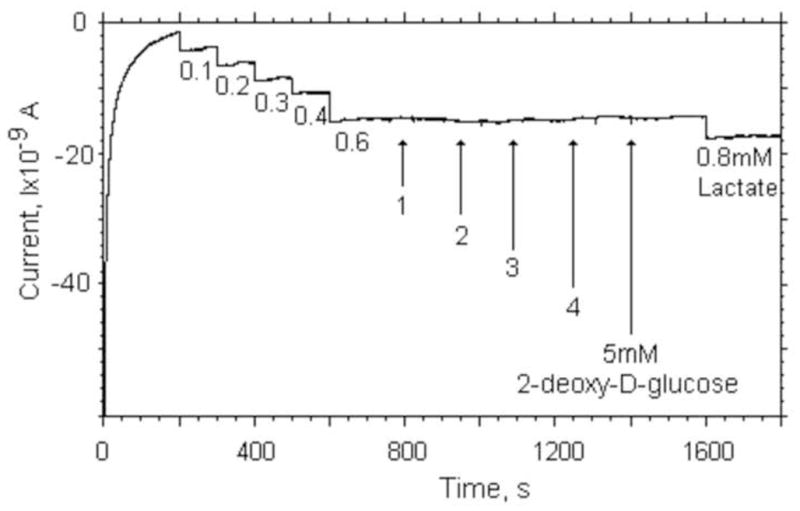
Influence of the metabolic toxin (2-deoxy-D-glucose) on the response of our lactate sensor in comparison to the response on a change in lactate concentration in Tyrode’s solution.
We trapped fibroblast cells in the NanoPhysiometer equipped with a lactate sensing electrode and subsequently exposed the cells to culture media containing 2mM of doDg after recording the base lactate concentration for 600s. Trace 1 in Fig. 6 corresponds to the base current recorded from the lactate electrode without any fibroblasts in the NanoPhysiometer. Trace 2 in Fig. 6 shows the corresponding current recorded from the lactate electrode over time. After an initial settling period we clearly observed a steady increase in the current corresponding to an increasing lactate concentration. The production rate is constant. After 600s, we started to perfuse the NanoPhysiometer with Tyrode’s solution (5mM glucose) containing 2mM of doDg at a flow rate of 2nL/min for 100s. The current reduces almost to baseline, indicating that we washed the lactate out and potentially started to block the lactate production. The blocking of lactate production is apparent as the lactate concentration does not increase after closing the flow valves and ceasing perfusion. The data are consistent with the mechanism of action expected for doDg. The blocking of hexokinase prevents the generation of pyruvate, the intermittent substrate required for lactate production even in the presence of glucose.
Figure 6.
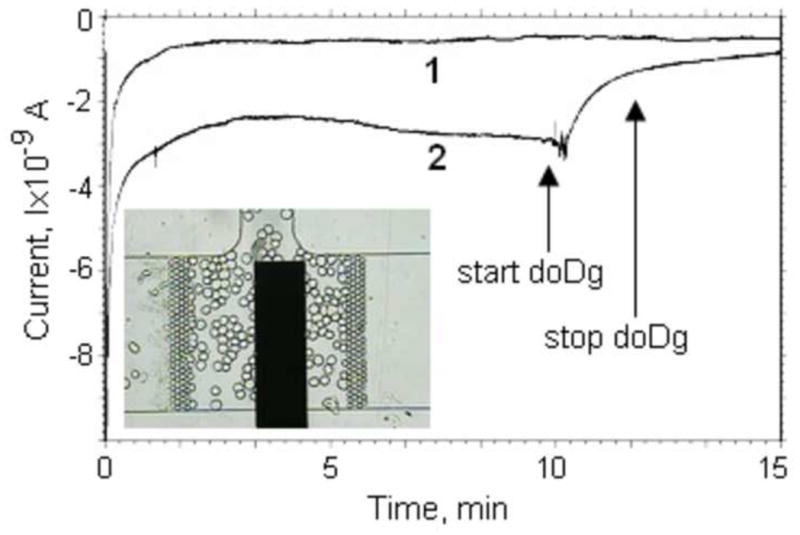
Influence of 2-deoxy-D-glucose on lactate production from fibroblast cells. 1 – current-time dependence of the lactate sensor in the cell culture volume without fibroblast cells in Tyrode’s solution. 2 – Current changes in response to exposing fibroblasts with 2mM 2-deoxy-D-glucose. The start and stop times for doDg treatment are indicated on the curve. The perfusion rate was 2nL/min. The inset shows the distribution of fibroblasts in the culture volume during the experiment.
7. Conclusions
We have demonstrated the utilization of planar miniature lactate sensing electrodes in nanoliter cell culture devices on chip and measured the lactate production rates of fibroblasts in a stop-flow configuration. Our results were validated by exposure to 2-deoxy-D-glucose. Monitoring major metabolic pathways is feasible by combining our lactate sensors with glucose, oxygen and pH electrodes. These highly integrated analytical devices will allow high throughput toxicology or drug screening applications on chip.
Acknowledgments
We are grateful to E. Kozlov and J.R. Merritt for isolating the fibroblast cells and helpful discussions. This work has been supported in part by NIH Grant U01AI061223 and the Vanderbilt Institute for Integrative Biosystems Research and Education.
Footnotes
Publisher's Disclaimer: This is a PDF file of an unedited manuscript that has been accepted for publication. As a service to our customers we are providing this early version of the manuscript. The manuscript will undergo copyediting, typesetting, and review of the resulting proof before it is published in its final citable form. Please note that during the production process errors may be discovered which could affect the content, and all legal disclaimers that apply to the journal pertain.
References
- Cheng J, Di J, Hong J, Yao K, Sun Y, Zhuang J, Xu Q, Zheng H, Bi S. Talanta. 2008;76:1065–1069. doi: 10.1016/j.talanta.2008.05.006. [DOI] [PubMed] [Google Scholar]
- Ciobanu M, Taylor DE, Wilburn JP, Cliffel DE. Anal Chem. 2008;80:2717–2727. doi: 10.1021/ac7021184. [DOI] [PMC free article] [PubMed] [Google Scholar]
- Curtis TM, Widder MW, Brennan LM, Schwager SJ, van der Schalie WH, Fey J, Salazar N. Lab Chip. 2009;9:2176–2183. doi: 10.1039/b901314h. [DOI] [PubMed] [Google Scholar]
- DeBusschere BD, Kovacs GTA. Biosen Bioelectron. 2001;16:543–556. doi: 10.1016/s0956-5663(01)00168-3. [DOI] [PubMed] [Google Scholar]
- Eklund SE, Taylor D, Kozlov E, Prokop A, Cliffel DE. Anal Chem. 2004;76:519–527. doi: 10.1021/ac034641z. [DOI] [PubMed] [Google Scholar]
- El-Ali J, Sorger PK, Jensen KF. Nature. 2006;442:403–411. doi: 10.1038/nature05063. [DOI] [PubMed] [Google Scholar]
- Ges IA, Dzhura IA, Baudenbacher FJ. Biomed Microdev. 2008;10:347–354. doi: 10.1007/s10544-007-9142-7. [DOI] [PMC free article] [PubMed] [Google Scholar]
- Ges IA, Ivanov BL, Schaffer DK, Lima EA, Werdich AA, Baudenbacher FJ. Biosen Bioelectron. 2005;21:248–256. doi: 10.1016/j.bios.2004.09.021. [DOI] [PubMed] [Google Scholar]
- Ges IA, Ivanov BL, Werdich AA, Baudenbacher FJ. Biosen Bioelectron. 2007;22:1303–1310. doi: 10.1016/j.bios.2006.05.033. [DOI] [PubMed] [Google Scholar]
- Ges IA, Baudenbacher F. Biosen Bioelectron. 2010;25:1019–1024. doi: 10.1016/j.bios.2009.09.018. [DOI] [PMC free article] [PubMed] [Google Scholar]
- Griffith LG, Swartz MA. Nature Reviews Molecular Cell Biology. 2006;7:211–224. doi: 10.1038/nrm1858. [DOI] [PubMed] [Google Scholar]
- Huang J, Li J, Yang Y, Wang X, Wu B, Anzai Ji, Osa T, Chen Q. Mat Sci & Engineer:C. 2008;28:1070–1075. [Google Scholar]
- Joshi N, Wang X, Montgomery L, Elfick A, French CE. Desalination. 2009;248:517–523. [Google Scholar]
- Koudelka M, Gernet S, De Rooij NF. Sens Actuators B. 1989;18:157–165. [Google Scholar]
- Kurita R, Hayashi K, Fan X, Yamamoto K, Kato T, Niwa O. Sens Actuators B. 2002;87:296–303. [Google Scholar]
- Lin CL, Shih CL, Chau LK. Anal Chem. 2007;79:3757–3763. doi: 10.1021/ac061972d. [DOI] [PubMed] [Google Scholar]
- Ma L, Wen J, Lu W, Caiyin Q, Liang Y. Enzyme and Microbial Techn. 2008;42:235–241. [Google Scholar]
- Ozturk SS, Riley MR, Palsson BO. Biotechnol Bioengineer. 1992;39:418–431. doi: 10.1002/bit.260390408. [DOI] [PubMed] [Google Scholar]
- Prieto-Simon B, Fabregas E, Hart A. Biosen Bioelectron. 2007;22:2663–2668. doi: 10.1016/j.bios.2006.10.034. [DOI] [PubMed] [Google Scholar]
- Prokop A, Prokop Z, Schaffer D, Kozlov E, Wikswo J, Cliffel D, Baudenbacher F. Biomed Microdev. 2004;6:325–339. doi: 10.1023/B:BMMD.0000048564.37800.d6. [DOI] [PubMed] [Google Scholar]
- Rahman MM, Shiddiky MJA, Rahman M, Shim YB. Anal Biochem. 2009;384:159–165. doi: 10.1016/j.ab.2008.09.030. [DOI] [PubMed] [Google Scholar]
- Robitzki AA, Rothermel A. Bioengineer Cell & Tissue Res. 2008:231–249. [Google Scholar]
- Romero MR, Garay F, Baruzzi AM. Sens Actuators B. 2008;131:590–595. [Google Scholar]
- Schuvailo OM, Soldatkin OO, Lefebvre A, Cespuglio R, Soldatkin AP. Anal Chim Acta. 2006;573–574:110–116. doi: 10.1016/j.aca.2006.03.034. [DOI] [PubMed] [Google Scholar]
- Shkotova LV, Goriushkina TB, Tran-Minh C, Chovelon JM, Soldatkin AP, Dzyadevych SV. Materials Sci & Engineer: C. 2008;28:943–948. [Google Scholar]
- Sung WJ, Bae YH. Sens Actuators B. 2006;114:164–169. [Google Scholar]
- Tsai YC, Chen SY, Liaw HW. Sens Actuators B. 2007;125:474–481. [Google Scholar]
- Werdich AA, Lima EA, Ivanov B, Ges I, Anderson ME, Wikswo JP, Baudenbacher FJ. Lab Chip. 2004;4:357–362. doi: 10.1039/b315648f. [DOI] [PubMed] [Google Scholar]
- Wu MH, Wang JB, Taha T, Cui ZF, Urban JPG, Cui Z. Biomed Microdev. 2007;9:167–174. doi: 10.1007/s10544-006-9018-2. [DOI] [PubMed] [Google Scholar]


