

Abstract
Neuronal regeneration and axonal re-growth in the injured mammalian central nervous system remains an unsolved field. To date, three myelin-associated proteins [Nogo or reticulon 4 (RTN4), myelin-associated glycoprotein (MAG) and oligodendrocyte myelin glycoprotein (OMG)] are known to inhibit axonal regeneration via activation of the neuronal glycosylphosphatidylinositol-anchored Nogo receptor [NgR, together with p75 neurotrophin receptor (p75NTR) and Lingo-1]. In the present study we describe the novel protein MANI (myelin-associated neurite-outgrowth inhibitor) that localizes to neural membranes. Functional characterization of MANI overexpressing neural stem cells (NSCs) revealed that the protein promotes differentiation into catecholaminergic neurons. Yeast two-hybrid screening and co-immunoprecipitation experiments confirmed the cell division cycle protein 27 (Cdc27) as an interacting partner of Mani. The analyses of Mani-overexpressing PC12 cells demonstrated that Mani retards neuronal axonal growth as a positive effector of Cdc27 expression and activity. We show that knockdown of Cdc27, a component of the anaphase-promoting complex (APC), leads to enhanced neurite outgrowth. Our finding describes the novel MANI-Cdc27-APC pathway as an important cascade that prevents neurons from extending axons, thus providing implications for the potential treatment of neurodegenerative diseases.
Keywords: myelin, neurites, Nogo, Parkinson’s disease, regeneration
Introduction
Alzheimer’s disease (AD) is an age-related neurodegenerative disorder characterized by the irreversible and progressive loss of memory, and the deterioration of higher cognitive functions. The brain of an individual with AD exhibits extracellular senile plaques of aggregated β-amyloid peptide, intracellular neurofibrillary tangles that contain hyperphosphorylated forms of the microtubule-associated protein τ (MAPT) and a profound loss of basal forebrain cholinergic neurons that innervate the hippocampus and the neocortex [1–3]. We initiated fundamental gene expression analyses using the cDNA subtraction technology to explore the cause of neuronal degeneration in AD and identified several genes, including the novel gene myelin-associated neurite-outgrowth inhibitor (MANI), that demonstrated altered expression in AD brains [4, 5]. Regeneration of injured neurons in the central nervous system (CNS) is prevented by myelin-associated inhibitor proteins such as myelin-associated glycoprotein (MAG), oligodendrocyte myelin glycoprotein (OMG) and Nogo (also known as reticulon 4 (RTN4)) by inhibiting neurite outgrowth [6, 7]. Because genetic deletion of Nogo receptor (NgR) demonstrated only moderate recovery effect, other neural proteins might convey the effect of Nogo and its related members [8, 9]. Our preliminary data indicated Mani to be a CNS-specific membrane protein. To further explore the potential (patho-) physiological action of MANI, we performed an extensive molecular and cell biological study to get a first insight into its possible function. In the present study, we demonstrated MANI to be significantly down-regulated at the mRNA and protein levels in AD brains as compared with control patients. Bio-informatic analyses indicate that MANI is a transmembrane protein and belongs to a new protein family of unknown functions. Western blot and immunohistochemical (IHC) studies with numerous tissues from mice and human (normal and diseased patients) revealed that MANI was specifically detected at the myelin sheets of catecholaminergic neural fibres in the brain tissue and localized to the neural cell membranes. Consequently, we established Mani overexpressing neuronal PC12 cells and neural stem cells (NSCs) to further unravel its biological significance. Mani overexpressing NSCs displayed enhanced capacity to differentiate into catecholaminergic neurons. Furthermore, Mani inhibited nerve growth factor (Ngf)-induced neurite outgrowth implicating its potential application as a cellular target for the diagnosis and treatment of neurodegenerative diseases.
Materials and methods
Human patients
Patients with sporadic AD (early stage; low incidence) and Parkinson’s disease (PD) (Tables S1 and S2) received a pathological diagnosis of AD according to the criteria of the Consortium to Establish a Registry for AD (CERAD) and the Braak stage [10, 11], and a neuropathological diagnosis of PD as described in the Supplementary Information document (‘Materials and methods’) [12, 13].
RNA isolation
RNA samples were extracted from human tissue. The RT-PCR method was used for mRNA expression analyses as described previously [4, 14, 15].
Animal materials, immunocytochemistry (ICC), immunohistochemistry and NSCs culture
Experimental methods, including the killing of animals, were performed in accordance with the International Guiding Principles for Animal Research (WHO) and were approved by the local Institutional Animal Care & Use Committee (NTU-IACUC). Mouse tissues were isolated (C57BL/6J mice from the Animal Facility Centre at the National University (NUS) of Singapore) after humane killing of the animals using approved anaesthetic methods to isolate NSCs. Mouse brain perfusion, NSC culture (proliferation and differentiation) and IHC were performed according to previous reports [16–19].
cDNA cloning and MANI sequence analyses
Human (Genbank: AY253283) and mouse cDNAs were obtained using MANI-specific oligonucleotides (sense: 5′-cctgtttatagtcctggatcttctggggtt-3′; anti: 5′-accactgagggggcacatagctgtaagtgg-3′) to analyse a human and mouse brain Marathon-Ready™ cDNA libraries (BD Biosciences, Bedford, MA, USA) for 5′- and 3′-RACE (rapid amplification of cDNA ends) experiments [4, 14]. Mani was inserted into the EF.CMV.GFP (elongation factor 1 alpha, cytomegalovirus promotors, green fluorescent protein) lenti-vector via its EcoRV cloning site (JHU-55; ATCC, Manassas, VA, USA). The cDNA was also subcloned into the Yeast-Two-Hybrid-Screening system vector pGBKT7 via the EcoR1 restriction site. MANI cDNA and protein sequences were analysed using online databases as done previously [14, 18].
Antibodies
A rabbit polyclonal anti-MANI antibody was raised and purified against aa89–aa102; however, it may not detect FAM168A (family with sequence similarity 168, member A) because 4 aa are different in this region (Fig. S1; BioGenes GmbH, Berlin, Germany). Antibody specificity was tested using recombinantly expressed MANI in Escherichia coli (not shown) as well as in mammalian cell lines overexpressing Mani or a Mani-GFP fusion protein (Figs 2 and S2).
Fig 2.
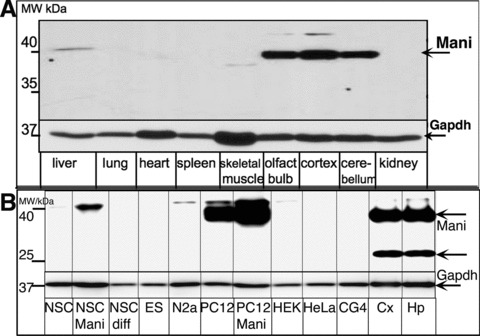
Mani protein expression analysis in various tissues. Tissue obtained from an adult mouse. Specific high expression was observed in the brain with a major band at ∼40 kD representing glycosylated Mani (A). Expression of Mani protein in various transfected (Mani)/non-transfected cell lines and brain tissue. NSC: mock/GFP-transfected NSCs, NSC-Mani: Mani-transfected NSCs, NSC-diff: NSCs differentiated in neurobasal medium (NB) supplemented with B27 without Egf (mainly glia cells), ES: embryonic stem cells, N2a: mouse neuroblastoma cell line, PC12: mock/GFP-transfected PC12 cells, PC12-Mani: Mani-transfected PC12 cells, HEK: human embryonic kidney cell line, CG4: glia-progenitor cell line, HeLa: human cervical tumour cell line, Cx: mouse brain cortex tissue lysate, Hp: mouse brain hippocampus tissue lysate. Only the brain-tissue lysate shows the lower band at ∼20 kD – compare with Fig. S4 (B).
Cell line culture
PC12 (rat pheochromocytoma), HeLa (human cervical cancer cell line which was derived in 1951 from Henrietta Lacks), HEK293FT (human embryonic kidney), N2a (mouse neuroblastoma) and B104 (rat neuroblastoma) cells (all from ATCC) were cultured according to standard procedures [4, 14]. The CG4 (oligodendrocyte progenitor) cell line culture was performed according to previous descriptions [20].
PC12 and NSC transfection
Cells were transfected using a lentivirus expression system (Mani in EF.CMV.GFP-Lenti-vector (ATCC); co-expression of Mani and GFP) following established protocols (Invitrogen, Carlsbad, CA, USA) [18]. Controls (C) were mock/GFP-transfected cells.
Generation of Cdc27 knockdown PC12 cells using small interfering RNA (siRNA)
PC12 cells were co-transfected with cell division cycle protein 27 (Cdc27) siRNA and GFP (empty siRNA GFP vector) using a lentivirus expression system as described for Mani overexpression (pSIH1-H1-shRNA-copGFP vector, Cdc27 mRNA target sequences: (i) 5′-gccctaggtccaaatgttacc-3′, (ii) 5′-gcggaaagctgacttcaaagc-3′, (iii) 5′-ggatgaactagaagaggaatt-3′; System Biosciences, Mountain View, CA, USA). Controls (C) were mock/GFP-transfected (empty siRNA GFP vector) cells. Specific silencing of the target Cdc27 gene in the obtained cell clone was confirmed by Western blot using a Cdc27-specific antibody.
Results
MANI protein sequence analyses
Bio-computational analyses of the MANI protein sequence revealed that the protein contains two potential transmembrane domains and a potential (opioid) receptor-like motif (Fig. S1). As a Grd7-like protein (a groundhog (hedgehog-like) family member), MANI is likely to be involved in inter-cellular signalling. Additional bio-informatic analyses showed that MANI has a large loop that protrudes extracellularly and short intracellular cytoplasmic C- and N-terminal regions that contain a Met-1 acetylation site and various Ser/Thr (serine/threonine) phosphorylation sites.
Tissue-specific expression analyses of MANI
Expression of MANI in brains from patients with Alzheimer’s disease
Because we originally found the MANI mRNA to be down-regulated in AD brains, in a cDNA subtraction analysis [4], we reconfirmed this finding by RT-PCR and IHC in human patients and observed a significant reduction of MANI mRNA levels in AD patients. Protein expression analysis in human brains disclosed (though no obvious down-regulation) that MANI was present within (neuronal) axonal fibres and to be associated with myelin sheets (Fig. 1A–D; Fig. S2 [antibody specificity analysis] and Table S1). Because of our limited access to human tissue, we confirmed the down-regulation of Mani at protein levels in AD using an AD mouse model (Fig. 1E).
Fig 1.
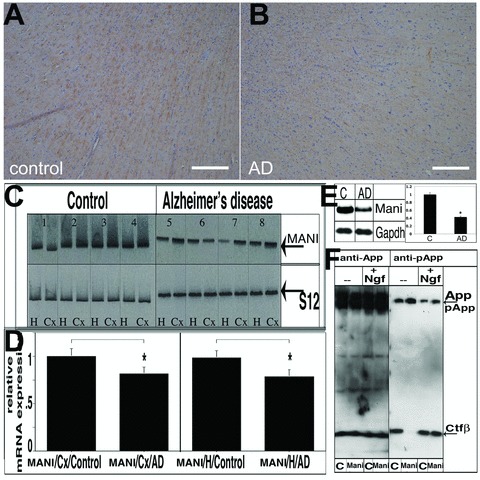
MANI expression in AD brains. MANI protein expression in the cortex/temporal lobe (the borderline between the cortex and white matter in the temporal lobe) of control subjects (A) and AD patients (B) (representative pictures are shown). IHC was performed with the MANI antibody. No correlation between MANI staining and SPs or NFTs (data not shown) was observed. Scale bar = 200 μm (A, B). Southern blot analysis of MANI RT-PCR expression products in the brains of AD patients and control subjects. Analysis of PCR products; left: Control group, right: AD group; top: MANI PCR products, bottom: PCR products of the reference gene S12. H, hippocampus; Cx, parietal cortex; detailed description of control and AD patients 1–8 is provided in the Supplementary Information, Table S1 (C). Quantitation of the MANI transcripts. Values represent the ratio of the densitometric scores for MANI and S12 PCR products ± S.D. (*P < 0.05 compared with controls) (D). Western blot analysis of Mani protein in an AD mouse model (AD) and control wild-type (litter-mates) (C) total brain lysates confirmed that Mani was significantly decreased in AD. Right: Data represent mean ± S.D. (ratio of the densitometric scores for Mani and Gapdh products) of three independent experiments (*P < 0.05 compared with control) (E). Effect of Mani on App phosphorylation and processing. PC12 cells were grown and differentiated with Ngf, and lysates were prepared on the 12th day of induction, followed by Western blot analysis (c = control (mock-transfected), Mani = Mani transfected). Mani-transfected cells exhibited decreased phosphorylation of processed App (Ctfβ) and increased phosphorylation of full-length App, which in turn stabilizes App’s conformation and inhibits processing (F).
Next, we investigated the influence of Mani on amyloid precursor protein (App), which is known to be crucially involved in neurodegenerative processes of AD [2]. Thus, we utilized the catecholaminergic PC12 cells, a well-established model system, frequently used for the study of neuronal survival and differentiation [21]. The cells were transfected using a Mani lentivirus-vector construct [co-expressing GFP to further isolate transfected cells from non-transfected cells by fluorescence-activated cell sorting (FACS)].
Figure 1F shows that upon transfection into PC12 cells, Mani induced an alteration in the phosphorylation and cleavage pattern of the App protein. Full-length App exhibited increased phosphorylation at Thr668 in Mani-transfected cells, whereas phosphorylation of the cleaved Ctfβ fragment was completely abolished. Interestingly, in the presence of Ngf the phosphorylated Ctfβ reappeared indicating that Ngf counteracts Mani function.
Expression of Mani protein in various tissues and cell lines
To further identify Mani’s physiological role, we tested the tissue-specific expression pattern of Mani. We analysed various tissue lysates using a specific antibody raised against MANI. Surprisingly, Mani expression was verified at the protein level in brain tissue only (Figs 2A, B and S3). Analysis of mouse brain tissue revealed a major band detected at approximately 40 kD from which we presumed that the protein exists either as a homo-dimer or as a post-translationally modified protein. Considering the membrane-associated nature of Mani, a de-glycosylation assay was conducted which substantiated Mani as an N-glycosylated protein (Fig. S4). The unglycosylated band of Mani (20 kD) could only be seen in tissue lysates and is hardly visible in normal cell lysates. Because post-translational modifications of a protein is dynamic and at a given time both modified and un-modified protein is expected to be present, the reduced abundance of un-glycosylated Mani suggests a higher significance of its post-translational version. Our tissue-specific expression pattern result is in line with data obtained from the gene database (bio-informatic analysis at NCBI, Fig. S3).
We transfected primary E14 (embryonic stage 14, E14) mouse brain-derived NSCs with a Mani-lentiviral construct and tested the effect of Mani overexpression in comparison with mock-transfected cells. The basis of using NSCs to study the effect of overexpression of Mani is their therapeutically potential in the treatment of neurodegenerative disorders. Higher expression of Mani was confirmed in Mani-transfected NSCs and in the catecholaminergic PC12 cells (transfected and non-transfected), whereas all other cell lines exhibited no Mani expression (Fig. 2B).
Expression of MANI in brains from patients with Parkinson’s disease
In lieu of our observation of higher Mani expression in the catecholaminergic (tyrosine hydroxylase-positive [Th+]) PC12 cells and in line with the gene database (NCBI) indicating that the mouse sequence of Mani is expressed in the thalamus as well as in dopaminergic neurons of the substantia nigra (sn), we investigated the expression of MANI in the brains of human patients with PD (Table S2). Surprisingly, we detected MANI only in neuronal fibres near the sn; in fact, IHC indicated a strong staining of the myelin sheets, suggesting that MANI is expressed specifically in myelinated neurons (Fig. 3).
Fig 3.
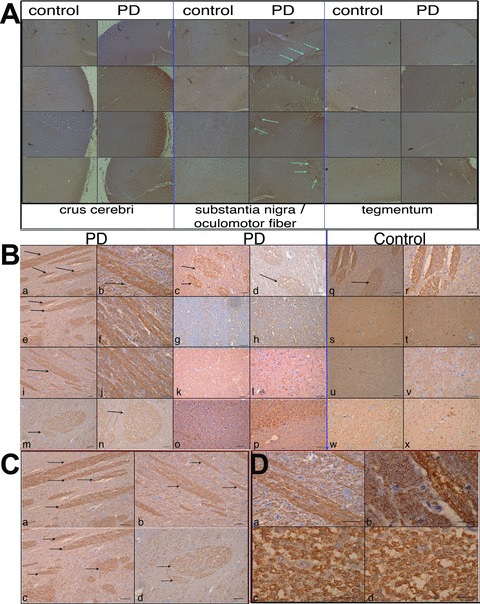
Qualitative Mani expression analysis in the crus cerebri, substantia nigra (sn) (near to the oculomotor neuron area) and the tegmentum of human brains. MANI protein expression in various brain areas (as indicated) obtained from control patients and PD patients, representative pictures are shown; a specific expression pattern within neuronal fibres (myelin sheets, arrows) could be observed (A). MANI protein expression in the sn area (around the oculomotor neuron area) under higher magnification (×10). Scale bar = 50 μm (B). MANI protein expression in select areas from (B, a, b, e, m) under higher magnification (×20 and ×60, respectively) (C–D).
Subcellular localization of Mani
We next investigated the subcellular localization of Mani to obtain more information about its distribution and site of activity in the cell. Mani was particularly localized to neuronal cell membranes in the mouse brain hippocampus, sn and cortex tissue (Figs 4 and S5), with a specific co-distribution with Th+ neurons as assessed by IHC. Figure 4 demonstrates a similar staining pattern of Mani and Mtap2 in the cortex and the CA1, CA2, CA3 and dentate gyrus formation of the hippocampus suggesting its presence on the membrane of neuronal cell bodies and axonal fibres. We also performed IHC of Mani and Mapt substantiating the presence of Mani in neuronal axons (data not shown). Next, to answer if Mani localizes to oligoglial cells, we performed a co-staining of Mani and myelin basic protein (Mbp) and found its presence in neuronal axons but not oligodendrocytes (Figs 3 and S5). A further detailed IHC study demonstrated neural localization of Mani within the periaqueductal grey (PAG)–substantia gelatinosa (SG) pathway (Figs S6 and S7). To provide additional evidence about the membrane association of Mani, we performed a subcellular protein fractionation and found that Mani falls mainly within the membrane fraction obtained from PC12 cells (Fig. S8).
Fig 4.
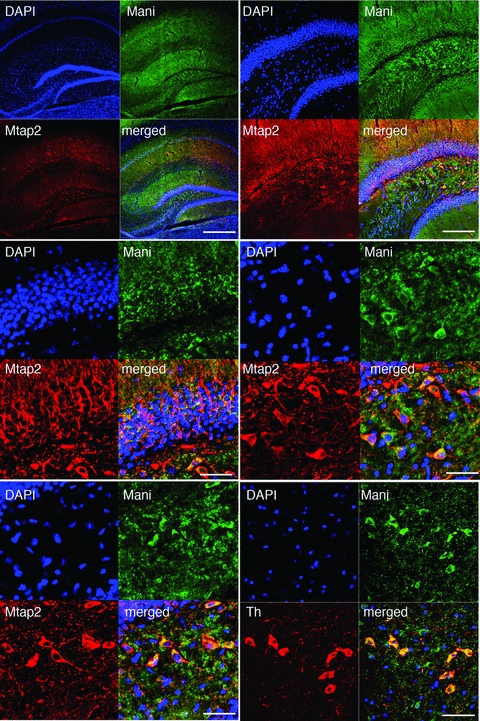
Specific localization of Mani in the mouse brain. Top-left: IHC of Mani and Mtap2 within the mouse brain hippocampus. DAPI labelling was used to confirm neuronal nuclear/ cell body location in the hippocampus CA1-CA4/DG formation. Scale bar = 500 μm. Top-right. Magnification of the CA4/DG area of Mani/Mtap2 co-IHC: Mani does not appear in the neuronal cell bodies but strong (yellow) co-localization with Mtap2+ neuronal axons. Scale bar = 50 μm. Mid-left: Further magnification of the DG area of Mani/Mtap2 co-IHC: Mani appears at neuronal cell membranes. Scale bar = 20 μm. Mid-right/bottom-left: Further magnification of another DG/CA4 area of Mani/Mtap2 co-IHC confirming that Mani appears at neuronal cell membranes co-localizing with Mtap2+ neurons. Scale bar = 20 μm. Bottom-right: Magnification of the sn area of Mani/Th co-IHC confirming the co-localization of neuronal Mani and Th. Scale bar = 20 μm.
Characterization of Mani’s function on neuronal survival and differentiation
The effect of Mani on NSCs differentiation
For additional functional investigations of Mani, we continued our studies with NSCs (E14) (Fig. 5). As shown in (Fig. 5B), Mani-transfected neurospheres continuously cultured in the presence of Egf (epidermal growth factor) demonstrated a moderate change in Gfap (glial fibrillary acidic protein, a glial cell marker) expression, but evidently higher expression levels of the neuronal marker Tubb3 (neuron-specific β-class-III tubulin, Tuj1). Additionally, the stem cell marker Nestin was significantly reduced, indicating that Mani drives NSCs towards neurogenesis, even in the presence of the mitogen Egf (Fig. 5B). The increase in Tubb3 in Mani-transfected NSCs led us to the identification of the differentiating neuronal subtype. Therefore, we proceeded to check the expression levels of various neuronal markers, such as Chat (choline acetyltransferase, marker for cholinergic neurons), Gad (glutamate decarboxylase, marker for GABAergic neurons) and Th (marker for catecholaminergic neurons). Of utmost interest is our finding that Mani induced a striking up-regulation of Th (Fig. 5B) correlating with our findings of high expression of Mani in the catecholaminergic PC12 cells and Th+ areas in the CNS (Figs 2, 4, S6 and S7). In contrast, other neuro-specific markers, such as Chat or Gad (data not shown), remained unchanged.
Fig 5.
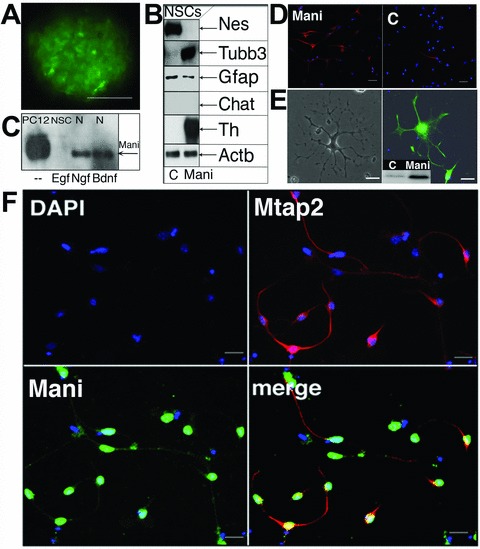
Mani induces NSCs differentiation and neurogenesis. FACS purified neurospheres overexpressing Mani grown for three passages (3P, 1P ∼4 days) in Egf. Controls (C) were mock/GFP-transfected cells. Scale bar = 100 μm (A). Western blot analysis of Mani-transfected cells (NSC-Mani, E14, 3P) showed no changes in the glial marker Gfap, but a significant increase in Tubb3 and Th expression, whereas Nestin (Nes) was down-regulated and other neuronal markers (Chat, Gad [not shown]) remained unchanged, indicating that Mani induced a specific differentiation into catecholaminergic neurons (B). Comparison of Mani expression under different conditions, as indicated (NSCs were grown in the presence of Egf or Ngf or brain-derived neurotrophic factor for 3P, N = primary neuro-progenitor/neuron culture; compare with Fig. 2B) (C). Expression of neural Tubb3 in Mani-transfected NSCs (Mani, left) and control (mock-(GFP)-transfected) NSCs (C, right) upon differentiation in NB/B27 without Egf. Scale bar = 100 μm (D). Expression of Mbp in Mani-transfected and differentiated (in NB/B27) NSCs. Left panel: phase contrast microscopy. Right panel: Fluorescence microscopy of an Mbp-stained cell. The small panel shows the Western blot analysis of Mbp expression in Mani-transfected (= Mani) cells compared with mock/GFP-transfected (= C) NSCs. Scale bar = 50 μm (E). Mani-transfected NSCs were grown for 3P prior to exposure to differentiation medium (in NB/B27). Cells were then stained for Mani and Mtap2 to demonstrate the neuronal character of differentiated cells. Green = Mani, red = Mtap2, blue = nuclear DAPI stain. Scale bar = 100 μm (F).
After differentiation, Mani-transfected NSCs demonstrated a significant higher percentage of Tubb3+ neurons (Fig. 5D) whereas it is reported that usually most of the differentiated NSCs are astroglial cells (Gfap+) [16]. In addition, the expression of Mbp could only be detected in differentiated NSCs transfected with Mani, and only Mani-transfected NSCs showed an oligodendrocyte-like morphology and higher number of Mtap2+ neuronal cells after differentiation (Fig. 5E and F).
We further analysed the expression of Mani in NSCs (E14) cultured in the presence of the mitogen Egf or primary neurons cultured in the presence of any one of the different neurotrophins (NTs), Ngf or brain-derived neurotrophic factor, respectively (Fig. 5C), which are all well-known survival and differentiation factors for particular neurons [22]. Of primary interest, the different NTs induced a strong up-regulation of neuron-specific Mani, which was completely absent if cells were incubated in the presence of the mitogen Egf. This suggests that Egf strongly influences the specific expression pattern of Mani and indicates that Mani was specifically expressed in differentiated neurons but absent in proliferating NSCs or stem cells (compare Fig. 5C with Fig. 2B).
Effect of Mani on neuronal survival
To further unravel the function of Mani, it was knocked down by the siRNA technology and a significant reduction in cell survival was observed (Fig. 6A). We also examined the expression level of survival-related proteins and found that Mani-transfected cells have significantly increased levels of activated Bcl2, which again confirmed that Mani functions as a survival-promoting protein (Fig. 6B).
Fig 6.
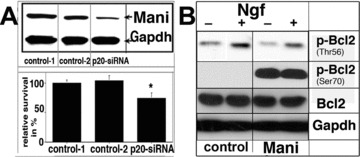
Mani mediates neuronal survival. Effect of Mani expression on the survival of PC12 cells. Upper panel: Western blot analysis of Mani expression, which was down-regulated via application of the siRNA method. Lower panel: analysis using the ELISA-Cell-Titre 96® AQueous assay as described under ‘Materials and methods’ (Supplementary Information). Data represent mean ± S.D. of four independent experiments, each performed in duplicates (*P < 0.05 compared with controls [mock/GFP transfected]) (A). Mani-overexpressing cells demonstrated higher levels of phosphorylated Bcl2 at Ser70 but decreased phosphorylation at Thr56, even without Ngf stimulation indicating Mani’s anti-apoptotic function [23]. Cells were grown and stimulated as indicated for 6 days with 100 ng/ml Ngf. Controls (C) were mock/GFP-transfected cells (B).
Characterization of Mani’s function on neurite outgrowth
Considering the expression of Mani on the (neuronal) axonal membrane (Figs 3, 4, S5, S7 and S8), we speculated that Mani might regulate axonal growth guidance. Consequently, we inspected the effect of Mani on the neurite outgrowth formation in PC12 cells.
Mani inhibits Ngf-induced neurite outgrowth through Stmn2 and Stat3 in PC12 cells
Data obtained thus far prompted us to explore the possible signalling pathways involved in Mani-mediated morphological changes during the differentiation of catecholaminergic (Th+) neurons. Thus, Ngf was applied for 2 weeks to catecholaminergic PC12 cells and, surprisingly, even after 1 week of Ngf stimulation, PC12 cells transfected with Mani did not show any significant observable neurite outgrowth – instead, only very short neurite extensions could be seen on day 12 of induction (Fig. 7A).
Fig 7.
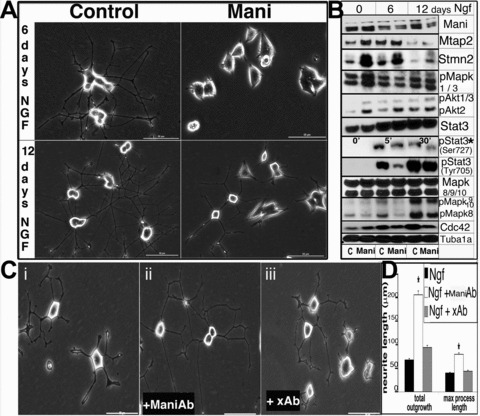
Mani inhibits neurite outgrowth. Expression of Mani in PC12 cells inhibits Ngf (100 ng/ml)-induced neurite outgrowth and modulates the expression of pivotal cell signalling molecules. Control (mock/GFP transfected; left panel) and Mani-transfected (right panel) PC12 cells were incubated in the presence of Ngf to induce neurite outgrowth. Pictures were taken on the 6th and 12th day of Ngf stimulation. Whereas the control cells showed a normal neurite network, Mani-transfected cells exhibited no or little response to Ngf, as demonstrated by the significantly inhibited neurite outgrowth, even after 12 days. Scale bar = 50 μm (A). PC12 cells were grown and differentiated with Ngf, and lysates were prepared on the 6th and 12th day of induction, followed by Western blot analyses (C = control [mock/GFP transfected], Mani = Mani transfected). Mani-transfected cells displayed altered expression and phosphorylation (p-) levels of various signalling molecules. * indicates short-term induction with Ngf, as Stat-3-Ser-727 is transiently activated first, prior to Stat-3-Tyr-705 [23]. Mani itself was down-regulated upon Ngf stimulation (B). PC12 cells were grown and differentiated via application of Ngf for 10 days in the presence of either the Mani antibody or a random unspecific antibody (xAb). As shown in (ii), the presence of the ManiAb enhanced Ngf-induced neurite outgrowth. Scale bars = 50 μm (C). Statistical evaluation of the neurite outgrowth described in (C, i–iii). Data represent mean ± S.D. of three independent experiments each done in duplicates (*P < 0.05 compared with controls (no antibody added [C, i]) (D).
Because Mani is a neuronal membrane protein whose overexpression inhibited neurite outgrowth formation, we incubated PC12 cells with our Mani antibody prior to Ngf stimulation. Analysis of Ngf-mediated neurite outgrowth in the presence of the anti-Mani antibody revealed enhanced neurite outgrowth in PC12 cells (Fig. 7C and D).
The observation that the gain of Mani function inhibited neurite outgrowth whereas the loss of Mani function exhibited the opposite effect could be due to (i) Mani inhibits Ngf-mediated cell differentiation or (ii) Mani inhibits Ngf-stimulated neurite outgrowth formation.
Because Mani promoted higher differentiation in NSCs, the first hypothesis is less likely to be the reason. To test this, we fathomed the Ngf signalling pathways involved in the differentiation of PC12 cells in both Mani- and mock-transfected cells. Mani-transfected PC12 cells demonstrated higher expression and activity of proteins involved in neuronal differentiation and survival, such as phosphorylated Mapk1/3 and Akt (Fig. 7B), like NSCs. Treatment of PC12 cells with Ngf has been shown to result in Ngf-receptor (Ntrk1)-dependent Stat3 (signal transducers and activators of transcription protein) activation, which in turn positively regulates the expression of Ccnd1 [24] initiating neurite outgrowth. Additionally, Mani-transfected PC12 cells displayed reduced levels of phosphorylated Stat3 (pStat3) (Fig. 7B) and Ccnd1 (Fig. 8G) upon Ngf stimulation indicating that Mani negatively regulates Stat3 activation. It has been reported that negative regulation of Stat3 phosphorylation is necessary for neurogenesis confirming that Mani-transfected cells are more prone to differentiate into neurons (Figs 5 and 7B) [19, 25]. Thus, concluding that Mani does not inhibit differentiation; rejecting our first hypothesis.
Fig 8.
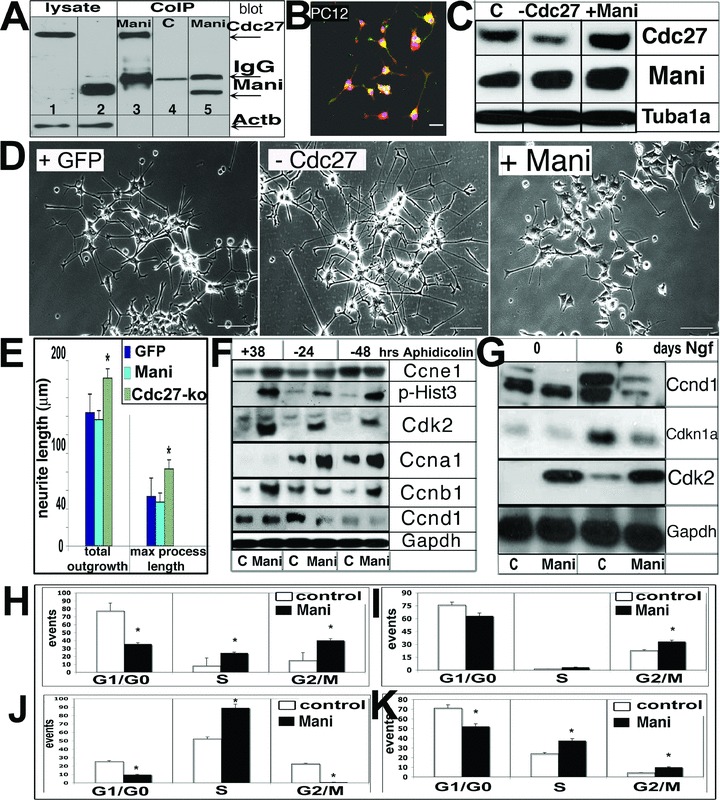
Mani interacts with Cdc27 and acts as a positive effector of Cdc27. CoIP of Mani and Cdc27. Cell lysate was obtained from PC12 cells. Western blot was performed with an anti-Cdc27 (lane 1, 3, 4) or anti-Mani (lane 2, 5) antibody. Lanes 1–2: total PC12 cell lysates only and using an anti-Cdc27 (lane 1) or anti-Mani (lane 2) antibody for Western blot detection respectively; lanes 3 and 5: CoIP products using an anti-Mani antibody (Western blot detection with anti-Cdc27 antibody (lane 3) or an anti-Mani antibody [lane 5)], lane 4: CoIP product using control serum (detection with anti-Cdc27 antibody) (A). Co-localization (yellow) of Mani (green) and Cdc27 (red) expression in PC12 cells. Cells were differentiated with Ngf for 10 days and prepared for ICC. Purple = nuclear DAPI stain. Scale bar = 50 μm (B). Western blot analysis of Cdc27 knockdown (Cdc27-ko) by siRNA in PC12 cells. C = control (mock-(empty siRNA-GFP vector)-transfected), −Cdc27 = cdc27 siRNA, +Mani = Mani-transfected (C). Effect of Cdc27-ko by Cdc27-siRNA on Ngf-induced (10 days) neurite outgrowth in PC12 cells. Control cells were transfected with GFP (mock-(empty siRNA-GFP vector) only. Whereas Cdc27-ko cells demonstrated longer neurites compared with control cells, the response of Mani-transfected (+Mani) cells was poor. Scale bars = 50 μm (D). Quantitative neurite outgrowth estimation demonstrates that Cdc27-ko by siRNA resulted in longer neurites upon Ngf stimulation. Cells were treated as in (D). Data represent mean ± S.D. of three independent experiments (n = 3 data sets), each performed in duplicates (*P < 0.05 compared with controls and GFP-transfected cells) (E). Western blot analysis of control (C = GFP transfected) and Mani-transfected PC12 cells synchronized for 38 hrs with aphidicolin (+38) prior to incubation for an additional 24 and 48 hrs without aphidicolin (−24, −48), respectively (F). Western blot analysis of control and Mani-transfected cells, which were first synchronized with aphidicolin and then stimulated with Ngf for the indicated times (G). Effect of Mani on the cell cycle. Cell cycle analysis was performed with PC12 control cells (transfected with GFP only = C) and PC12 cells transfected with Mani (= Mani). The DNA content is represented by propidium iodide (PI) fluorescence intensity for 1 × 10⁴ cells under each condition. Mani-transfected cells (both PC12 and NSCs) have a tremendous capacity to cross the G1/S and G2/M restriction points. The percentage of cells in the various cell cycle phases for the indicated experimental conditions, as indicated, is shown (H–K). Cell cycle analysis of unsynchronized control (= C, mock/GFP-transfected cells.) and Mani-transfected (= Mani) PC12 cells (H). Cell cycle analysis of synchronized PC12 cells treated for 38 hrs (∼1 cell cycle generation) with aphidicolin before allowing the cells to re-enter the cycle for 24 hrs (I). Cell cycle analysis as in (H), in which the cells were allowed to re-enter the cell cycle for 48 hrs (J). Cell cycle analysis of unsynchronized control (= C) and Mani-transfected (= Mani) NSCs. Evaluation of the cell cycle analysis performed in H-K reveals that Mani drives the cells out of G1/G0, beyond the restriction point, into the G2/M phase. Data represent mean ± S.D. of four independent experiments (n = 4 data sets), each performed in duplicates (*P < 0.05 compared with controls [C]) (K).
Regarding the second hypothesis, observed activation of Akt in response to Mani (even in the absence of Ngf) is in agreement with a previous study demonstrating that higher activity of Akt inhibits Ngf-mediated neurite outgrowth in PC12 cells [26]. Moreover, Mani-transfected PC12 cells demonstrated an increased level of Stmn2, a neuron-specific stathmin protein that is enriched in the growth cones of developing neurons to enhance microtubule dynamics, possibly through increasing the frequency of catastrophe [27]. A recent report has shown that Stat3 is not only acting as a transcription factor in the nucleus but might also be essential for the modulation of the microtubules network in the cytoplasm by binding to the C-terminal tubulin-interacting domain of Stmn2 and thereby antagonizing its microtubules destabilization activity [28]. Thus, the down-regulation of Stat3 activation by Mani may block the interaction between Stat3 and Stmn2; thereby inhibiting neurite outgrowth in PC12 cells upon Ngf stimulation.
Rho GTPases, Rhoa, Rac and Cdc42, are key regulators of the actin cytoskeleton, and they have all been implicated in dendritic spine formation, shape and synaptogenesis, as well as in neuronal axon specification and elongation [29]. Thus, with respect to the observation of Mani-inhibited neurite outgrowth, we investigated this signalling cascade and found that Mani-transfected PC12 cells exhibit significantly decreased Cdc42 expression (Fig. 7B). Taken together, our data suggest that Mani overexpression does not inhibit differentiation but may particularly interfere with axonal elongation. Data obtained indicate that Mani modulates neuronal axonal outgrowth as a negative regulator of Cdc42 and Stat3 and a positive regulator of Stmn2 expression and activity resulting in a disturbed actin/tubulin dynamics of the cell.
Mani, cell division cycle protein 27 and the cell cycle
Additional clarification about Mani’s potential cellular function was obtained by yeast two-hybrid screen. The analysis revealed that Mani interacts with several proteins involved either in controlling apoptosis or in the progression of the cell cycle such as Cdc27 (Table S3). The interaction of Mani with Cdc27, a conserved component of an essential M-phase ubiquitin-protein ligase called the anaphase promoting complex (APC), was confirmed by co-immunoprecipitation (CoIP) (Fig. 8A). ICC demonstrated that Mani and Cdc27 were partially co-localized (yellow) in differentiated PC12 cells (Fig. 8B).
It is noteworthy that Mani-transfected PC12 cells demonstrated higher Cdc27 protein levels, whereas knockdown of Cdc27 did not significantly affect Mani protein levels, indicating that Cdc27 is downstream of Mani in the signalling cascade (Fig. 8C). In lieu of the observation that overexpression of Mani induced Cdc27 expression, we used the siRNA method to knock down Cdc27 in PC12 cells to shed more light on the interplay between Mani and Cdc27. Further analysis revealed that knockdown of Cdc27 in PC12 cells resulted in enhanced Ngf-stimulated neurite outgrowth (Fig. 8D and E).
Because Mani interacts with Cdc27, a component of the APC that plays a key role in the control of the cell division cycle, we proceeded to determine the expression levels of cell cycle-related proteins in aphidicolin synchronized as well as in Ngf-treated PC12 cells [30]. To our surprise, the endogenous levels of Ccna1, Ccnb1 and Cdk2 were significantly up-regulated, whereas Ccnd1 remained at low levels in Mani-transfected cells (Fig. 8F). Cdk2 is known to form a complex with Ccne1 to cross the G1-S checkpoint and subsequently with Ccna1 to progress through the S-phase, thus the expression level of Ccne1 was investigated. Mani-transfected cells revealed a higher Ccne1 level during the synchronized state. This suggests that Mani-transfected cells have a higher tendency to cross the G1-S and G2-M checkpoints and to enter mitosis, which was confirmed by the increased level of phosphorylated Hist3 (a marker of mitotic cells) observed in Mani-aphidicolin synchronized (Fig. 8F) as well as Ngf-treated cells (data not shown) [31]. Moreover, expression of the cyclin-dependent kinase inhibitor Cdkn1a (also p21waf1) was inhibited leading enhanced Cdk2 expression and activity in Mani-overexpressing PC12 cells (Fig. 8G). These results further verify the enhanced proliferative capacity of Mani-transfected cells and provide additional support to its role in inhibiting Ngf-induced neurite outgrowth in PC12 cells. Conversely, control (mock-transfected) PC12 cells showed a normal response to Ngf with elevated Ccnd1 levels whereas Mani maintained the cell in the G2/M phase with reduced Ccnd1 levels. This correlates with previous findings that Ccnd1 down-regulation (and cytoplasmic sequestration) is a key event in neural progenitor cell survival and differentiation into post-mitotic neurons [32].
Discussion
In the present study, we characterized the novel protein Mani that showed relatively lower expression levels in AD brains. Of particular interest is the observation that Mani has a tissue-specific protein expression pattern, with high expression in the CNS where it is predominantly localized to the cell membrane/myelin sheath of neural fibres. Mature Mani protein is N-glycosylated and highly abundant whereas the non-modified immature protein is lower in abundance. This suggests that N-glycosylated-Mani is functionally significant, as a majority of the protein undergoes post-translational modification immediately after synthesis and subsequently targeted to the membrane. The finding that Mani induces an increased expression of the neuronal markers Tubb3 and Th in NSCs suggests that Mani might be involved in mediating catecholminergic neurogenesis – an increased amount of NSCs may enter the Th+ neurogenic lineage pathway, a phenomenon also observed with other neural cell membrane-associated proteins [33]. The Ground-domain of Mani demonstrates a subtle similarity to the N-terminal Hedge-domain of Hedgehog proteins. Therefore, Mani might be involved in intercellular signalling and may function during the development of the nervous system as a Grd-7-like protein in controlling neurogenesis of NSCs into catecholaminergic neurons. Moreover, the localization of Mani in the neurons of the PAG–SG pathway indicates that Mani may also function in the control of pain sensation and defensive behaviour.
App is a cell surface receptor that signals via sequential proteolytic cleavage that releases its intracellular domain (AICD, App intracellular domain) to the nucleus and its N-terminal soluble part (sApp) into the extracellular space [34]. It is thought that endogenous AICD undergoes tight temporal regulation during the differentiation of neurons and is negatively regulated by the neuron-specific c-Jun N-terminal kinase Mapk10 (Jnk3) via phosphorylation of App at Thr668, which may be important for synaptogenesis, a key event during memory formation and learning [35–37]. Our data indicate that Mani, which is down-regulated in AD brains, interferes with this AICD-mediated signalling by inducing phosphorylation of App at Thr668. It has already been reported that the phosphorylation of App at Thr668 facilitates the Bace1 mediated cleavage of App to increase Aβ generation [38]. We could not observe any increase in the expression levels of Ctfβ in Mani-transfected cells pointing that the induced phosphorylation of full length App by Mani did not induce β- and γ-secretases-mediated cleavage of App (Fig. 1F). Additionally, the observation of reduced phosphorylated Ctfβ in transfected cells indicates that Mani inhibits Ctfβ phosphorylation. It has been reported that the phosphorylation of Ctfβ at Thr668 induces its cleavage by the γ-secretase resulting in higher Aβ production [39] and our data revealed the inhibition of this phosphorylation implying that Mani inhibits Aβ production. Lastly, our data suggest that Mani might inhibit Bace1-induced cleavage of App as reported for the transmembrane protein reticulon-3 [40]. Along with elevated phosphorylation of Bcl2 this finding indicates a crucial role for Mani in controlling neuronal survival and differentiation and may prove that Mani might be a pivotal regulator in preventing the progression of AD although further experiments are needed for its validation.
Inhibition of Cdh1-APC in post-mitotic neurons does not affect neuronal survival, but specifically (depending on its phosphorylation) functions in the nucleus to control axonal growth and patterning [41–43]. We suggest that the scaffold protein Cdc27 may play an important role in the regulation of neurite outgrowth because our siRNA-mediated down-regulation of Cdc27 expression in PC12 cells facilitates neurite elongation similar to Cdh1 or Cdc20 [41, 42, 44]. Consequently, Mani, the overexpression of which retards neurite outgrowth via induction of Cdc27 expression and activity, can be seen as a positive effector of Cdc27-APC. Thus, the Mani-Cdc27-APC pathway may represent the cell-intrinsic inability of injured neurons to extend axons in the adult brain and knockdown of this cascade could overcome the extrinsic negative influence of, for instance, myelin on axon growth.
Additionally, it is tempting to speculate that Mani may play an important role in interactions between oligodendrocytes and neurons (Fig. S9), similar to the receptor of the neurite growth inhibitor Nogo. Nogo is mainly expressed as a double-transmembrane protein (N-and C-terminus inside) on oligodendrocytes and mediates neuronal growth-cone inhibition via activation of the NgR complex on neurons. The fact that deletion of NgR does not relieve myelin-mediated neurite inhibition [8, 45] and that Nogo-deficient mice are viable without any obvious neuro-anatomical phenotypes or neurological defects [46, 47] raises the possibility that there exist other proteins which may compensate NgR’s/Nogo’s absence [48]. Our findings indicate that Mani might be up-regulated in the absence of NgR to complement its signalling and thus acts as a missing link.
Our finding is of utmost importance for the treatment of various neurodegenerative diseases because till today the mechanism for the impaired regeneration of neurons, due to axonal repulsion in the CNS, is poorly understood. Interfering with the Mani-Cdc27 signalling pathway might be a new key strategy to increase regeneration in the CNS. However, further studies, such as those employing Mani-knockout mice, are necessary to elucidate the physiological function of Mani and to decipher its specific role in cell differentiation and neurite outgrowth in the nervous system in vivo.
Acknowledgments
We thank Mr. N. Ogawa and Mr. Y. Tani (both at the Choju Medical Institute, Fukushimura Hospital), Ms. N. Inoue (Osaka University Hospital) and Dr. O. Islam (School of Biological Sciences, NTU) for technical assistance as well as Dr. H. Ikari, Dr. T. Kato, Dr. T. Sato and Dr. K. Fujimoto (all at the Choju Medical Institute, Fukushimura Hospital) for patient care, sampling and tissue data acquisition. We also thank Prof. Dr. T. Sawada (Koshokai Aino Hospital, Osaka) for helpful discussions. This study was supported by the Brain Function Research Institute, Inc. (Osaka, Japan) and by an A*STAR grant (BMRC/04/1/22/19/360) to KH.
Supporting Information
Characteristic features of the MANI protein.Aligned protein sequences of MANI in the human (Hum) and mouse(Mou) species; red letters denote varying amino acids. A highdegree of sequence conservation amongst various species indicatesMANI’s high functional significance (A).Bio-informatic analyses of MANI protein sequence revealed severalpotential motifs including two transmembrane domains, the presenceof an opioid growth factor receptor like domain, a Met-1acetylation site and a potential PKC phosphorylation site. Noenzyme activity motif could be detected. MANI seems to be aprototype of a new protein family. The Ser-6 phosphorylation[20] confirms the model of a cytoplasmicN-terminus and two transmembrane domains. As other proline-richmembrane-associated proteins MANI is highly glycosylated (Fig. S4)(B).
Fig. S2 Mani-GFP expression in PC12 cells for Maniantibody specificity check. A Mani-GFP expression construct wasgenerated by inserting the Mani cDNA in-frame with GFP(pcDNA3.1CT-GFP-TOPO®, Invitrogen) at the C-terminusof Mani (Mani-CT-GFP). PC12 cells were transiently transfected withthe Mani-CT-GFP expression vector or empty plasmid (controls, C)using the Lipofectamine™ 2000 (Invitrogen) transfectionreagent according to the manufacturer’s protocol. Thetransfected cells were then prepared for Western blot analysis. AsPC12 cells also express endogenous Mani protein, the Mani antibodydetects both the endogenous Mani protein and the overexpressedMani-GFP fusion protein in the transfected cells at the same levelas the anti-GFP antibody.
Fig. S3 Tissue-specific Mani expression. Data areextracted from ‘BioGPS’ at http://biogps.gnf.org/#goto=genereport&id=130074.
Fig. S4 Mani is glycosylated. Protein lysates (PC12 cellsor total mouse brain) were treated either with N- or O-glycosidaseas described in ‘Materials and methods’. Thereafter,Western blot was performed indicating that Mani is N-glycosylated.Lane-1: PC12 cell lysate, lane-2: PC12 cell lysate +N-glycosidase, lane-3: PC12 cell lysate + O-glycosidase,lane-4: total mouse brain tissue lysate, Lane-5: total mouse braintissue lysate + N-glycosidase, lane-6: total mouse braintissue lysate + O-glycosidase.
Fig. S5 Specific neuronal localization of Mani in themouse brain hippocampus. Top-left: IHC of Mani, Mbp(oligoglial marker) and NeuN (neuronal cell bodies) in the mousebrain hippocampus. DAPI staining was used to illustrate neuronalnuclear/cell body location in the hippocampus CA1-CA4/DG formation.Scale bar = 500 μm. Top-right. Magnification of theCA4/DG area of Mani/Mbp co-IHC: Mani appears to co-localize(yellow) with axonal Mbp. Scale bar = 100 μm. Mid-left:Further magnification of the DG area of Mani/Mbp co-IHC: Maniappears at the cell body and co-localizes (yellow) with axonal Mbp.Scale bar = 20 μm. Mid-right: Further magnification ofanother DG/CA4 area of Mani/Mbp co-IHC confirming that Mani appearsat neuronal cell membranes. Scale bar = 20 μm.Bottom-left: Magnification of the CA1 area of Mani/Mbpco-IHC: rather no co-localization at the cell body but weak(yellow) double labelling at neuronal axons. Scale bar = 20 μm.Bottom-right: Magnification of the CA1 area of Mani/NeuNco-IHC indicates that membrane-associated Mani co-localizes withneuronal NeuN at the cell body. Scale bar = 20 μm. Over all,Mani seems to be rather of neural origin than expressed inoligoglial cells.
Fig. S6 IHC of mouse brain (coronal section). Although Th(red) is selectively expressed in dopaminergic neurons (DA) withinthe substantia nigra pars compacta (SNpc) and the ventraltegmental area (VTA), Mani shows a partial co-localization withTh but a stronger expression within the PAG surrounding theaqueduct sylvius (also known as aqueductusmesencephali, or the cerebral aqueduct). The PAG plays amajor role in the descending modulation of pain and in defensivebehaviour. The ascending pain and temperature fibres of thespinothalamic tract also send information to the PAG via thespinomesencephalic tract. Stimulation of the PAG of the midbrainactivates enkephalin-releasing neurons that project to the raphenuclei in the brainstem. 5-HT (serotonin) released from theraphe nuclei descends to the dorsal horn of the spinal cordwhere it forms excitatory connections with the inhibitoryinterneurons located in Laminae II (also known as the SG, known asTh+ [21,22]). Interestingly, Mani also shows a very strongstaining in SG (Fig. S7) indicating that Mani might play a pivotalrole in the PAG–SG pathway. When activated, the interneuronsin SG release either enkephalin or dynorphin (endogenous opioidneurotransmitters), which bind to μ-opioid receptors on theaxons of incoming C- and A-γ fibres carrying pain signalsfrom nociceptors activated in the periphery. The activation of theμ-opioid receptor inhibits the release of substance P from theseincoming first-order neurons and, in turn, inhibits the activationof the second-order neuron that is responsible for transmitting thepain signal up to the spinothalamic tract to theventroposteriolateral nucleus of the thalamus(‘gate-control’ pain). Scale bar = 500 μm.
Fig. S7 IHC of the mouse spinal cord. IHC shows Mani islocalized particularly within the grey matter, especially withinthe SG. Blue, DAPI; red, NeuN; green, Mani; magenta, Mbp. Scale bar= 200 μm (A). Higher magnification of‘A’. Although NeuN is localized within the cellcytoplasm, the Mani shows a specific staining of neural cellmembranes. Scale bar = 50 μm (B).
Fig. S8 Specific subcellular localization of Mani. IHC ofMani in mouse brain cortex tissue. Black arrows indicatecell-membrane-specific staining of Mani. Scale bar = 50 μm(A). PC12 cell fractionation analysis was used to show theintracellular localization of Mani by Western blot analysis. Thedifferent cell fractions used were as follows: 1 = cytosol, 2 =membrane, 3 = nuclear, 4 = cytoskeleton. Mani was detected mainlyin the membrane fraction of PC12 cells. Gapdh (cytoplasm) and Ntrk1(transmembrane) were used as cytoplasm and membrane marker proteins(B).
Fig. S9 Schematic illustration of potential Mani (p20)activity based on the experimental and bio-informatic analyses.Mani localizes to neural membranes where it participates in intra-and inter-cellular signal transduction. Mani modulates neuronaldifferentiation and neurite outgrowth while interfering with theCdc27 and Cdc42 signalling pathways. Cdc27 distribution (cytoplasm/nucleus) depends on its phosphorylation status. Inter-cellularaction of Mani with oligodendrocytes may occur via interaction with a yet unknown ligand (Mani/p20-L, Nogo?).
Table S1 Characteristics of AD brain tissue samples
Table S2 Characteristics of PD brain tissue samples
Table S3 Mani interacting proteins
References
- 1.Selkoe DJ, Schenk D. Alzheimer’s disease: molecular understanding predicts amyloid-based therapeutics. Annu Rev Pharmacol Toxicol. 2003;43:545–84. doi: 10.1146/annurev.pharmtox.43.100901.140248. [DOI] [PubMed] [Google Scholar]
- 2.Mattson MP. Pathways towards and away from Alzheimer’s disease. Nature. 2004;430:631–9. doi: 10.1038/nature02621. [DOI] [PMC free article] [PubMed] [Google Scholar]
- 3.Heese K, Akatsu H. Alzheimer’s disease–an interactive perspective. Curr Alzheimer Res. 2006;3:109–21. doi: 10.2174/156720506776383022. [DOI] [PubMed] [Google Scholar]
- 4.Yokota T, Mishra M, Akatsu H, et al. Brain site-specific gene expression analysis in Alzheimer’s disease patients. Eur J Clin Invest. 2006;36:820–30. doi: 10.1111/j.1365-2362.2006.01722.x. [DOI] [PubMed] [Google Scholar]
- 5.Nagai Y, Ogasawara A, Heese K. Possible mechanisms of A beta(1–40)- or A beta(1–42)-induced cell death and their rescue factors. Nippon Yakurigaku Zasshi. 2004;124:135–43. doi: 10.1254/fpj.124.135. [DOI] [PubMed] [Google Scholar]
- 6.Cao Z, Gao Y, Deng K, et al. Receptors for myelin inhibitors: structures and therapeutic opportunities. Mol Cell Neurosci. 43:4–14. doi: 10.1016/j.mcn.2009.07.008. [DOI] [PubMed] [Google Scholar]
- 7.Schnaar RL, Lopez PH. Myelin-associated glycoprotein and its axonal receptors. J Neurosci Res. 2009;87:3267–76. doi: 10.1002/jnr.21992. [DOI] [PMC free article] [PubMed] [Google Scholar]
- 8.Zheng B, Atwal J, Ho C, et al. Genetic deletion of the Nogo receptor does not reduce neurite inhibition in vitro or promote corticospinal tract regeneration in vivo. Proc Natl Acad Sci USA. 2005;102:1205–10. doi: 10.1073/pnas.0409026102. [DOI] [PMC free article] [PubMed] [Google Scholar]
- 9.Giger RJ, Venkatesh K, Chivatakarn O, et al. Mechanisms of CNS myelin inhibition: evidence for distinct and neuronal cell type specific receptor systems. Restor Neurol Neurosci. 2008;26:97–115. [PMC free article] [PubMed] [Google Scholar]
- 10.Braak H, Braak E. Neuropathological stageing of Alzheimer-related changes. Acta Neuropathol. 1991;82:239–59. doi: 10.1007/BF00308809. [DOI] [PubMed] [Google Scholar]
- 11.Mirra SS, Heyman A, McKeel D, et al. The Consortium to Establish a Registry for Alzheimer’s Disease (CERAD). Part II. Standardization of the neuropathologic assessment of Alzheimer’s disease. Neurology. 1991;41:479–86. doi: 10.1212/wnl.41.4.479. [DOI] [PubMed] [Google Scholar]
- 12.Akatsu H, Takahashi M, Matsukawa N, et al. Subtype analysis of neuropathologically diagnosed patients in a Japanese geriatric hospital. J Neurol Sci. 2002;196:63–9. doi: 10.1016/s0022-510x(02)00028-x. [DOI] [PubMed] [Google Scholar]
- 13.Akatsu H, Yamagata H, Chen Y, et al. TAFI polymorphisms at amino acids 147 and 325 are not risk factors for cerebral infarction. Br J Haematol. 2004;127:440–7. doi: 10.1111/j.1365-2141.2004.05219.x. [DOI] [PubMed] [Google Scholar]
- 14.Heese K, Yamada T, Akatsu H, et al. Characterizing the new transcription regulator protein p60TRP. J Cell Biochem. 2004;91:1030–42. doi: 10.1002/jcb.20010. [DOI] [PubMed] [Google Scholar]
- 15.Heese K, Otten U, Mathivet P, et al. GABA(B) receptor antagonists elevate both mRNA and protein levels of the neurotrophins nerve growth factor (NGF) and brain-derived neurotrophic factor (BDNF) but not neurotrophin-3 (NT-3) in brain and spinal cord of rats. Neuropharmacology. 2000;39:449–62. doi: 10.1016/s0028-3908(99)00166-5. [DOI] [PubMed] [Google Scholar]
- 16.Islam O, Gong X, Rose-John S, et al. Interleukin-6 and neural stem cells: more than gliogenesis. Mol Biol Cell. 2009;20:188–99. doi: 10.1091/mbc.E08-05-0463. [DOI] [PMC free article] [PubMed] [Google Scholar]
- 17.Islam O, Loo TX, Heese K. Brain-derived neurotrophic factor (BDNF) has proliferative effects on neural stem cells through the truncated TRK-B receptor, MAP kinase, AKT, and STAT-3 signaling pathways. Curr Neurovasc Res. 2009;6:42–53. doi: 10.2174/156720209787466028. [DOI] [PubMed] [Google Scholar]
- 18.Nehar S, Mishra M, Heese K. Identification and characterisation of the novel amyloid-beta peptide-induced protein p17. FEBS Lett. 2009;583:3247–53. doi: 10.1016/j.febslet.2009.09.018. [DOI] [PubMed] [Google Scholar]
- 19.Shen Y, Inoue N, Heese K. Neurotrophin-4 (Ntf4) mediates neurogenesis in mouse embryonic neural stem cells through the inhibition of the signal transducer and activator of transcription-3 (Stat3) and the modulation of the activity of protein kinase B. Cell Mol Neurobiol. 2010 doi: 10.1007/s10571-010-9520-1. 10.1007/s10571-010-9520-1. [DOI] [PubMed] [Google Scholar]
- 20.Menon KN, Ikeda T, Fujimoto I, et al. Changes in N-linked sugar chain patterns induced by moderate-to-high expression of the galactosyltransferase I gene in a brain-derived cell line, CG4. J Neurosci Res. 2005;80:29–36. doi: 10.1002/jnr.20416. [DOI] [PubMed] [Google Scholar]
- 21.Gotz R. Regulation of neuronal cell death and differentiation by NGF and IAP family members. J Neural Transm Suppl. 2000:247–59. doi: 10.1007/978-3-7091-6301-6_16. [DOI] [PubMed] [Google Scholar]
- 22.Huang EJ, Reichardt LF. Neurotrophins: roles in neuronal development and function. Annu Rev Neurosci. 2001;24:677–736. doi: 10.1146/annurev.neuro.24.1.677. [DOI] [PMC free article] [PubMed] [Google Scholar]
- 23.Deng X, Gao F, Flagg T, et al. Mono- and multisite phosphorylation enhances Bcl2’s antiapoptotic function and inhibition of cell cycle entry functions. Proc Natl Acad Sci USA. 2004;101:153–8. doi: 10.1073/pnas.2533920100. [DOI] [PMC free article] [PubMed] [Google Scholar]
- 24.Ng YP, Cheung ZH, Ip NY. STAT3 as a downstream mediator of Trk signaling and functions. J Biol Chem. 2006;281:15636–44. doi: 10.1074/jbc.M601863200. [DOI] [PubMed] [Google Scholar]
- 25.Gu F, Hata R, Ma YJ, et al. Suppression of Stat3 promotes neurogenesis in cultured neural stem cells. J Neurosci Res. 2005;81:163–71. doi: 10.1002/jnr.20561. [DOI] [PubMed] [Google Scholar]
- 26.Bang OS, Park EK, Yang SI, et al. Overexpression of Akt inhibits NGF-induced growth arrest and neuronal differentiation of PC12 cells. J Cell Sci. 2001;114:81–8. doi: 10.1242/jcs.114.1.81. [DOI] [PubMed] [Google Scholar]
- 27.Mori N, Morii H. SCG10-related neuronal growth-associated proteins in neural development, plasticity, degeneration, and aging. J Neurosci Res. 2002;70:264–73. doi: 10.1002/jnr.10353. [DOI] [PubMed] [Google Scholar]
- 28.Ng DC, Lin BH, Lim CP, et al. Stat3 regulates microtubules by antagonizing the depolymerization activity of stathmin. J Cell Biol. 2006;172:245–57. doi: 10.1083/jcb.200503021. [DOI] [PMC free article] [PubMed] [Google Scholar]
- 29.Yoshimura T, Arimura N, Kaibuchi K. Signaling networks in neuronal polarization. J Neurosci. 2006;26:10626–30. doi: 10.1523/JNEUROSCI.3824-06.2006. [DOI] [PMC free article] [PubMed] [Google Scholar]
- 30.Yan GZ, Ziff EB. NGF regulates the PC12 cell cycle machinery through specific inhibition of the Cdk kinases and induction of cyclin D1. J Neurosci. 1995;15:6200–12. doi: 10.1523/JNEUROSCI.15-09-06200.1995. [DOI] [PMC free article] [PubMed] [Google Scholar]
- 31.Prigent C, Dimitrov S. Phosphorylation of serine 10 in histone H3, what for. J Cell Sci. 2003;116:3677–85. doi: 10.1242/jcs.00735. [DOI] [PubMed] [Google Scholar]
- 32.Sumrejkanchanakij P, Tamamori-Adachi M, Matsunaga Y, et al. Role of cyclin D1 cytoplasmic sequestration in the survival of postmitotic neurons. Oncogene. 2003;22:8723–30. doi: 10.1038/sj.onc.1206870. [DOI] [PubMed] [Google Scholar]
- 33.Boutin C, Schmitz B, Cremer H, et al. NCAM expression induces neurogenesis in vivo. Eur J Neurosci. 2009;30:1209–18. doi: 10.1111/j.1460-9568.2009.06928.x. [DOI] [PubMed] [Google Scholar]
- 34.Ebinu JO, Yankner BA. A RIP tide in neuronal signal transduction. Neuron. 2002;34:499–502. doi: 10.1016/s0896-6273(02)00704-3. [DOI] [PubMed] [Google Scholar]
- 35.Ando K, Oishi M, Takeda S, et al. Role of phosphorylation of Alzheimer’s amyloid precursor protein during neuronal differentiation. J Neurosci. 1999;19:4421–7. doi: 10.1523/JNEUROSCI.19-11-04421.1999. [DOI] [PMC free article] [PubMed] [Google Scholar]
- 36.Kimberly WT, Zheng JB, Town T, et al. Physiological regulation of the beta-amyloid precursor protein signaling domain by c-Jun N-terminal kinase JNK3 during neuronal differentiation. J Neurosci. 2005;25:5533–43. doi: 10.1523/JNEUROSCI.4883-04.2005. [DOI] [PMC free article] [PubMed] [Google Scholar]
- 37.Zou L, Wang Z, Shen L, et al. Receptor tyrosine kinases positively regulate BACE activity and Amyloid-beta production through enhancing BACE internalization. Cell Res. 2007;17:389–401. doi: 10.1038/cr.2007.5. [DOI] [PubMed] [Google Scholar]
- 38.Lee MS, Kao SC, Lemere CA, et al. APP processing is regulated by cytoplasmic phosphorylation. J Cell Biol. 2003;163:83–95. doi: 10.1083/jcb.200301115. [DOI] [PMC free article] [PubMed] [Google Scholar]
- 39.Vingtdeux V, Hamdane M, Gompel M, et al. Phosphorylation of amyloid precursor carboxy-terminal fragments enhances their processing by a gamma-secretase-dependent mechanism. Neurobiol Dis. 2005;20:625–37. doi: 10.1016/j.nbd.2005.05.004. [DOI] [PubMed] [Google Scholar]
- 40.He W, Lu Y, Qahwash I, et al. Reticulon family members modulate BACE1 activity and amyloid-beta peptide generation. Nat Med. 2004;10:959–65. doi: 10.1038/nm1088. [DOI] [PubMed] [Google Scholar]
- 41.Konishi Y, Stegmuller J, Matsuda T, et al. Cdh1-APC controls axonal growth and patterning in the mammalian brain. Science. 2004;303:1026–30. doi: 10.1126/science.1093712. [DOI] [PubMed] [Google Scholar]
- 42.Kim AH, Bonni A. Thinking within the D box: initial identification of Cdh1-APC substrates in the nervous system. Mol Cell Neurosci. 2007;34:281–7. doi: 10.1016/j.mcn.2006.11.019. [DOI] [PubMed] [Google Scholar]
- 43.Huynh MA, Stegmuller J, Litterman N, et al. Regulation of Cdh1-APC function in axon growth by Cdh1 phosphorylation. J Neurosci. 2009;29:4322–7. doi: 10.1523/JNEUROSCI.5329-08.2009. [DOI] [PMC free article] [PubMed] [Google Scholar]
- 44.Kim AH, Puram SV, Bilimoria PM, et al. A centrosomal Cdc20-APC pathway controls dendrite morphogenesis in postmitotic neurons. Cell. 2009;136:322–36. doi: 10.1016/j.cell.2008.11.050. [DOI] [PMC free article] [PubMed] [Google Scholar]
- 45.Chivatakarn O, Kaneko S, He Z, et al. The Nogo-66 receptor NgR1 is required only for the acute growth cone-collapsing but not the chronic growth-inhibitory actions of myelin inhibitors. J Neurosci. 2007;27:7117–24. doi: 10.1523/JNEUROSCI.1541-07.2007. [DOI] [PMC free article] [PubMed] [Google Scholar]
- 46.Teng FY, Ling BM, Tang BL. Inter- and intracellular interactions of Nogo: new findings and hypothesis. J Neurochem. 2004;89:801–6. doi: 10.1111/j.1471-4159.2004.02366.x. [DOI] [PubMed] [Google Scholar]
- 47.Teng FY, Tang BL. Cell autonomous function of Nogo and reticulons: the emerging story at the endoplasmic reticulum. J Cell Physiol. 2008;216:303–8. doi: 10.1002/jcp.21434. [DOI] [PubMed] [Google Scholar]
- 48.Atwal JK, Pinkston-Gosse J, Syken J, et al. PirB is a functional receptor for myelin inhibitors of axonal regeneration. Science. 2008;322:967–70. doi: 10.1126/science.1161151. [DOI] [PubMed] [Google Scholar]
Associated Data
This section collects any data citations, data availability statements, or supplementary materials included in this article.
Supplementary Materials
Characteristic features of the MANI protein.Aligned protein sequences of MANI in the human (Hum) and mouse(Mou) species; red letters denote varying amino acids. A highdegree of sequence conservation amongst various species indicatesMANI’s high functional significance (A).Bio-informatic analyses of MANI protein sequence revealed severalpotential motifs including two transmembrane domains, the presenceof an opioid growth factor receptor like domain, a Met-1acetylation site and a potential PKC phosphorylation site. Noenzyme activity motif could be detected. MANI seems to be aprototype of a new protein family. The Ser-6 phosphorylation[20] confirms the model of a cytoplasmicN-terminus and two transmembrane domains. As other proline-richmembrane-associated proteins MANI is highly glycosylated (Fig. S4)(B).
Fig. S2 Mani-GFP expression in PC12 cells for Maniantibody specificity check. A Mani-GFP expression construct wasgenerated by inserting the Mani cDNA in-frame with GFP(pcDNA3.1CT-GFP-TOPO®, Invitrogen) at the C-terminusof Mani (Mani-CT-GFP). PC12 cells were transiently transfected withthe Mani-CT-GFP expression vector or empty plasmid (controls, C)using the Lipofectamine™ 2000 (Invitrogen) transfectionreagent according to the manufacturer’s protocol. Thetransfected cells were then prepared for Western blot analysis. AsPC12 cells also express endogenous Mani protein, the Mani antibodydetects both the endogenous Mani protein and the overexpressedMani-GFP fusion protein in the transfected cells at the same levelas the anti-GFP antibody.
Fig. S3 Tissue-specific Mani expression. Data areextracted from ‘BioGPS’ at http://biogps.gnf.org/#goto=genereport&id=130074.
Fig. S4 Mani is glycosylated. Protein lysates (PC12 cellsor total mouse brain) were treated either with N- or O-glycosidaseas described in ‘Materials and methods’. Thereafter,Western blot was performed indicating that Mani is N-glycosylated.Lane-1: PC12 cell lysate, lane-2: PC12 cell lysate +N-glycosidase, lane-3: PC12 cell lysate + O-glycosidase,lane-4: total mouse brain tissue lysate, Lane-5: total mouse braintissue lysate + N-glycosidase, lane-6: total mouse braintissue lysate + O-glycosidase.
Fig. S5 Specific neuronal localization of Mani in themouse brain hippocampus. Top-left: IHC of Mani, Mbp(oligoglial marker) and NeuN (neuronal cell bodies) in the mousebrain hippocampus. DAPI staining was used to illustrate neuronalnuclear/cell body location in the hippocampus CA1-CA4/DG formation.Scale bar = 500 μm. Top-right. Magnification of theCA4/DG area of Mani/Mbp co-IHC: Mani appears to co-localize(yellow) with axonal Mbp. Scale bar = 100 μm. Mid-left:Further magnification of the DG area of Mani/Mbp co-IHC: Maniappears at the cell body and co-localizes (yellow) with axonal Mbp.Scale bar = 20 μm. Mid-right: Further magnification ofanother DG/CA4 area of Mani/Mbp co-IHC confirming that Mani appearsat neuronal cell membranes. Scale bar = 20 μm.Bottom-left: Magnification of the CA1 area of Mani/Mbpco-IHC: rather no co-localization at the cell body but weak(yellow) double labelling at neuronal axons. Scale bar = 20 μm.Bottom-right: Magnification of the CA1 area of Mani/NeuNco-IHC indicates that membrane-associated Mani co-localizes withneuronal NeuN at the cell body. Scale bar = 20 μm. Over all,Mani seems to be rather of neural origin than expressed inoligoglial cells.
Fig. S6 IHC of mouse brain (coronal section). Although Th(red) is selectively expressed in dopaminergic neurons (DA) withinthe substantia nigra pars compacta (SNpc) and the ventraltegmental area (VTA), Mani shows a partial co-localization withTh but a stronger expression within the PAG surrounding theaqueduct sylvius (also known as aqueductusmesencephali, or the cerebral aqueduct). The PAG plays amajor role in the descending modulation of pain and in defensivebehaviour. The ascending pain and temperature fibres of thespinothalamic tract also send information to the PAG via thespinomesencephalic tract. Stimulation of the PAG of the midbrainactivates enkephalin-releasing neurons that project to the raphenuclei in the brainstem. 5-HT (serotonin) released from theraphe nuclei descends to the dorsal horn of the spinal cordwhere it forms excitatory connections with the inhibitoryinterneurons located in Laminae II (also known as the SG, known asTh+ [21,22]). Interestingly, Mani also shows a very strongstaining in SG (Fig. S7) indicating that Mani might play a pivotalrole in the PAG–SG pathway. When activated, the interneuronsin SG release either enkephalin or dynorphin (endogenous opioidneurotransmitters), which bind to μ-opioid receptors on theaxons of incoming C- and A-γ fibres carrying pain signalsfrom nociceptors activated in the periphery. The activation of theμ-opioid receptor inhibits the release of substance P from theseincoming first-order neurons and, in turn, inhibits the activationof the second-order neuron that is responsible for transmitting thepain signal up to the spinothalamic tract to theventroposteriolateral nucleus of the thalamus(‘gate-control’ pain). Scale bar = 500 μm.
Fig. S7 IHC of the mouse spinal cord. IHC shows Mani islocalized particularly within the grey matter, especially withinthe SG. Blue, DAPI; red, NeuN; green, Mani; magenta, Mbp. Scale bar= 200 μm (A). Higher magnification of‘A’. Although NeuN is localized within the cellcytoplasm, the Mani shows a specific staining of neural cellmembranes. Scale bar = 50 μm (B).
Fig. S8 Specific subcellular localization of Mani. IHC ofMani in mouse brain cortex tissue. Black arrows indicatecell-membrane-specific staining of Mani. Scale bar = 50 μm(A). PC12 cell fractionation analysis was used to show theintracellular localization of Mani by Western blot analysis. Thedifferent cell fractions used were as follows: 1 = cytosol, 2 =membrane, 3 = nuclear, 4 = cytoskeleton. Mani was detected mainlyin the membrane fraction of PC12 cells. Gapdh (cytoplasm) and Ntrk1(transmembrane) were used as cytoplasm and membrane marker proteins(B).
Fig. S9 Schematic illustration of potential Mani (p20)activity based on the experimental and bio-informatic analyses.Mani localizes to neural membranes where it participates in intra-and inter-cellular signal transduction. Mani modulates neuronaldifferentiation and neurite outgrowth while interfering with theCdc27 and Cdc42 signalling pathways. Cdc27 distribution (cytoplasm/nucleus) depends on its phosphorylation status. Inter-cellularaction of Mani with oligodendrocytes may occur via interaction with a yet unknown ligand (Mani/p20-L, Nogo?).
Table S1 Characteristics of AD brain tissue samples
Table S2 Characteristics of PD brain tissue samples
Table S3 Mani interacting proteins