Abstract
The circadian clock in peripheral tissues can be entrained by restricted feeding (RF), a regimen that restricts the duration of food availability with no calorie restriction (CR). However, it is not known whether RF can delay the occurrence of age-associated changes similar to CR. We measured circadian expression of clock genes, disease marker genes, metabolic factors and inflammatory and allergy markers in mouse serum, liver, jejunum and white adipose tissue (WAT) after long-term RF of 4 months. We found that circadian rhythmicity is more robust and is phase advanced in most of the genes and proteins tested under RF. In addition, average daily levels of some disease and inflammatory markers were reduced under RF, including liver Il-6 mRNA, tumour necrosis factor (TNF)-α and nuclear factor κB (NF-κB) protein; jejunum Arginase, Afp, Gadd45β, Il-1α and Il-1β mRNA, and interleukin (IL)-6 and TNF-α protein and WAT Il-6, Il-1β, Tnfα and Nfκb mRNA. In contrast, the anti-inflammatory cytokine Il-10 mRNA increased in the liver and jejunum. Our results suggest that RF may share some benefits with those of CR. As RF is a less harsh regimen to follow than CR, the data suggest it could be proposed for individuals seeking to improve their health.
Keywords: restricted feeding, inflammation, metabolism, disease, circadian
Introduction
The master clock located in the suprachiasmatic nuclei (SCN) of the anterior hypothalamus regulates circadian rhythms in mammals. A critical feature of circadian timing is the ability of the clockwork to be reset by light with the retinohypothalamic tract being the principal pathway through which entrainment information reaches the SCN [1]. Synchronization among SCN neurons leads to coordinated circadian outputs from the nuclei, ultimately regulating bodily rhythms. Similar clock oscillators are also found in peripheral tissues, such as the liver, intestine, retina, heart and pancreas [2, 3]. The clock mechanism in both SCN neurons and peripheral tissues consists of the transcription factors CLOCK (circadian locomotor output cycles kaput) and BMAL1 (brain and muscle Arnt-like 1) that heterodimerize and bind to E-box sequences to mediate transcription of a large number of genes, including Periods (Per1, Per2, Per3) and Cryptochromes (Cry1, Cry2). PERs and CRYs constitute part of the negative feedback loop, so that once they are translated, they oligomerize and translocate to the nucleus to inhibit CLOCK : BMAL1-mediated transcription [3, 4].
Feeding regimens, in addition to light, can also provide a time cue for the circadian clock. Restricted feeding (RF) limits the time and duration of food availability with no calorie reduction. Rodents receiving food ad libitum (AL) every day at the same time for about 3–5 hrs adjust to the feeding period within a few days and learn to eat most of their daily food intake during that limited time [5]. Interestingly, diurnal RF in nocturnal animals shifts many physiological activities normally dictated by the SCN in peripheral tissues, causing uncoupling from the central pacemaker in the SCN. Notably, RF effects occur even in rodents with lesioned SCN or animals kept in constant darkness (DD) [6, 7]. It is assumed that RF affects the physiology of the animal not through the SCN but through a food-entrainable oscillator (FEO) whose location has been elusive. Lesions in the dorsomedial hypothalamic nucleus [8–11], the brainstem parabrachial nuclei [9, 12] and nucleus accumbens [13, 14] revealed that these brain regions may be involved in the FEO output, but they cannot fully account for the oscillation [15]. CLOCK [16] or BMAL1 [17] and other clock proteins [18] have been shown not to be necessary for food anticipatory activity (FAA). However, it has recently been demonstrated that mPer2 mutant mice do not exhibit food anticipation [19, 20].
RF has been shown to lead to robust circadian rhythms [21]. Higher and robust amplitudes of circadian rhythms have been previously associated with aging retardation and extended life span. For instance, longevity was increased in older hamsters given foetal suprachiasmatic implants that restored higher amplitude rhythms [22, 23]. On the other hand, recent data indicate that disruption of circadian rhythms either by exogenous cues, such as shift work and sleep deprivation or by mutations in clock genes can lead to manifestations of the metabolic syndrome, as well as to certain types of cancer, coronary heart diseases, depression and overall reduced life expectancy [5, 24–32].
Other feeding regimens, such as calorie restriction (CR), which limits the amount of calories consumed to 60–70% of the daily intake, and intermittent fasting, which allows food to be available AL every other day, extend the life span of mammals and prevent aging-associated diseases [33–36]. These feeding regimens also alter physiological measures, such as body temperature and oxygen consumption [37, 38] as well as circadian rhythms [5, 39, 40]. Although RF leads to high amplitude circadian rhythms, which are considered beneficial [22, 23], it is not known whether RF resembles CR or intermittent fasting in its ability to delay the occurrence of age-associated changes, such as cancer and inflammation.
Materials and methods
Animals, treatments and tissues
Nine-week-old male C57BL/6 mice were housed in a temperature- and humidity-controlled facility (23–24°C, 60% humidity). Mice were entrained to a light–dark cycle of 12 hrs light and 12 hrs darkness (LD) for 2 weeks with food available AL. After 2 weeks of AL feeding, mice were divided into two groups and were fed either AL or had time-RF for 16 weeks. The RF group was given food only between ZT3 and ZT6 (ZT0 is the time of lights on). Daily food intake was measured, and body weight was monitored once weekly throughout the experiment. Average food consumption in the eighth week of the experiment was 3.98 ± 0.15 g and 3.38 ± 0.09 g for the AL and RF groups, respectively. Average food consumption on the 16th week of the experiment was 3.25 ± 0.14 g and 2.85 ± 0.09 g for the AL and RF groups, respectively. Food consumption was correlated with dry body mass, as previously described, i.e. correlated food intake = food consumption/body weight0.75[41]. After 4 months, mice were anesthetized with isoflurane and killed. Blood, liver, jejunum and white adipose tissue (WAT) were removed every 3 hrs around the circadian cycle in total darkness (DD) under dim red light to avoid masking effects by light. Blood was left to coagulate at room temperature for 2 hrs, centrifuged for 10 min. at 1500 × g, and stored at −80°C until further analysis. Tissues were immediately frozen in liquid nitrogen and stored at −80°C until further analysis. Mice were humanely killed at the end of the experiment. All animal experimentation conducted in this study was approved by the joint ethics committee (IACUC) of the Hebrew University and Hadassah Medical Center.
Animal locomotor activity
Mice from the AL and RF groups were housed individually in 17.5 × 28 × 13 cm plastic cages. After 14 days in 12:12 light–dark, mice were put in total darkness (DD) for 16 days. General activity was monitored using a system composed of infrared detectors (Intrusion detector model MH10) (Crow group, Airport City, Israel) that were placed above each cage and connected to a computer [42]. Data were collected continuously using ADAMView software (Advantech, Milpitas, CA, USA), at 6 min. intervals. Double plotted actograms were generated using Actogram software, kindly provided by Refinetti R., University of South Carolina.
RNA extraction and quantitative real-time PCR
For gene expression analyses, RNA was extracted from liver, jejunum and WAT using TRI Reagent (Sigma, Rehovot, Israel). Total RNA was DNase I-treated using RQ1 DNase (Promega, Madison, WI) for 2 hrs at 37°C, as was previously described [43, 44]. Two micrograms of DNase I-treated RNA were reverse-transcribed using MMuLV reverse transcriptase (Promega) and random hexamers. One-twentieth of the reaction was then subjected to quantitative real-time PCR using primers spanning exon–exon boundaries and the ABI Prism 7300 Sequence Detection System (Applied Biosystems, Foster City, CA, USA). Primers for all genes were tested alongside the normalizing gene glyceraldehyde 3 phosphate dehydrogenase (Gapdh). The primers used are shown in Table S1. Primers were designed with Primer Express v.2 (Applied Biosystems) and validated by a standard curve and dissociation curve of the product. The fold change in target gene expression was calculated by the 2−ΔΔCt relative quantification method (Applied Biosystems).
Western blot analysis
Liver, jejunum and WAT samples (∼200 mg) were homogenized in 1 ml lysis buffer (pH 7.8, 20 mM Tris, 145 mM NaCl, 5% glycerol, 1% Triton X-100, 50 nM phenylmethylsulfonyl fluoride (PMSF), 50 μM sodium fluoride (NaF), 10 μM sodium orthovanadate (Na3VO4), 50 ng/ml aprotinin, 100 ng/ml leupeptin, 0.8 μg/ml trypsin inhibitor [Sigma]). Nuclear extracts from liver tissue were prepared as was previously described [45]. Briefly, liver tissue was homogenized in hypotonic buffer [20 mM 4-(2-hydroxyethyl)-1-piperazineethanesulfonic acid (HEPES), 10 mM KCl, 1 mM MgCl2, 0.5 mM dithiothreitol (DTT), 0.1% Triton X-100, 20% (w/v) glycerol, 2 mM PMSF, 50 ng/ml aprotinin, 100 ng/ml leupeptin, 0.8 μg/ml trypsin inhibitor [Sigma]) followed by centrifugation at 1600 × g for 5 min. Pellets were resuspended in hypertonic buffer (20 mM HEPES, 10 mM KCl, 1 mM MgCl2, 0.5 mM dithiothreitol, 0.1% Triton X-100, 20% glycerol, 2 mM PMSF, 420 mM NaCl and 50 ng/ml aprotinin, 100 ng/ml leupeptin, 0.8 μg/ml trypsin inhibitor [Sigma]) and incubated on a shaker for 20 min. at 4°C. Subsequently, the samples were centrifuged at 35,000 × g for 10 min. and the supernatant was collected. Samples (50 μg total protein/lane for all proteins, except 200 μg/lane for tumour necrosis factor [TNF]α and interleukin [IL]-6) were run onto an SDS-PAGE [14% for TNF-α and IL-6, 10% for AMP-activated protein kinase (AMPK), pAMPK and sirtuin 1 (SIRT1), 8% for nuclear factor κB (NF-κB)]. After electrophoresis, proteins were semi-dry transferred onto nitrocellulose membranes. Blots were incubated with rabbit antimouse AMPK/pAMPK polyclonal antibody (Cell Signaling Technology, Beverly, MA, USA), rabbit antimouse SIRT1 polyclonal antibody (Millipore, Temecula, CA, USA), rabbit antimouse NF-κB p65 subunit polyclonal antibody (Santa Cruz Biotechnologies, Santa Cruz, CA, USA), rat antimouse TNF-α monoclonal antibody or rat antimouse IL-6 monoclonal antibody (BioLegend, San Diego, CA, USA). Mouse monoclonal antibody (MP Biomedicals, Solon, OH, USA) was used to detect actin the loading control. Reacted membranes were washed and reacted with horseradish peroxidase-conjugated secondary antibodies, anti-rabbit (Cell Signaling Technology), anti-rat and antimouse (Jackson ImmunoResearch, West Groove, PA, USA). The immune reaction was detected by enhanced chemiluminescence (Santa Cruz Biotechnologies). Finally, bands were quantified by scanning and densitometry and expressed as arbitrary units.
Serum protein analyses
Serum protein levels of c-reactive protein (CRP), plasminogen activator inhibitor 1 (PAI-1) and IL-6 were determined by MILLIPLEX™ Multiplex-Luminex Panel assay (Millipore, Billerica, MA, USA). Assays were performed according to the manufacturers’ instructions.
Enzymatic colorimetric test
Serum triglycerides and cholesterol as well as alanine aminotransferase (ALT) and aspartate transaminase (AST) protein levels were determined by Cobas® kits (Burgess Hill, UK) and analysed in a Roche/Hitachi analyser (Roche Diagnostics, Indianapolis, IN, USA). Assays were performed according to the manufacturers’ instructions.
Statistical analyses
All results are expressed as means ± S.E. For the evaluation of significant differences under RF, a Student’s t-test was performed. For all analyses, the significance level was set at P < 0.05. A one-way anova (time of day) was performed to analyse circadian pattern with several time-points. Statistical analysis was performed with JMP software (version 5.1) (SAS Institute, Inc., Cary, NC, USA). Further analysis of circadian rhythmicity was done using Acro software (version 3.5), Circadian Rhythm Laboratory, University of South Carolina, Walterboro, SC, USA.
Results
To examine the impact of long-term RF on circadian rhythms and overall marker levels, mice were fed regular chow for 3 hrs everyday at the same time for 16 weeks and were compared to mice fed AL. A 4 month period of time allows circadian rhythms and aging-related biomarkers to change and stabilize [46, 47]. The expression levels of several clock genes, disease, inflammation, allergic and metabolic markers were analysed in the serum, liver, jejunum and WAT. We used several time-points throughout the circadian cycle to measure oscillation as well as average daily levels for better assessment of total protein and mRNA levels under AL and RF.
Body weight and food intake under AL and RF
Both AL and RF groups gained weight throughout the experiment. Nevertheless, the mean body weight of the RF group was lower than that of the AL group. This difference started during the adjustment period to the RF and persisted throughout the experiment (Fig. 1A). The final mean body weight of the RF group was significantly lower (27.3 ± 0.4 g) than that of the AL group (29.8 ± 0.5 g) (Student’s t-test, P < 0.01). To test the reduction in body weight, we corrected food consumption to body mass. Average food intake to total body mass ratio was 0.109 and 0.104 for the AL and RF group, respectively, yielding a 95.4% food consumption of the RF group compared to that of the AL group. Average food intake to dry mass ratio was 0.254 and 0.238 for AL and RF group, respectively, yielding a 93.6% food consumption of the RF group compared to that the AL group.
Fig 1.
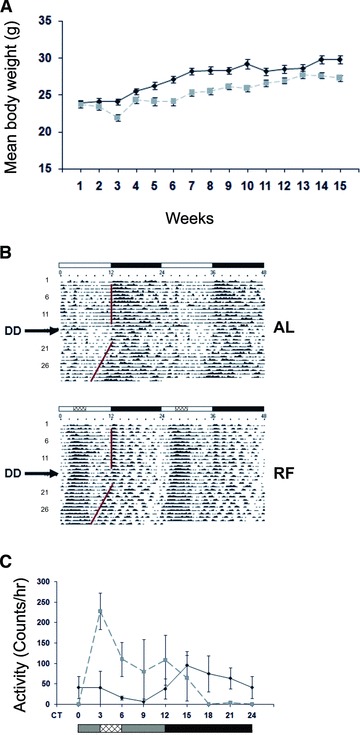
Body weight and locomotor activity of mice fed AL or RF. (A) Mean body weight during AL and RF. After 2 weeks of AL food availability, food was given either AL or restricted in time for only 3 hrs between ZT3 and ZT6. Body weight of mice fed AL (solid black line) or RF (dashed grey line) diet was measured at the end of each week throughout the experiment. Values are means ± S.E., n = 4 for each time-point in each group. (B) Representative double-plotted actograms of AL- and RF-fed mice. The white and black bars designate the light and dark periods, respectively. Food availability during RF is marked by the crosshatched box. DD indicates the day on which mice were put in total darkness. (C) Animal locomotor activity of mice fed AL (solid black line) or RF (dashed grey line) during the first day in DD. The grey and black bars designate the subjective day and night, respectively. Food availability during RF is marked by the crosshatched box.
Effect of RF on locomotor activity
RF led to a change in mouse locomotor activity (Fig. 1B). Before the time of food availability, mice displayed FAA (Fig. 1B, C). Although activity of AL mice initiated at the beginning of the dark phase and was mainly nocturnal, RF-treated mice were mainly diurnal. FAA was also seen under total darkness (DD), in addition to free-running behaviour with a period of 23.7 hrs under both AL and RF (Fig. 1B, C). Nevertheless, total activity during 24 hrs was not affected by the RF regimen compared with that of AL feeding (data not shown).
Effect of RF on clock genes
To study the circadian clock of mice under AL and RF, we tested the phase and amplitude of the clock genes Per1, Per2, Cry1, Bmal1 and Clock at the mRNA level in mouse liver and jejunum. Analysis revealed that all clock genes oscillated robustly in both AL and RF groups (P < 0.05, one-way anova, Acro) (Fig. 2; Table S2). RF caused a phase advance in the expression of clock genes (Fig. 2). In addition, most clock genes exhibited higher amplitude expression under RF compared to AL. These results demonstrate the dominance of the RF regimen over the SCN clock in peripheral tissues.
Fig 2.
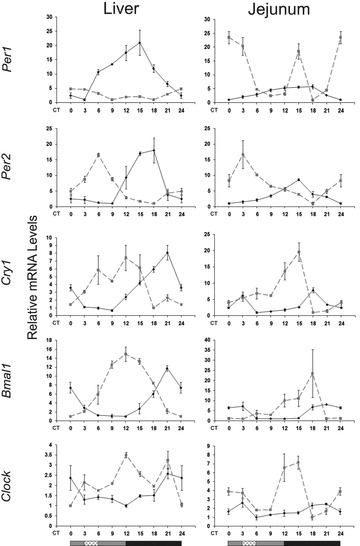
Circadian rhythms of clock genes in the liver and jejunum of AL- and RF-fed mice. Liver and jejunum were collected every 3 hrs around the circadian cycle from mice fed either AL (solid black line) or RF (dashed grey line). Food availability during RF is marked by the crosshatched box. mRNA was quantified by real-time PCR. Clock gene levels were normalized using Gapdh as the reference gene. The grey and black bars designate the subjective day and night, respectively. Values are means ± S.E., n = 4 for each time-point in each group.
Effect of RF on metabolic markers
Several key proteins that respond to energy balance changes in the cell, e.g. AMP- AMPK, nicotinamide adenine dinucleotide (NAD)+-dependent histone deacetylase SIRT1, peroxisome proliferator-activated receptor α (PPARα), PPAR-γ and PPAR-γ co-activator 1α (PGC-1α), have recently been shown to play a key role in the core clock mechanism [reviewed in 48, 49]. To examine the impact of RF on these key metabolic factors, we measured AMPK, SIRT1, PPAR-α, PPAR-γ and PGC-1α oscillation, expression amplitude, and phase around the circadian cycle.
In the liver and jejunum, under AL, Ampk mRNA oscillation (P < 0.05, one-way anova) peaked during the light phase, the time of inactivity, whereas under RF, it peaked before food availability (P < 0.0001, one-way anova, Acro) (Fig. 3; Table S2). No oscillation could be detected in WAT. Liver AMPK protein oscillated under RF (P < 0.01, one-way anova) (Fig. 4; Table S3) with a phase delay compared to its mRNA (Fig. 3), as expected for the lag between transcription and translation. Interestingly, even the active phosphorylated form, pAMPK, exhibited circadian oscillation under both treatments (P < 0.01, one-way anova) (Fig. 4; Table S3), suggesting circadian control over the AMPK kinase. Analysis of daily average levels revealed no significant effect of RF on Ampk mRNA levels in liver, jejunum and WAT or on liver protein levels (Fig. 4; Table S4). However, pAMPK, the active AMPK form, significantly increased in the liver (1.4-fold, P < 0.05, Student’s t-test) and, thus, the ratio pAMPK/AMPK, attesting to the higher overall activation of AMPK under RF.
Fig 3.
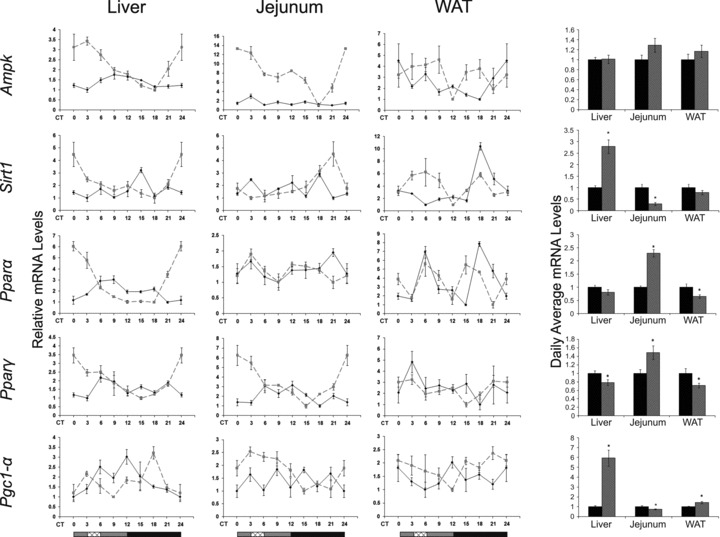
Circadian rhythms and average mRNA levels of metabolic markers in the liver, jejunum and WAT of AL- and RF-fed mice. Liver and jejunum were collected every 3 hrs around the circadian cycle from mice fed either AL (solid black line and columns) or RF (dashed grey line and grey columns). Food availability during RF is marked by the crosshatched box. mRNA was quantified by real-time PCR and is plotted as relative levels. Metabolic gene levels were normalized using Gapdh as the reference gene. For total daily levels, all time-points were averaged. The grey and black bars designate the subjective day and night, respectively. Values are means ± S.E., n = 4 for each time-point in each group. Asterisk denotes significant difference (P < 0.05).
Fig 4.
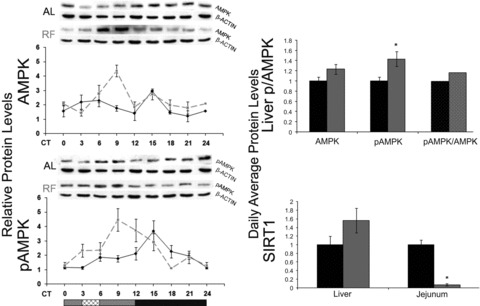
Circadian rhythms and average protein levels of AMPK, pAMPK and SIRT1 in the liver and jejunum of AL- and RF-fed mice. Liver and jejunum were collected every 3 hrs around the circadian cycle from mice fed either AL (solid black line and columns) or RF (dashed grey line and grey columns). Food availability during RF is marked by the crosshatched box. Protein was analysed by Western blotting and quantified using actin as loading control. Representative blots are shown above the figures. For total daily levels, all time-points were averaged. The grey and black bars designate the subjective day and night, respectively. Values are means ± S.E., n = 4 for each time-point in each group. Asterisk denotes significant difference (P < 0.05).
Sirt1 mRNA oscillated in the liver, jejunum and WAT under both treatments (P < 0.01, one-way anova). Liver and jejunum Sirt1 mRNA peaked towards the end of the subjective night under RF. WAT Sirt1 mRNA oscillated under AL (P < 0.0001, one-way anova) and showed a biphasic pattern under RF (Fig. 3; Table S2). Daily average Sirt1 mRNA levels were significantly up-regulated in the liver (2.8-fold, P < 0.0001, Student’s t-test) (Fig. 3; Table S4). Daily average SIRT1 protein levels in the liver showed a non-significant increase (Fig. 4) and exhibited no oscillatory pattern under AL and RF (data not shown). Conversely, jejunal Sirt1 mRNA and SIRT1 protein levels were significantly down-regulated 3- and 14-fold, respectively (P < 0.001, Student’s t-test) (Fig. 4; Table S4).
Liver Pparα mRNA oscillated under both treatments (P < 0.0001, one-way anova, Acro), with higher amplitudes under RF. WAT Pparα mRNA showed a bimodal pattern under both AL and RF. Pparα mRNA daily average levels significantly increased in the jejunum (2-fold, P < 0.0001, Student’s t-test), decreased in the WAT (1.5-fold, P < 0.05, Student’s t-test), but did not change in the liver (Fig. 4; Table S4). Pparγ mRNA oscillated in the liver (P < 0.01, one-way anova, Acro) and jejunum (P < 0.0001, one-way anova, Acro) under RF and exhibited higher amplitudes in liver and jejunum, but did not significantly oscillate in WAT. Daily average Pparγ mRNA levels significantly decreased in the liver (1.25-fold, P < 0.05, Student’s t-test) and WAT (1.4-fold, P < 0.05, Student’s t-test), but significantly increased in the jejunum (1.5-fold, P < 0.01, Student’s t-test) (Fig. 4; Table S4).
Unlike the liver (P < 0.001, one-way anova), WAT or jejunum Pgc-1α mRNA did not exhibit an oscillatory pattern under AL. Under RF, Pgc-1α mRNA in the liver peaked just before the time food was made available and in the middle of the subjective night (P < 0.001, one-way anova). Jejunum Pgc-1α mRNA peaked only before the time food was given and showed high levels throughout the subjective day (P < 0.01, one-way anova, Acro) (Fig. 3; Table S2). Daily average Pgc-1α mRNA levels in RF-fed mice significantly increased in the liver and WAT (6- and 1.4-fold, respectively, P < 0.0001, Student’s t-test), but significantly decreased in the jejunum (1.3-fold, P < 0.01, Student’s t-test) (Fig. 3; Table S4).
In light of the changes in the aforementioned key metabolic factors, we determined serum cholesterol and triglycerides levels throughout the circadian cycle. Triglycerides oscillated significantly under RF (P < 0.05, one-way anova) and in a tight correlation with food intake time (Fig. 5, Table S4). Daily average levels of cholesterol and triglycerides were significantly lower under RF (1.4- and 1.25-fold, respectively, P < 0.01, Student’s t-test) (Fig. 5, Table S4).
Fig 5.
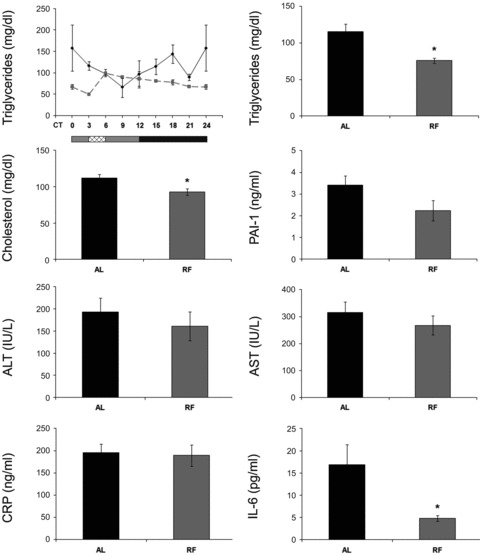
Serum levels of lipids, inflammation and disease markers of AL- and RF-fed mice. Blood was collected and serum separated for analysis every 3 hrs around the circadian cycle (triglycerides, cholesterol, IL-6, ALT and AST) or at mid-day and mid-night (CRP, PAI-1) from mice fed either AL (solid black line and columns) or RF (dashed grey line and grey columns). For triglycerides, food availability during RF is marked by the crosshatched box. Protein and lipid levels were determined by ELISA. For total daily levels, all time-points were averaged. The grey and black bars designate the subjective day and night, respectively. Values are means ± S.E., n = 3 for each time-point in each group. Asterisk denotes significant difference (P < 0.05).
Effect of RF on disease markers
We next studied the effect of RF on several disease markers by assessing their phase, amplitude and overall expression levels around the circadian cycle. We measured PAI-1, a possible marker for thrombosis and proneness to heart attacks [50]; arginase, a possible marker for colorectal cancer and liver metastases [51–55]; growth arrest and DNA damage 45β (GADD45β), a possible marker for hepatocellular carcinoma [56]; α fetoprotein (AFP), a possible marker for hepatocellular carcinoma [57]; ALT, a possible marker for non-alcoholic fatty liver and obesity [58] and AST, a possible marker for hepatotoxicity [59]. No robust oscillation at the mRNA level was observed in the expression of these disease markers except for liver Afp under RF (data not shown). ALT and ARGINASE protein levels did not oscillate as well (data not shown), suggesting that their genes are not controlled by the circadian clock. Although liver total Alt mRNA levels significantly increased (1.45-fold, P < 0.01, Student’s t-test), serum ALT and AST levels did not change (Fig. 6; Table S4). Similarly, no change was detected in average daily levels of Alt mRNA in the jejunum (Fig. 6; Table S4). However, average daily levels of jejunum Arginase, Gadd45β and Afp mRNA significantly decreased under RF (2-fold, 1.4-fold and 2-fold, respectively, P < 0.005, Student’s t-test) (Fig. 6; Table S4).
Fig 6.
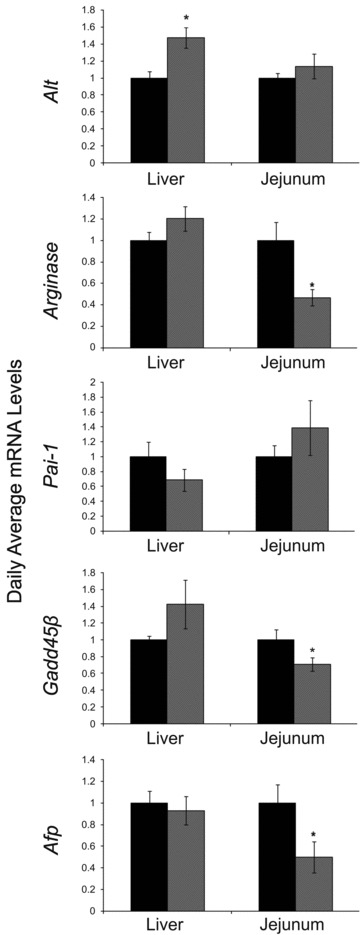
Average mRNA levels of disease markers in the liver and jejunum of AL- and RF-fed mice. Liver and jejunum were collected every 3 hrs around the circadian cycle from mice fed either AL (black columns) or RF (grey columns). mRNA was quantified by real-time PCR. Disease marker gene levels were normalized using Gapdh as the reference gene. For total daily levels, all time-points were averaged. Values are means ± S.E., n = 48 for each group. Asterisk denotes significant difference (P < 0.05).
Effect of RF on inflammation markers
We next studied the capacity of RF to affect the expression of inflammation markers and to possibly serve as an aging retardant mechanism. We assessed several well-established inflammatory markers whose levels increase as the organism ages [60–62]. The markers tested were CRP, a possible marker for inflammation and coronary heart disease [63]; NF-κB, an inflammation-mediating transcription factor; the pro-inflammatory cytokines, IL-1α, IL-1β, IL-6; TNF-α and the anti-inflammatory cytokine IL-10, for their expression amplitude, phase and overall daily levels.
Crp oscillated under AL and RF in the jejunum (P < 0.001, one-way anova) and WAT (P < 0.0001, one-way anova) (Fig. 7; Table S2). WAT Crp amplitude increased substantially under RF during the subjective night but without a rise in total daily levels, suggesting a better adaptation to activity–rest immune function. Crp mRNA daily average levels were significantly up-regulated (1.3-fold, P < 0.05, Student’s t-test) in the liver, with no change in the jejunum and WAT (Fig. 7; Table S4) or serum protein levels (Fig. 5; Table S4).
Fig 7.
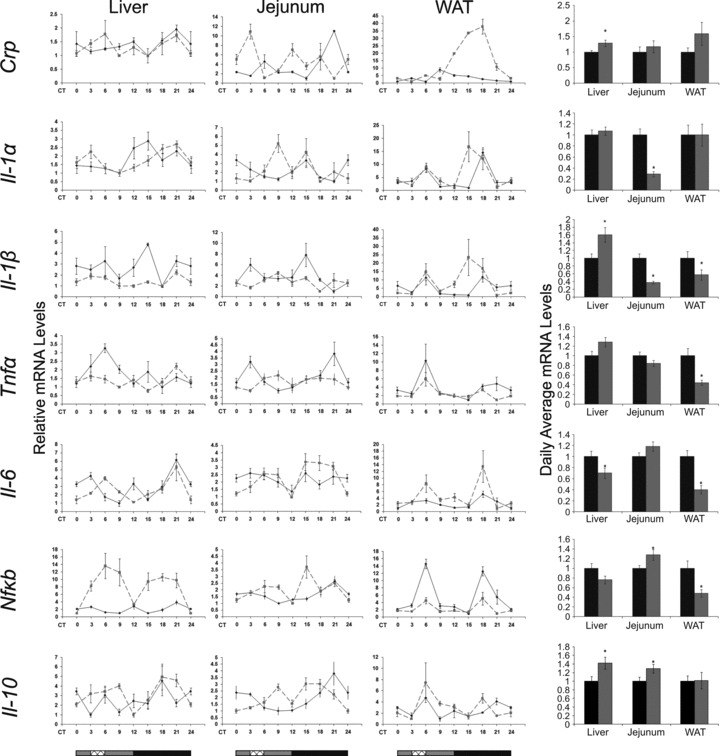
Circadian rhythms and average mRNA levels of inflammation markers in the liver, jejunum and WAT of AL- and RF-fed mice. Liver, jejunum and WAT were collected every 3 hrs around the circadian cycle from mice fed either AL (solid black line and columns) or RF (dashed grey lined and grey columns). Food availability during RF is marked by the crosshatched box. mRNA was quantified by real-time PCR. Inflammation gene levels were normalized using Gapdh as the reference gene. For total daily levels, all time-points were averaged. The grey and black bars designate the subjective day and night, respectively. Values are means ± S.E., n = 6 for each time-point in each group. Asterisk denotes significant difference (P < 0.05).
Liver Il-1α oscillated during the subjective night under both AL (P < 0.05, one-way anova) and RF (P < 0.05, one-way anova, Acro) (Fig. 7; Table S2). Liver and jejunum Il-1β did not oscillate under AL and RF (Fig. 7; Table S2). WAT Il-1α and Il-1β showed a bimodal pattern under AL and RF with a phase advance in the peak during the subjective night under RF. Daily average levels of jejunum Il-1α and Il-1β mRNA significantly decreased (3.5-fold and 2.5-fold, respectively, P < 0.0001, Student’s t-test), WAT Il-1β mRNA significantly decreased (1.8-fold, P < 0.05, Student’s t-test), but liver Il-1β mRNA significantly increased (1.6-fold, P < 0.01, Student’s t-test) (Fig. 7; Table S4).
Tnfα did not oscillate in any of the tissues. Tnfα mRNA daily average levels significantly decreased in WAT (2.3-fold, P < 0.001, Student’s t-test), did not change in the jejunum, and slightly increased in the liver (1.3-fold, P < 0.05, Student’s t-test). Regardless of the mRNA levels, protein levels in both liver and jejunum showed an extensive reduction (3- and 2-fold, respectively, P < 0.01, Student’s t-test) (Fig. 8; Table S4).
Fig 8.
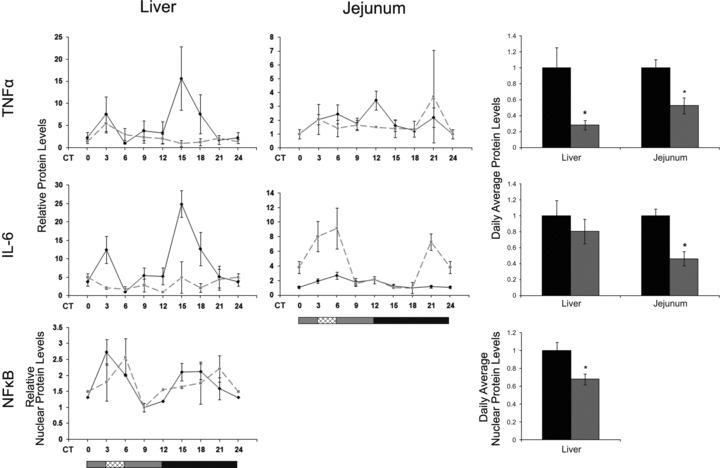
Circadian rhythms and average protein levels of inflammation markers in the liver and jejunum of AL- and RF-fed mice. Liver and jejunum were collected every 3 hrs around the circadian cycle from mice fed either AL (solid black line and columns) or RF (dashed grey line and grey columns). Food availability during RF is marked by the crosshatched box. Protein was analysed by Western blotting and quantified using actin as loading control. For total daily levels, all time-points were averaged. The grey and black bars designate the subjective day and night, respectively. Values are means ± S.E., n = 3 for each time-point in each group. Asterisk denotes significant difference (P < 0.05).
Liver, jejunum and WAT Il-6 mRNA did not oscillate under AL, but showed a biphasic pattern under RF (Fig. 7; Table S2). Daily average Il-6 levels under RF significantly decreased in the liver (1.4-fold, P < 0.05, Student’s t-test) and WAT (2.5-fold, P < 0.0001, Student’s t-test) correlating with the significantly decreased IL-6 serum protein levels (3-fold, P < 0.05, Student’s t-test) (Fig. 5; Table S4). In addition, jejunal IL-6 protein levels significantly decreased (2-fold, P < 0.0001, Student’s t-test) under RF (Fig. 8; Table S4).
Nfκb mRNA showed a bimodal expression pattern in liver under RF and in WAT under both treatments (Fig. 7). In liver and jejunum, RF increased the amplitude, whereas in WAT the amplitude decreased. Nfκb p65 mRNA daily average levels significantly decreased in WAT (2-fold, P < 0.01, Student’s t-test) but increased (1.3-fold, P < 0.05, Student’s t-test) in the jejunum. In addition, NF-κB p65 nuclear protein fraction significantly decreased in the liver (1.5-fold, P < 0.01, Student’s t-test) (Fig. 8; Table S4).
The anti-inflammatory cytokine Il-10 oscillated in the jejunum under AL (P < 0.0005, one-way anova, Acro) and showed biphasic pattern under RF across all tissues (Fig. 7). Il-10 daily average levels showed a significant increase in the liver and jejunum (1.4- and 1.3-fold, respectively, P < 0.05, Student’s t-test) (Fig. 7; Table S4).
Effect of RF on allergy markers
The allergic response oscillates in character and intensity throughout the day and is exacerbated during the night in human beings [64]. Furthermore, steroid-based pharmacological drugs that are used to treat allergy, are also known to affect the molecular mechanism of the circadian clock [64, 65]. Therefore, we tested whether the circadian clock controls key proteins in mast cells, the main effectors of the allergic reaction. We tested mast cell proteins in the jejunum, as this tissue is relatively rich in mast cells [66]. The relative mRNA of mast cell-specific markers: mast cell protease 4 (MCPT-4), mast cell chymase1 (MCPT-5/CMA1) and C-kit receptor (C-KIT/CD117) were determined throughout the circadian cycle in jejunum tissue. Mcpt-4 and Mcpt-5 showed an oscillatory pattern under both RF and AL (P < 0.05, one-way anova) (Fig. 9; Table S2). This oscillation became markedly more robust and high in amplitude under RF, but without a significant increase in daily average levels (Fig. 9; Table S4). Mcpt-4 peaked just before food was given under RF, suggesting an adaptation to food intake time (Fig. 9). Also, albeit differences in oscillation patterns, all three markers showed a general phase advance under RF.
Fig 9.
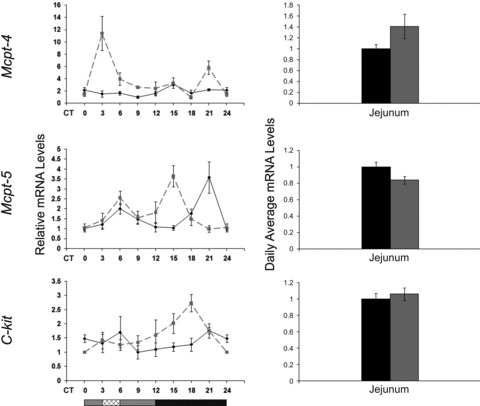
Circadian rhythms and average mRNA levels of mast cell markers in the jejunum of AL- and RF-fed mice. Jejunum was collected every 3 hrs around the circadian cycle from mice fed either AL (solid black line and columns) or RF (dashed grey lined and grey columns). Food availability during RF is marked by the crosshatched box. mRNA was quantified by real-time PCR. Gene levels were normalized using Gapdh as the reference gene. For total daily levels, all time-points were averaged. The grey and black bars designate the subjective day and night, respectively. Values are means ± S.E., n = 6 for each time-point in each group. Asterisk denotes significant difference (P < 0.05).
Discussion
Effect of RF on circadian rhythms
Overall, RF caused high amplitude rhythms in the expression of components of the molecular clock and markers of disease in the periphery. Some genes that showed mild oscillation under AL were amplified under RF, such as liver Pparα and jejunum Per1 and Bmal1. Moreover, some genes that did not oscillate at all under AL, did oscillate in a robust fashion under RF, such as liver Pparγ and jejunum Cry1, Clock and Pparγ. These results may reflect the dominance of RF over the light–dark cycle, as has been previously established [6, 7, 21, 48]. The results achieved with liver Pparα mRNA support previous findings in which Pparα mRNA was highly expressed under RF [67]. These high amplitude rhythms could pose a possible stress response to the diurnal feeding [68]. In addition, RF caused a phase advance in gene expression. The phase advance in clock gene expression alongside increased pAMPK levels under RF are in concert with former findings regarding the role of AMPK in clock function. Activated AMPK phosphorylates CKIɛ, resulting in increased casein kinase I (CKI)ɛ activity and degradation of Per2 [69]. AMPK also phosphorylates CRY1 leading to its degradation [70]. Degradation of the negative limb of the clockwork leads to a phase advance in the circadian expression pattern. This has also been corroborated in mice fed a high-fat diet, where levels of AMPK were low and led to a phase delay [71].
We found Sirt1 mRNA but not SIRT1 protein oscillation, as opposed to Asher et al. [72]. The mRNA discrepancy could be explained by different mouse strains used in both studies. The protein discrepancy could be explained by the fact that we used total protein and not nuclear extracts. In the jejunum, we found higher amplitudes in clock gene expression under RF than AL (Fig. 2). Although high levels of SIRT1 were found to be required for the higher amplitude circadian expression of core clock genes in mouse liver and cultured fibroblasts [72], we found decreased SIRT1 levels in the jejunum (Figs 3 and 4). This discrepancy can be explained by different regulations in the various tissues, and the fact that the proposed effect is mediated by NAD+ levels, rather than variation in SIRT1 overall levels.
In contrast to the high-amplitude rhythms, the oscillation of jejunum Per2 diminished under RF. This finding reiterates previous suggestions that Per2 is controlled both centrally by the SCN and locally by the endogenous clock [73] or by the SCN and the FEO [21]. Previous works in mice [37] and rats [38] demonstrated significant changes at the behavioural and physiological level under CR, such as food anticipation, motor activity, body temperature and respiration, thus accounting for altered metabolism and rhythmicity. Our study shows a comparable change under RF to the studies with CR [37, 38], suggesting common mechanisms. It is noteworthy that the activity pattern under RF (Fig. 1C) correlated closely with that of Per2 (Fig. 2) and Mcpt-4 (Fig. 9) mRNA expression in the jejunum, further indicating that these genes are particularly affected by the feeding regimen. Interestingly, some genes (Sirt1, Pparα, Il-1α, Il-1β, Il-6, Nfκb and Il-10) showed a bimodal pattern of expression in WAT under RF. As oscillation in peripheral tissues is mainly driven by the FEO, it is possible that in WAT both oscillators, the SCN and FEO, dictate gene expression, as has been previously suggested [74, 75]. This study corroborates recent works, showing that RF entrains inflammatory factors [76] and leads to a robust oscillation of numerous other hepatic genes in clock deficient mice [77].
Effect of RF on metabolism
Robust oscillation and a phase advance were also observed in most of the metabolical markers in both liver and jejunum under RF. As expected, under AL, Ampk mRNA oscillation peaked during the light phase, the time of inactivity, whereas under RF, it peaked before food availability. This is in agreement with the low energy levels when the animals were asleep under the AL regimen or devoid of food under the RF regimen. Under RF, when AMP levels increase, AMPK is activated, as indeed is demonstrated by the higher pAMPK/AMPK ratio (Fig. 4), to boost production of ATP and inhibit its usage. Similarly, the NAD+ histone deacetylase SIRT1 activity is up-regulated in response to changes in the energy status. SIRT1 activation promotes transcription of genes that mediate the metabolic response to stress or starvation, among which is PGC-1α (Fig. 10), as was reported [78]. Indeed, PGC-1α involvement in the switch from glycolysis to gluconeogenesis under fasting conditions in the liver is well documented [79–81] and fits well with the temporal food restriction inherent to the RF model.
Fig 10.
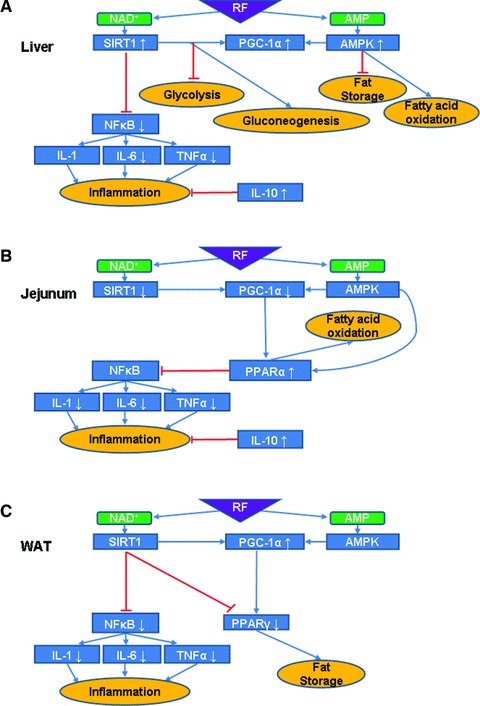
Suggested model for RF effects and interactions in various mouse tissues. (A) In the liver, RF is believed to lead to an increase in both NAD+ and AMP levels that could explain the observed AMPK activity up-regulation and increased Sirt1 mRNA leading to presumed increased activity levels. AMPK phosphorylates PGC-1α and the observed increase in its mRNA levels alongside those of Sirt1, assuming a parallel increase at the protein level, may lead to the arrest of glycolysis and fat storage and increase in gluconeogenesis and fatty acid oxidation. SIRT1 also inhibits NF-κB activity, as observed, which leads to down-regulation of pro-inflammatory cytokines (IL-6 and TNF-α). Combined with the observed up-regulation of the anti-inflammatory cytokine Il-10 mRNA, assuming similar effect at the protein level, this yields reduced inflammation. (B) In the jejunum, RF increases Pparα mRNA levels, which leads to fatty acid oxidation, assuming a parallel increase at the protein level. PPAR-α is also known to inhibit NF-κB. Pro-inflammatory cytokines (IL-1, IL-6 and TNF-α) are down-regulated and together with an increase of the anti-inflammatory cytokine IL-10 ultimately lead to reduced inflammation. This suggests a novel pathway by which RF can influence the inflammatory processes in the gut. (C) In WAT, inflammatory processes are inhibited in fat tissue as well. In addition, RF decreases Pparγ mRNA and assuming a parallel decrease at the protein level, this could result in reduced fat storage.
Because Pparα mRNA is highly expressed in cells that have active fatty acid oxidation capacity, such as enterocytes, the up-regulation we found in the jejunum suggests an increase in fatty acid oxidation and a shift towards lipid energy utilization in the intestine. Also, Pparα mRNA down-regulation observed in WAT may support an increase in fat mobilization from its stores to the circulation [82, 83]. A previous study has shown that disrupted clock leads to higher absorption of lipids in enterocytes [84]. Our results extend these findings, and provide molecular support that robust oscillation in the jejunum is correlated with reduced serum lipids. Liver Pparα did not change significantly under RF suggesting that liver energy metabolism remained as under AL, reiterating that the mice were not food deprived.
RF leads to reduction in inflammation and disease markers
We found that the nuclear fraction of NF-κB protein decreased in the liver under RF. It is well established that pro-inflammatory mediators [e.g. TNF-α, IL-1b, IL-6, cyclooxygenase (COX)-2, iNOS] are induced during the aging process, including the NF-κB signalling pathway [85], leading to age-related diseases, such as cardiovascular disease [86], diabetes [87], certain forms of cancer, Parkinson’s [88] and Alzheimer’s diseases [89]. Because only the active subunit of NF-κB exerts its effect by translocating to the nucleus, this result implies a reduced activation of the NF-κB inflammatory pathway [85].
RF led to a decrease in the disease markers Arginase and Afp in the jejunum. This might suggest a partial beneficial outcome of RF to well being. The lack of Gadd45β reduction in the liver is beneficial, as reduction is detrimental and may lead to hepatocellular DNA damage [56]. Reduction in Gadd45β expression in the jejunum may be linked to the reduction of stress-related immune factors, such as TNF-α[90]. In addition, RF reduced the expression of Il1α and Il1β in the jejunum. This reduction may be linked to the increase in PPAR-α levels (Figs 3 and 8), as PPAR-α was shown to inhibit IL-1 signalling by antagonizing the NF-κB pathway [83]. Moreover, intestinal chemosensory cells, which are involved in nutrient sensing, are known to express inflammatory markers [91] making it an interesting possibility that the FEO is located in the gut.
Reduction in lipid storage by repressing WAT PPAR-γ affects adipokine signalling. Reduced fat, and, hence, reduced adipokine secretion by WAT presumably leads to a decrease in age-related inflammatory and metabolic disorders [92]. Although Picard and Guarente [92] explained the reduction in PPAR-γ to be a result of SIRT1 activation, such a correlation of levels and possibly activation was not found in WAT, but did, however, exist in the liver. Thus, PPAR-γ down-regulation in WAT and SIRT1 up-regulation in liver under RF may lead to the reduced activation of the NF-κB inflammatory pathways.
Comparison between RF and Ramadan
RF regimen resembles the month of Ramadan, during which Muslims abstain from eating and drinking during day hours from dawn to sunset, and fast for about 16 hrs a day, whereas the last meal is taken at 1:00–2:00 a.m. [93]. The average low levels of cholesterol and triglycerides under RF are in agreement with those found during Ramadan [93, 94]. These results show that RF leads to the reduction of lipid levels in the blood, possibly preventing diseases, such as diabetes, cardiovascular diseases and metabolic syndrome. Serum disease markers, such as ALT and AST did not change under RF indicating lack of liver damage [95], as was found for Ramadan fasting [93]. Although we could not find significant changes in CRP levels, Aksungar and colleagues [96] demonstrated that Ramadan fasting has some positive effects on the inflammatory state and on risk factors for cardiovascular diseases, such as CRP and homocysteine. Our results may represent better the actual state, as we examined eight consecutive time-points throughout the circadian cycle, whereas Aksungar et al. [96] tested a single time-point.
In summary, our findings show that RF has a profound effect on various physiological processes by altering circadian expression and metabolism. RF leads to the lowering of the inflammatory state and disease proneness (Fig. 10) similar to CR [reviewed in 97, 98]. However, its effect on life span is still unclear. As RF is a less harsh regimen to follow than CR, it may be suggested for individuals seeking better health and maybe even longer life span.
Conflict of interest
The authors confirm that there are no conflicts of interest.
Supporting Information
Quantitative real-time PCR primer sequences
Table S2: Statistical analyses of mRNA oscillation
Table S3: Statistical analyses of protein oscillation
Table S4: Fold change and statistical analyses of mRNA, serum and tissue protein daily average levels
References
- 1.Lucas RJ, Freedman MS, Lupi D, et al. Identifying the photoreceptive inputs to the mammalian circadian system using transgenic and retinally degenerate mice. Behav Brain Res. 2001;125:97–102. doi: 10.1016/s0166-4328(01)00274-1. [DOI] [PubMed] [Google Scholar]
- 2.Lee C, Etchegaray JP, Cagampang FR, et al. Posttranslational mechanisms regulate the mammalian circadian clock. Cell. 2001;107:855–67. doi: 10.1016/s0092-8674(01)00610-9. [DOI] [PubMed] [Google Scholar]
- 3.Reppert SM, Weaver DR. Coordination of circadian timing in mammals. Nature. 2002;418:935–41. doi: 10.1038/nature00965. [DOI] [PubMed] [Google Scholar]
- 4.Froy O, Chang DC, Reppert SM. Redox potential: differential roles in dCRY and mCRY1 functions. Curr Biol. 2002;12:147–52. doi: 10.1016/s0960-9822(01)00656-x. [DOI] [PubMed] [Google Scholar]
- 5.Froy O, Chapnik N, Miskin R. Long-lived alphaMUPA transgenic mice exhibit pronounced circadian rhythms. Am J Physiol Endocrinol Metab. 2006;291:E1017–24. doi: 10.1152/ajpendo.00140.2006. [DOI] [PubMed] [Google Scholar]
- 6.Damiola F, Le Minh N, Preitner N, et al. Restricted feeding uncouples circadian oscillators in peripheral tissues from the central pacemaker in the suprachiasmatic nucleus. Genes Dev. 2000;14:2950–61. doi: 10.1101/gad.183500. [DOI] [PMC free article] [PubMed] [Google Scholar]
- 7.Stokkan KA, Yamazaki S, Tei H, et al. Entrainment of the circadian clock in the liver by feeding. Science. 2001;291:490–3. doi: 10.1126/science.291.5503.490. [DOI] [PubMed] [Google Scholar]
- 8.Mieda M, Williams SC, Richardson JA, et al. The dorsomedial hypothalamic nucleus as a putative food-entrainable circadian pacemaker. Proc Natl Acad Sci USA. 2006;103:12150–5. doi: 10.1073/pnas.0604189103. [DOI] [PMC free article] [PubMed] [Google Scholar]
- 9.Gooley JJ, Schomer A, Saper CB. The dorsomedial hypothalamic nucleus is critical for the expression of food-entrainable circadian rhythms. Nat Neurosci. 2006;9:398–407. doi: 10.1038/nn1651. [DOI] [PubMed] [Google Scholar]
- 10.Landry GJ, Simon MM, Webb IC, et al. Persistence of a behavioral food-anticipatory circadian rhythm following dorsomedial hypothalamic ablation in rats. Am J Physiol Regul Integr Comp Physiol. 2006;290:R1527–34. doi: 10.1152/ajpregu.00874.2005. [DOI] [PubMed] [Google Scholar]
- 11.Landry GJ, Yamakawa GR, Webb IC, et al. The dorsomedial hypothalamic nucleus is not necessary for the expression of circadian food-anticipatory activity in rats. J Biol Rhythms. 2007;22:467–78. doi: 10.1177/0748730407307804. [DOI] [PubMed] [Google Scholar]
- 12.Davidson AJ, Cappendijk SL, Stephan FK. Feeding-entrained circadian rhythms are attenuated by lesions of the parabrachial region in rats. Am J Physiol Regul Integr Comp Physiol. 2000;278:R1296–304. doi: 10.1152/ajpregu.2000.278.5.R1296. [DOI] [PubMed] [Google Scholar]
- 13.Mistlberger RE, Mumby DG. The limbic system and food-anticipatory circadian rhythms in the rat: ablation and dopamine blocking studies. Behav Brain Res. 1992;47:159–68. doi: 10.1016/s0166-4328(05)80122-6. [DOI] [PubMed] [Google Scholar]
- 14.Mendoza J, Angeles-Castellanos M, Escobar C. Differential role of the accumbens shell and core subterritories in food-entrained rhythms of rats. Behav Brain Res. 2005;158:133–42. doi: 10.1016/j.bbr.2004.08.016. [DOI] [PubMed] [Google Scholar]
- 15.Davidson AJ. Search for the feeding-entrainable circadian oscillator: a complex proposition. Am J Physiol Regul Integr Comp Physiol. 2006;290:R1524–6. doi: 10.1152/ajpregu.00073.2006. [DOI] [PubMed] [Google Scholar]
- 16.Pitts S, Perone E, Silver R. Food-entrained circadian rhythms are sustained in arrhythmic Clk/Clk mutant mice. Am J Physiol Regul Integr Comp Physiol. 2003;285:R57–67. doi: 10.1152/ajpregu.00023.2003. [DOI] [PMC free article] [PubMed] [Google Scholar]
- 17.Pendergast JS, Nakamura W, Friday RC, et al. Robust food anticipatory activity in BMAL1-deficient mice. PLoS One. 2009;4:1–9. doi: 10.1371/journal.pone.0004860. [DOI] [PMC free article] [PubMed] [Google Scholar]
- 18.Storch KF, Weitz CJ. Daily rhythms of food-anticipatory behavioral activity do not require the known circadian clock. Proc Natl Acad Sci USA. 2009;106:6808–13. doi: 10.1073/pnas.0902063106. [DOI] [PMC free article] [PubMed] [Google Scholar]
- 19.Feillet CA, Ripperger JA, Magnone MC, et al. Lack of food anticipation in Per2 mutant mice. Curr Biol. 2006;16:2016–22. doi: 10.1016/j.cub.2006.08.053. [DOI] [PubMed] [Google Scholar]
- 20.Mistlberger RE. Circadian rhythms: perturbing a food-entrained clock. Curr Biol. 2006;16:R968–9. doi: 10.1016/j.cub.2006.10.020. [DOI] [PubMed] [Google Scholar]
- 21.Froy O, Chapnik N, Miskin R. The suprachiasmatic nuclei are involved in determining circadian rhythms during restricted feeding. Neuroscience. 2008;155:1152–9. doi: 10.1016/j.neuroscience.2008.06.060. [DOI] [PubMed] [Google Scholar]
- 22.Hurd MW, Ralph MR. The significance of circadian organization for longevity in the golden hamster. J Biol Rhythms. 1998;13:430–6. doi: 10.1177/074873098129000255. [DOI] [PubMed] [Google Scholar]
- 23.Hofman MA, Swaab DF. Living by the clock: the circadian pacemaker in older people. Ageing Res Rev. 2006;5:33–51. doi: 10.1016/j.arr.2005.07.001. [DOI] [PubMed] [Google Scholar]
- 24.Davis S, Mirick DK. Circadian disruption, shift work and the risk of cancer: a summary of the evidence and studies in Seattle. Cancer Causes Control. 2006;17:539–45. doi: 10.1007/s10552-005-9010-9. [DOI] [PubMed] [Google Scholar]
- 25.Filipski E, Li XM, Levi F. Disruption of circadian coordination and malignant growth. Cancer Causes Control. 2006;17:509–14. doi: 10.1007/s10552-005-9007-4. [DOI] [PubMed] [Google Scholar]
- 26.Froy O. The relationship between nutrition and circadian rhythms in mammals. Front Neuroendocrinol. 2007;28:61–71. doi: 10.1016/j.yfrne.2007.03.001. [DOI] [PubMed] [Google Scholar]
- 27.Carapetis JR, McDonald M, Wilson NJ. Acute rheumatic fever. Lancet. 2005;366:155–68. doi: 10.1016/S0140-6736(05)66874-2. [DOI] [PubMed] [Google Scholar]
- 28.Karlsson B, Knutsson A, Lindahl B. Is there an association between shift work and having a metabolic syndrome? Results from a population based study of 27,485 people. Occup Environ Med. 2001;58:747–52. doi: 10.1136/oem.58.11.747. [DOI] [PMC free article] [PubMed] [Google Scholar]
- 29.Kondratov RV, Kondratova AA, Gorbacheva VY, et al. Early aging and age-related pathologies in mice deficient in BMAL1, the core componentof the circadian clock. Genes Dev. 2006;20:1868–73. doi: 10.1101/gad.1432206. [DOI] [PMC free article] [PubMed] [Google Scholar]
- 30.Mosendane T, Raal FJ. Shift work and its effects on the cardiovascular system. Cardiovasc J Afr. 2008;19:210–5. [PMC free article] [PubMed] [Google Scholar]
- 31.Rudic RD, McNamara P, Curtis AM, et al. BMAL1 and CLOCK, two essential components of the circadian clock, are involved in glucose homeostasis. PLoS Biol. 2004;2:1893–9. doi: 10.1371/journal.pbio.0020377. [DOI] [PMC free article] [PubMed] [Google Scholar]
- 32.Staels B. When the Clock stops ticking, metabolic syndrome explodes. Nat Med. 2006;12:54–5. doi: 10.1038/nm0106-54. discussion 5. [DOI] [PubMed] [Google Scholar]
- 33.Masoro EJ. Overview of caloric restriction and ageing. Mech Ageing Dev. 2005;126:913–22. doi: 10.1016/j.mad.2005.03.012. [DOI] [PubMed] [Google Scholar]
- 34.Roth GS, Lane MA, Ingram DK, et al. Biomarkers of caloric restriction may predict longevity in humans. Science. 2002;297:811. doi: 10.1126/science.1071851. [DOI] [PubMed] [Google Scholar]
- 35.Roth GS, Mattison JA, Ottinger MA, et al. Aging in rhesus monkeys: relevance to human health interventions. Science. 2004;305:1423–6. doi: 10.1126/science.1102541. [DOI] [PubMed] [Google Scholar]
- 36.Weindruch R, Sohal RS. Seminars in medicine of the Beth Israel Deaconess Medical Center. Caloric intake and aging. N Engl J Med. 1997;337:986–94. doi: 10.1056/NEJM199710023371407. [DOI] [PMC free article] [PubMed] [Google Scholar]
- 37.Duffy PH, Feuers RJ, Hart RW. Effect of chronic caloric restriction on the circadian regulation of physiological and behavioral variables in old male B6C3F1 mice. Chronobiol Int. 1990;7:291–303. doi: 10.1080/07420529009064635. [DOI] [PubMed] [Google Scholar]
- 38.Duffy PH, Feuers R, Nakamura KD, et al. Effect of chronic caloric restriction on the synchronization of various physiological measures in old female Fischer 344 rats. Chronobiol Int. 1990;7:113–24. doi: 10.3109/07420529009056963. [DOI] [PubMed] [Google Scholar]
- 39.Froy O, Chapnik N, Miskin R. Effect of intermittent fasting on circadian rhythms in mice depends on feeding time. Mech Ageing Dev. 2009;130:154–60. doi: 10.1016/j.mad.2008.10.006. [DOI] [PubMed] [Google Scholar]
- 40.Challet E, Caldelas I, Graff C, et al. Synchronization of the molecular clockwork by light- and food-related cues in mammals. Biol Chem. 2003;384:711–9. doi: 10.1515/BC.2003.079. [DOI] [PubMed] [Google Scholar]
- 41.Bender DA, Bender AE. A dictionary of food and nutrition. 2nd ed. Oxford, U.K.: Oxford University Press; 2005. p. 583. [Google Scholar]
- 42.Gutman R, Yosha D, Choshniak I, et al. Two strategies for coping with food shortage in desert golden spiny mice. Physiol Behav. 2007;90:95–102. doi: 10.1016/j.physbeh.2006.08.033. [DOI] [PubMed] [Google Scholar]
- 43.Froy O, Chapnik N, Miskin R. Mouse intestinal cryptdins exhibit circadian oscillation. FASEB J. 2005;19:1920–2. doi: 10.1096/fj.05-4216fje. [DOI] [PubMed] [Google Scholar]
- 44.Froy O, Chapnik N. Circadian oscillation of innate immunity components in mouse small intestine. Mol Immunol. 2007;44:1954–60. doi: 10.1016/j.molimm.2006.09.026. [DOI] [PubMed] [Google Scholar]
- 45.Pardo M, Budick-Harmelin N, Tirosh B, et al. Antioxidant defense in hepatic ischemia-reperfusion injury is regulated by damage-associated molecular pattern signal molecules. Free Radic Biol Med. 2008;45:1073–83. doi: 10.1016/j.freeradbiomed.2008.06.029. [DOI] [PubMed] [Google Scholar]
- 46.Cao SX, Dhahbi JM, Mote PL, et al. Genomic profiling of short- and long-term caloric restriction effects in the liver of aging mice. Proc Natl Acad Sci USA. 2001;98:10630–5. doi: 10.1073/pnas.191313598. [DOI] [PMC free article] [PubMed] [Google Scholar]
- 47.Fu C, Hickey M, Morrison M, et al. Tissue specific and non-specific changes in gene expression by aging and by early stage CR. Mech Ageing Dev. 2006;127:905–16. doi: 10.1016/j.mad.2006.09.006. [DOI] [PMC free article] [PubMed] [Google Scholar]
- 48.Froy O. Metabolism and Circadian Rhythms–Implications for Obesity. Endocr Rev. 2009:er.2009–0014. doi: 10.1210/er.2009-0014. [DOI] [PubMed] [Google Scholar]
- 49.Green CB, Takahashi JS, Bass J. The meter of metabolism. Cell. 2008;134:728–42. doi: 10.1016/j.cell.2008.08.022. [DOI] [PMC free article] [PubMed] [Google Scholar]
- 50.Juhan-Vague I, Alessi MC. PAI-1, obesity, insulin resistance and risk of cardiovascular events. Thromb Haemost. 1997;78:656–60. [PubMed] [Google Scholar]
- 51.Mielczarek M, Chrzanowska A, Scibior D, et al. Arginase as a useful factor for the diagnosis of colorectal cancer liver metastases. Int J Biol Markers. 2006;21:40–4. doi: 10.1177/172460080602100106. [DOI] [PubMed] [Google Scholar]
- 52.Porembska Z, Nyckowski P, Skwarek A, et al. Arginase a marker of cancerogenesis. II. Monitoring of patients after resection of colorectal liver metastases. Pol Merkur Lekarski. 2002;13:286–8. [PubMed] [Google Scholar]
- 53.Porembska Z, Skwarek A, Chrzanowska A, et al. Arginase as a marker of cancerogenesis. III. Comparison of arginase activity with CEA and Ca 19–9 in liver metastases of colorectal cancer. Pol Merkur Lekarski. 2004;16:31–3. [PubMed] [Google Scholar]
- 54.Leu SY, Wang SR. Clinical significance of arginase in colorectal cancer. Cancer. 1992;70:733–6. doi: 10.1002/1097-0142(19920815)70:4<733::aid-cncr2820700403>3.0.co;2-6. [DOI] [PubMed] [Google Scholar]
- 55.Straus B, Cepelak I, Festa G. Arginase, a new marker of mammary carcinoma. Clin Chim Acta. 1992;210:5–12. doi: 10.1016/0009-8981(92)90040-w. [DOI] [PubMed] [Google Scholar]
- 56.Qiu W, David D, Zhou B, et al. Down-regulation of growth arrest DNA damage-inducible gene 45beta expression is associated with human hepatocellular carcinoma. Am J Pathol. 2003;162:1961–74. doi: 10.1016/s0002-9440(10)64329-5. [DOI] [PMC free article] [PubMed] [Google Scholar]
- 57.Yao DF, Dong ZZ, Yao M. Specific molecular markers in hepatocellular carcinoma. Hepatobiliary Pancreat Dis Int. 2007;6:241–7. [PubMed] [Google Scholar]
- 58.Oh SY, Cho YK, Kang MS, et al. The association between increased alanine aminotransferase activity and metabolic factors in nonalcoholic fatty liver disease. Metabolism. 2006;55:1604–9. doi: 10.1016/j.metabol.2006.07.021. [DOI] [PubMed] [Google Scholar]
- 59.Ozer J, Ratner M, Shaw M, et al. The current state of serum biomarkers of hepatotoxicity. Toxicology. 2008;245:194–205. doi: 10.1016/j.tox.2007.11.021. [DOI] [PubMed] [Google Scholar]
- 60.Johnson TE. Recent results: biomarkers of aging. Exp Gerontol. 2006;41:1243–6. doi: 10.1016/j.exger.2006.09.006. [DOI] [PubMed] [Google Scholar]
- 61.Huang H, Patel DD, Manton KG. The immune system in aging: roles of cytokines, T cells and NK cells. Front Biosci. 2005;10:192–215. doi: 10.2741/1521. [DOI] [PubMed] [Google Scholar]
- 62.Wu D, Ren Z, Pae M, et al. Aging up-regulates expression of inflammatory mediators in mouse adipose tissue. J Immunol. 2007;179:4829–39. doi: 10.4049/jimmunol.179.7.4829. [DOI] [PubMed] [Google Scholar]
- 63.Abraham J, Campbell CY, Cheema A, et al. C-reactive protein in cardiovascular risk assessment: a review of the evidence. J Cardiometab Syndr. 2007;2:119–23. doi: 10.1111/j.1559-4564.2007.05950.x. [DOI] [PubMed] [Google Scholar]
- 64.Sutherland ER. Nocturnal asthma: underlying mechanisms and treatment. Curr Allergy Asthma Rep. 2005;5:161–7. doi: 10.1007/s11882-005-0091-z. [DOI] [PubMed] [Google Scholar]
- 65.Reddy AB, Maywood ES, Karp NA, et al. Glucocorticoid signaling synchronizes the liver circadian transcriptome. Hepatology. 2007;45:1478–88. doi: 10.1002/hep.21571. [DOI] [PubMed] [Google Scholar]
- 66.Bischoff SC. Role of mast cells in allergic and non-allergic immune responses: comparison of human and murine data. Nat Rev Immunol. 2007;7:93–104. doi: 10.1038/nri2018. [DOI] [PubMed] [Google Scholar]
- 67.Canaple L, Rambaud J, Dkhissi-Benyahya O, et al. Reciprocal regulation of brain and muscle Arnt-like protein 1 and peroxisome proliferator-activated receptor alpha defines a novel positive feedback loop in the rodent liver circadian clock. Mol Endocrinol. 2006;20:1715–27. doi: 10.1210/me.2006-0052. [DOI] [PubMed] [Google Scholar]
- 68.Lemberger T, Saladin R, Vazquez M, et al. Expression of the peroxisome proliferator-activated receptor alpha gene is stimulated by stress and follows a diurnal rhythm. J Biol Chem. 1996;271:1764–9. doi: 10.1074/jbc.271.3.1764. [DOI] [PubMed] [Google Scholar]
- 69.Um JH, Yang S, Yamazaki S, et al. Activation of 5’-AMP-activated kinase with diabetes drug metformin induces casein kinase Iepsilon (CKIepsilon)-dependent degradation of clock protein mPer2. J Biol Chem. 2007;282:20794–8. doi: 10.1074/jbc.C700070200. [DOI] [PubMed] [Google Scholar]
- 70.Lamia KA, Sachdeva UM, DiTacchio L, et al. AMPK regulates the circadian clock by cryptochrome phosphorylation and degradation. Science. 2009;326:437–40. doi: 10.1126/science.1172156. [DOI] [PMC free article] [PubMed] [Google Scholar]
- 71.Barnea M, Madar Z, Froy O. High-fat diet delays and fasting advances the circadian expression of adiponectin signaling components in mouse liver. Endocrinology. 2009;150:161–8. doi: 10.1210/en.2008-0944. [DOI] [PubMed] [Google Scholar]
- 72.Asher G, Gatfield D, Stratmann M, et al. SIRT1 regulates circadian clock gene expression through PER2 deacetylation. Cell. 2008;134:317–28. doi: 10.1016/j.cell.2008.06.050. [DOI] [PubMed] [Google Scholar]
- 73.Kornmann B, Schaad O, Bujard H, et al. System-driven and oscillator-dependent circadian transcription in mice with a conditionally active liver clock. PLoS Biol. 2007;5:179–89. doi: 10.1371/journal.pbio.0050034. [DOI] [PMC free article] [PubMed] [Google Scholar]
- 74.Martinez-Merlos MT, Angeles-Castellanos M, Diaz-Munoz M, et al. Dissociation between adipose tissue signals, behavior and the food-entrained oscillator. J Endocrinol. 2004;181:53–63. doi: 10.1677/joe.0.1810053. [DOI] [PubMed] [Google Scholar]
- 75.Escobar C, Cailotto C, Angeles-Castellanos M, et al. Peripheral oscillators: the driving force for food-anticipatory activity. Eur J Neurosci. 2009;30:1665–75. doi: 10.1111/j.1460-9568.2009.06972.x. [DOI] [PubMed] [Google Scholar]
- 76.Luna-Moreno D, Aguilar-Roblero R, Diaz-Munoz M. Restricted feeding entrains rhythms of inflammation-related factors without promoting an acute-phase response. Chronobiol Int. 2009;26:1409–29. doi: 10.3109/07420520903417003. [DOI] [PubMed] [Google Scholar]
- 77.Vollmers C, Gill S, DiTacchio L, et al. Time of feeding and the intrinsic circadian clock drive rhythms in hepatic gene expression. Proc Natl Acad Sci USA. 2009;106:21453–8. doi: 10.1073/pnas.0909591106. [DOI] [PMC free article] [PubMed] [Google Scholar]
- 78.Fulco M, Sartorelli V. Comparing and contrasting the roles of AMPK and SIRT1 in metabolic tissues. Cell Cycle. 2008;7:3669–79. doi: 10.4161/cc.7.23.7164. [DOI] [PMC free article] [PubMed] [Google Scholar]
- 79.Rodgers JT, Puigserver P. Fasting-dependent glucose and lipid metabolic response through hepatic sirtuin 1. Proc Natl Acad Sci USA. 2007;104:12861–6. doi: 10.1073/pnas.0702509104. [DOI] [PMC free article] [PubMed] [Google Scholar]
- 80.Naimi M, Arous C, Van Obberghen E. Energetic cell sensors: a key to metabolic homeostasis. Trends Endocrinol Metab. 2009;21:75–82. doi: 10.1016/j.tem.2009.09.003. [DOI] [PubMed] [Google Scholar]
- 81.Rodgers JT, Lerin C, Haas W, et al. Nutrient control of glucose homeostasis through a complex of PGC-1alpha and SIRT1. Nature. 2005;434:113–8. doi: 10.1038/nature03354. [DOI] [PubMed] [Google Scholar]
- 82.Burns KA, Vanden Heuvel JP. Modulation of PPAR activity via phosphorylation. Biochim Biophys Acta. 2007;1771:952–60. doi: 10.1016/j.bbalip.2007.04.018. [DOI] [PMC free article] [PubMed] [Google Scholar]
- 83.Escher P, Wahli W. Peroxisome proliferator-activated receptors: insight into multiple cellular functions. Mutat Res. 2000;448:121–38. doi: 10.1016/s0027-5107(99)00231-6. [DOI] [PubMed] [Google Scholar]
- 84.Pan X, Hussain MM. Clock is important for food and circadian regulation of macronutrient absorption in mice. J Lipid Res. 2009;50:1800–13. doi: 10.1194/jlr.M900085-JLR200. [DOI] [PMC free article] [PubMed] [Google Scholar]
- 85.Chung HY, Cesari M, Anton S, et al. Molecular inflammation: underpinnings of aging and age-related diseases. Ageing Res Rev. 2009;8:18–30. doi: 10.1016/j.arr.2008.07.002. [DOI] [PMC free article] [PubMed] [Google Scholar]
- 86.Araujo JP, Lourenco P, Azevedo A, et al. Prognostic value of high-sensitivity C-reactive protein in heart failure: a systematic review. J Card Fail. 2009;15:256–66. doi: 10.1016/j.cardfail.2008.10.030. [DOI] [PubMed] [Google Scholar]
- 87.Navarro-Gonzalez JF, Jarque A, Muros M, et al. Tumor necrosis factor-alpha as a therapeutic target for diabetic nephropathy. Cytokine Growth Factor Rev. 2009;20:165–73. doi: 10.1016/j.cytogfr.2009.02.005. [DOI] [PubMed] [Google Scholar]
- 88.Piccini P, Pavese N, Hagell P, et al. Factors affecting the clinical outcome after neural transplantation in Parkinson’s disease. Brain. 2005;128:2977–86. doi: 10.1093/brain/awh649. [DOI] [PubMed] [Google Scholar]
- 89.Giunta B, Fernandez F, Nikolic WV, et al. Inflammaging as a prodrome to Alzheimer’s disease. J Neuroinflammation. 2008;5:51. doi: 10.1186/1742-2094-5-51. [DOI] [PMC free article] [PubMed] [Google Scholar]
- 90.Zhang N, Ahsan MH, Zhu L, et al. NF-kappaB and not the MAPK signaling pathway regulates GADD45beta expression during acute inflammation. J Biol Chem. 2005;280:21400–8. doi: 10.1074/jbc.M411952200. [DOI] [PubMed] [Google Scholar]
- 91.Bezencon C, Furholz A, Raymond F, et al. Murine intestinal cells expressing Trpm5 are mostly brush cells and express markers of neuronal and inflammatory cells. J Comp Neurol. 2008;509:514–25. doi: 10.1002/cne.21768. [DOI] [PubMed] [Google Scholar]
- 92.Picard F, Guarente L. Molecular links between aging and adipose tissue. Int J Obes. 2005;29:S36–9. doi: 10.1038/sj.ijo.0802912. [DOI] [PubMed] [Google Scholar]
- 93.Ibrahim WH, Habib HM, Jarrar AH, et al. Effect of Ramadan fasting on markers of oxidative stress and serum biochemical markers of cellular damage in healthy subjects. Ann Nutr Metab. 2008;53:175–81. doi: 10.1159/000172979. [DOI] [PubMed] [Google Scholar]
- 94.Salehi M, Neghab M. Effects of fasting and a medium calorie balanced diet during the holy month Ramadan on weight, BMI and some blood parameters of overweight males. Pak J Biol Sci. 2007;10:968–71. doi: 10.3923/pjbs.2007.968.971. [DOI] [PubMed] [Google Scholar]
- 95.Giboney PT. Mildly elevated liver transaminase levels in the asymptomatic patient. Am Fam Physician. 2005;71:1105–10. [PubMed] [Google Scholar]
- 96.Aksungar FB, Topkaya AE, Akyildiz M. Interleukin-6, C-reactive protein and biochemical parameters during prolonged intermittent fasting. Ann Nutr Metab. 2007;51:88–95. doi: 10.1159/000100954. [DOI] [PubMed] [Google Scholar]
- 97.Chung HY, Kim HJ, Kim KW, et al. The inflammation hypothesis of aging. Healthy aging for functional longevity: molecular and cellular interactions in senescence. Ann N Y Acad Sci. 2001;928:327–35. [PubMed] [Google Scholar]
- 98.Chung HY, Kim HJ, Kim KW, et al. Molecular inflammation hypothesis of aging based on the anti-aging mechanism of calorie restriction. Microsc Res Tech. 2002;59:264–72. doi: 10.1002/jemt.10203. [DOI] [PubMed] [Google Scholar]
Associated Data
This section collects any data citations, data availability statements, or supplementary materials included in this article.
Supplementary Materials
Quantitative real-time PCR primer sequences
Table S2: Statistical analyses of mRNA oscillation
Table S3: Statistical analyses of protein oscillation
Table S4: Fold change and statistical analyses of mRNA, serum and tissue protein daily average levels


