Abstract
Biomarkers are essential part of daily medical practice. Currently, biomarkers are being used both for diagnostic and prognostic purposes. There are many approaches e.g. ELISA by which biomarker levels are detected from patient samples. However, all these approaches are laborious, time consuming and expensive. There is therefore a general need for exploring new technique which can overcome these drawbacks. Here, we present a preliminary study for detection of serum biomarkers by fluorescence correlation spectroscopy (FCS) based diagnostic technique. FCS is a technique basically used for spatial and temporal analysis of molecular interactions of extremely low-concentration biomolecules in solution. FCS is able to measure diffusion time of the fluorescent molecules passing through the open detection volume and it can also measure the average number of fluorescent molecules passing through the detection volume. Because diffusion speed is correlated with shape and molecular mass of the fluorescent molecule, this property makes it possible to study the complex formation between a small fluorescently labelled and a large unlabelled molecule. In this preliminary study, we utilize this FCS property for detection of serum biomarker. Further studies on various pathological serum samples are warranted to explore further aspects of this technique.
Keywords: biomarkers, ELISA, fluorescence correlation spectroscopy (FCS), diagnostic technique, translational research, translational medicine
Introduction
Biomarkers are in routine use in daily medical practice. Almost all sub-specialties of medicine benefit from the potential role of biomarkers either as diagnostic or prognostic markers [1–4]. Interleukin-8 (IL-8) is one of the important biomarkers [5–8]. There are many approaches like ELISA by which serum biomarkers levels are detected. However, all these approaches are laborious, time consuming and expensive. There is therefore a general need for exploring new detection technique which can overcome these drawbacks. The new technique should be specific, rapid in detection, highly sensitive, easy to perform and can be accommodated in daily medical practice.
Fluorescence correlation spectroscopy (FCS) is a technique basically used for spatial and temporal analysis of molecular interactions of extremely low-concentration biomolecules in solution. FCS is able to measure diffusion time of the molecules through the open detection volume and it can also measure the average number of molecules in the detection volume [9]. Because diffusion speed is correlated with shape and molecular mass of the fluorescent molecule, this property makes it possible to study the complex formation between a small fluorescently labelled and a large unlabelled molecule [10]. Although FCS was introduced first time in 1970s [11], in recent past research was focused to explore new applications of FCS which can be used in various subfields of medicine and molecular biology [12–15]. Here, we present a preliminary study for detection of serum biomarkers by FCS-based diagnostic technique.
Materials and methods
Reagents
Monoclonal anti-IL-8 antibodies were purchased from ACRIS Antibodies GmbH (Herford, Germany). Antibodies belong to classes IgG1 and IgG2b (mouse), respectively. DyLight 488 (Labelling Kit 53025 from Thermo Scientific, Waltham, MA, USA) was used to label lysine residues of the anti IL-8 antibody Ab1. Purified recombinant human IL-8 (Meridian Life Sciences, Inc., Saco, ME, USA; Cat. A42208H) from host Escherichia coli consisting of 77 amino acids and molecular weight 8.9 kD was used in our experiments. PBS was used as diluting agent. Rhodamine 6 G was used for FCS pinhole adjustment. The measurement volume for each sample was 20 μl. All Samples were stored at –20°C. Serum Samples were supplied by cardiology department, AKH, Vienna, Austria. Samples were taken from healthy donors with written consent, under hygienic condition. For measurements, we used 10 nM molar solution of labelled antibody (Ab1-Dy), 40 nM solution of second antibody (Ab2) and 20 nM solution of the IL-8.
FCS setup and data analysis
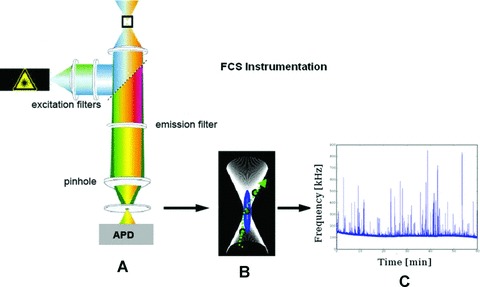
FCS measurements (Principle in Fig. 1) were performed with a ConfoCor (Carl Zeiss, Jena, Germany), an Argon-Ion laser (Lasos, Jena, Germany; λ= 488 nm, 0.3 mW/cm2) and a water immersion objective (Zeiss C-Apochromat 63 × 1.2 W corr) and for light detection an avalange photodiode (APD, SPCM-AQR-13-FC; Perkin Elmer, Waltham, MA, USA). Pinhole diameter was set to be 35 μm.
Fig 1.

FCS instrumentation. On the left-hand side, there is a schematic FCS setup (A). The pinhole cuts out a defined focal element from the laser focus (B) and fluorescence signals from fluorescent entities are recorded by the single-photon detector, resulting in a fluorescence trace (C).
Fluorescence was detected through a dichroic mirror (>510 nm) and a band pass filter (520–570 nm.). The excitation light was focused by the objective into an eight-chambered coverglass (LabTec, Nunc, Germany) containing 20 μl of the sample. The signal was processed by a hardware correlater with 288 logarithmic channels and sampling times between 200 ns and 3400 s. (ALV-5000, ALV, Langen, Germany). Samples were measured 15 times for 10 sec. at room temperature.
To analyse the data, the autocorrelation function (ACF) was calculated and fitted with the following model (G(t)) which accounts for translational diffusion and triplet decay:
 |
1 |
where N is the number of fluorescent molecules in the focus volume, D the diffusion coefficient, ω1 the radius of the focus volume horizontally to the direction of the incoming laser beam and ω2 the focus diameter parallel to the incoming laser beam. T is the portion of excited molecules in the triplet state. τT is the life time of the triplet state. The mean diffusion time τ, at which the ACF has the half-maximum value results from the fit procedure.
Result
The molecular weight of IL-8 is in the order of 8.9 kD and considerably smaller than that of an antibody (MW ca. 150 kD); therefore, we used single and also two primary monoclonal anti IL-8 antibodies, one binding at the N-terminus and the other at the C-terminus. One antibody was labelled with DyLight 488 dye (Thermo Scientific). Human anti-IL-8 antibody was labelled with DyLight 488 according to manufacturer’s instruction. Labelled antibody was incubated for 15 min. in pure serum and serum diluted with 50% v/v PBS (pH = 7.4) at room temperature.
FCS is based on the principle that fluorescing molecule shows a specific free diffusion velocity that is correlated with its size. According to this principle, the smaller the molecule, the faster it will diffuse through a given spherical volume. Statistical deviations of the fluctuations in fluorescence were used to study dynamic molecular events, such as diffusion.
The difference in the diffusion time of an entity consisting of antibody and the molecule of interest, and that of the labelled antibody is used to discriminate between the two species. Diffusion times were measured for labelled antibody in both pure serum and diluted serum samples with 50% PBS (v/v = 1:1). Later, purified recombinant human IL-8 (Meridian Life Sciences, Inc., Cat. A42208H) was incubated for 15 min. with labelled antibody in both pure and diluted sera at room temperature by shaking at 1000 rpm by an Eppendorf Thermomixer (Eppendorf, Vienna, Austria). Recording times for each measurement was 10 sec. and were repeated 15 times. A large number of measurements were performed to study various aspect of this potential technique. Readings with high-intensity fluctuations mainly due to aggregates were excluded for final data evaluation.
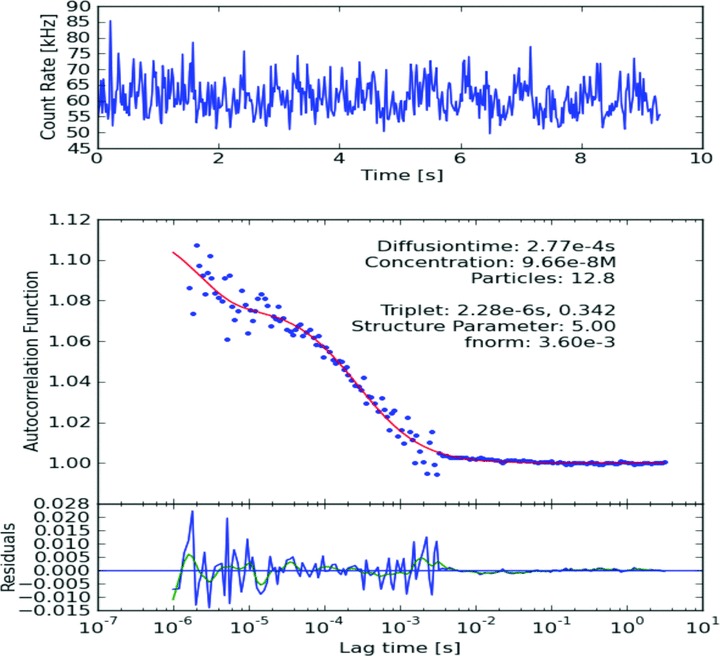
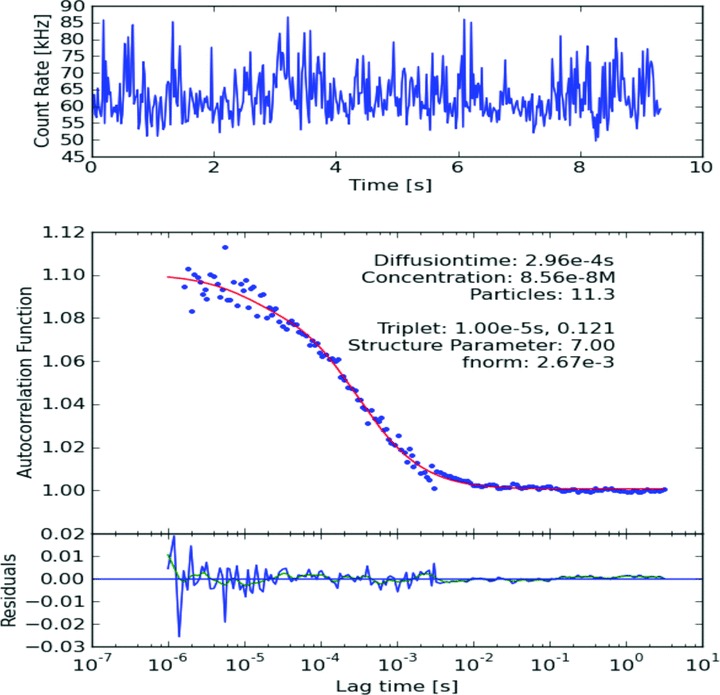
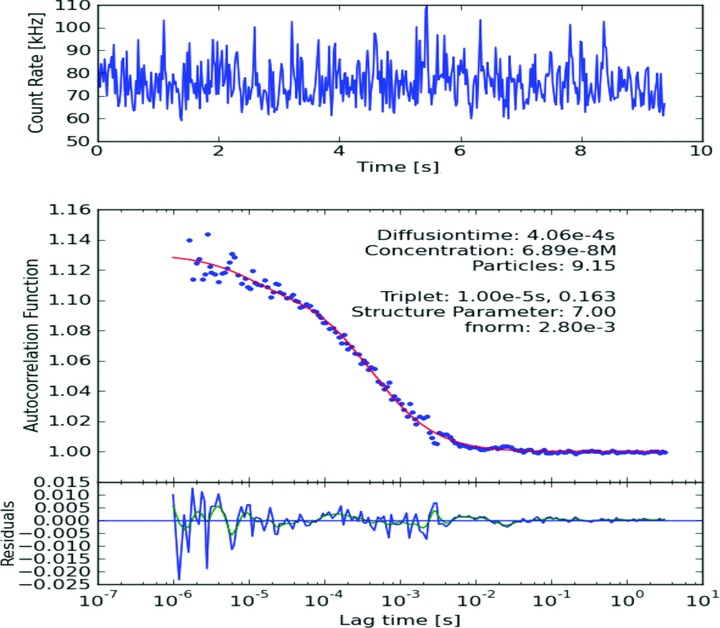
The number and diffusion coefficient of fluorescent particles which diffuse through the focus volume are extracted by application of the ACF. Increase in diffusion time was observed for antigen–antibody complex in both pure and diluted serum samples as compared to diffusion time of only labelled antibody (Figs 2–4). However, increase in diffusion time was more significant in case of diluted serum samples with 50% PBS (v/v = 1:1) as compared to pure serum samples. Significant increase in diffusion time was also observed after addition of the second antibody as compared to only antigen–single antibody complex in diluted serum samples (Figs 3 and 4). We found no difference in diffusion time irrespective of incubation times. Overnight incubation yielded same results as compared to 30 min. incubation time. We found same results with 10 and 20 sec. recording times. We propose that dilution of serum sample with PBS decreases viscosity of serum and is more suitable for this FCS technique as compared to pure serum.
Fig 2.

Typical ACF of IL-8 Antibody-DyLight488 in diluted serum.
Fig 3.

Typical ACF of IL-8-Antibody-DyLight488 + IL-8 AG in diluted serum.
Fig 4.

Typical ACF of IL-8-Antibody-DyLight488 + 2nd IL-8-antibody +IL-8 AG.
Discussion
Due to the high significance of biomarkers in clinical practice, research is going on to design better tools which can detect biomarkers rapidly, are less laborious and require less reagents. Here, we present a preliminary study for detection of serum biomarkers by FCS-based diagnostic technique.
From our preliminary study, we have shown that FCS is capable of being used as an alternative biomarker detection technique. There are many advantages associated with our proposed technique. Our proposed FCS-based technique works directly in solution, needs only some microlitres of sample. A single sample can be measured within a few minutes of processing time, which makes this a fast detection tool which can provide rapid results. Thus, the status of biomolecules in serum can be assessed from tiny sample volumes by repetitive sampling. Our proposed technique is cost effective and less laborious as compared to other conventional methods. Unlike ELISA, no washing steps are required for measurement. Also, in comparison to ELISA, this technique takes less time to interpret the result. Also, it is not dependent on long incubation periods as required by other methods. There is no requirement for many chemicals like enzymes, substrates, stop solutions and preservatives as in case of ELISA.
Our proposed technique should be extended further to other serum biomarkers. We suggest performing clinical studies which can compare this technique with ELISA in various pathophysiological conditions which are beyond the scope of this manuscript. Design of high affinity probe may be difficult although ELISA probe can be used as an alternative. In FCS measurement, detection efficiency rests on difference in diffusion times at least by a factor of 2; a demand often met due to the high non-globular shape of the complex. Currently the FCS setup is expensive, which demands development of a less expensive FCS setup in the near future. Furthermore, efficacy of this technique can be raised by making it automated. All these measures will facilitate the inclusion of this promising technique in routine medical clinics.
Conflict of interest
The authors confirm that there are no conflicts of interest.
References
- 1.Koçaka H, Oner-Iyidoùgan Y, Koçak T, et al. Determination of diagnostic and prognostic values of urinary interleukin-8, tumor necrosis factor-, and leukocyte arylsulfatase-A activity in patients with bladder cancer. Clinical Biochem. 2004;37:673–8. doi: 10.1016/j.clinbiochem.2004.02.005. [DOI] [PubMed] [Google Scholar]
- 2.Duan ZG, Yang WM. Analysis of cytokines (IL-2, IL-8, IL-10) in the expressed prostatic secretions of chronic prostatitis. Zhonghua Nan Ke Xue. 2005;11:201–3. [PubMed] [Google Scholar]
- 3.Sheu JN, Chen MC, Lue KH, et al. Serum and urine levels of interleukin-6 and interleukin-8 in children with acute pyelonephritis. Cytokine. 2006;36:276–82. doi: 10.1016/j.cyto.2007.02.006. [DOI] [PubMed] [Google Scholar]
- 4.Bleeker-Rovers CP, Rennen HJ, Boerman OC, et al. 99mTc-labeled interleukin 8 for the scintigraphic detection of infection and inflammation. first clinical evaluation J Nucl Med. 2007;48:337–43. [PubMed] [Google Scholar]
- 5.Hoberman A, Charron M, Hickey RW, et al. Imaging studies after a first febrile urinary tract infection in young children. N Engl J Med. 2003;348:195–202. doi: 10.1056/NEJMoa021698. [DOI] [PubMed] [Google Scholar]
- 6.Becker W, Bair J, Behr T, et al. Detection of soft-tissue infections and osteomyelitis using a technetium-99m-labeled anti-granulocyte monoclonal antibody fragment. J Nucl Med. 1994;35:1436–43. [PubMed] [Google Scholar]
- 7.Gratz S, Rennen HJ, Boerman OC, et al. Rapid imaging of experimental colitis with (99m) Tcinterleukin-8 in rabbits. J Nucl Med. 2001;42:917–23. [PubMed] [Google Scholar]
- 8.Galanakis E, Bitsori M, Dimitriou H, et al. Urine interleukin-8 as a marker of vesicoureteral reflux in infants. Pediatrics. 2006;117:863–7. doi: 10.1542/peds.2005-2051. [DOI] [PubMed] [Google Scholar]
- 9.Pack CG, Nishimura G, Tamura M, et al. Analysis of interaction between chaperonin GroEL and its substrate using fluorescence correlation spectroscopy. Cytometry. 1999;36:247–53. doi: 10.1002/(sici)1097-0320(19990701)36:3<247::aid-cyto15>3.3.co;2-r. [DOI] [PubMed] [Google Scholar]
- 10.Klinger J, Friedrich T. Site-specific interaction of thrombin and inhibitors observed by fluorescence correlation spectroscopy. Biophys J. 1997;73:2195–200. doi: 10.1016/S0006-3495(97)78251-1. [DOI] [PMC free article] [PubMed] [Google Scholar]
- 11.Magde D, Elson EL, Webb WW. Fluorescence correlation spectroscopy: I. Conceptual basis and theory. Biopolymers. 1974;13:1–27. doi: 10.1002/bip.1974.360130103. [DOI] [PubMed] [Google Scholar]
- 12.Pack CG, Aoki K, Taguchi H, et al. Effect of electrostatic interactions on the binding of charged substrate to GroEL studied by highly sensitive fluorescence correlation spectroscopy. Biochem Biophys Res Commun. 2000;267:300–04. doi: 10.1006/bbrc.1999.1864. [DOI] [PubMed] [Google Scholar]
- 13.Rigler R, Elson EL, editors. Fluorescence correlation spectroscopy: theory and applications. Berlin: Springer; 2001. pp. 187–245. [Google Scholar]
- 14.Saito K, Ito E, Takakuwa Y, et al. In situ observation of mobility and anchoring of PKC(I in plasma membrane. FEBS Lett. 2003;541:126–31. doi: 10.1016/s0014-5793(03)00324-7. [DOI] [PubMed] [Google Scholar]
- 15.Pack C, Saito K, Tamura M, et al. Microenvironment and effect of energy depletion in the nucleus analyzed by mobility of multiple oligomeric EGFPs. Biophys J. 2006;10:3921–36. doi: 10.1529/biophysj.105.079467. [DOI] [PMC free article] [PubMed] [Google Scholar]


