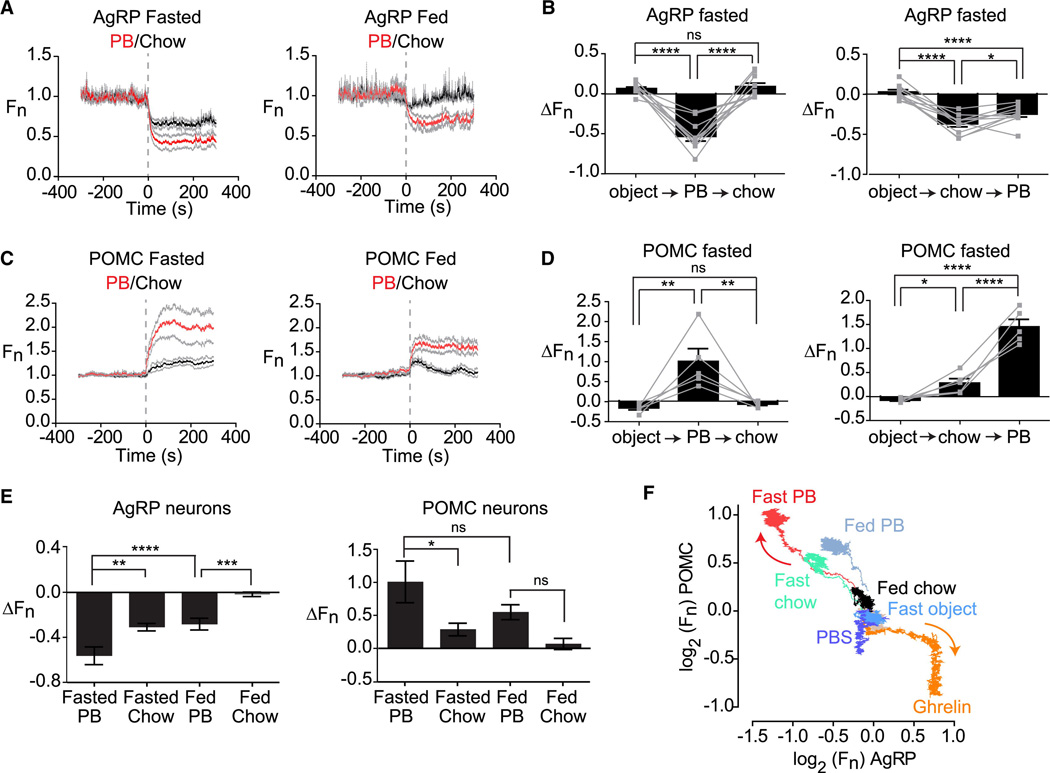
Figure 4. Food palatability determines the magnitude of the response to food detection.
(A and C) Calcium signals from AgRP and POMC neurons in fasted and fed mice aligned to the time of presentation of peanut butter or chow. (B and D) Fluorescence change of AgRP and POMC neurons upon sequential presentation of an inedible object, chow, and peanut butter in fasted mice. (E) Quantification of responses of AgRP and POMC neurons 5 min after food presentation. (F) Plot showing the response of AgRP and POMC neurons over 5 min to different foods and pharmacologic treatments in the context of varying nutritional states. All traces start at the origin (0,0) and emanate outward. Arrows indicate the direction of movement. See also Figure S2.

