Abstract
Optical coherence tomography (OCT) is a medical imaging technique that provides tomographic images at micron scales in three dimensions and high speeds. The addition of molecular contrast to the available morphological image holds great promise for extending OCT’s impact in clinical practice and beyond. Fundamental limitations prevent OCT from directly taking advantage of powerful molecular processes such as fluorescence emission and incoherent Raman scattering. A wide range of approaches is being researched to provide molecular contrast to OCT. Here we review those approaches with particular attention to those that derive their molecular contrast directly from modulation of the OCT signal. We also provide a brief overview of the multimodal approaches to gaining molecular contrast coincident with OCT.
Introduction
Optical coherence tomography (OCT) is a rapidly developing imaging technology that is gaining clinical acceptance in cardiology and is widely used in clinical ophthalmology. Beyond what is currently FDA approved, OCT is being investigated as a tool for a variety of applications including; diagnosing cancer (e.g. esophageal (1, 2), bladder (3), and oral (4, 5) cancers), diagnosing skin diseases (6), monitoring wound/burn healing (7, 8), and assessing tumor margins (9, 10). Similarly, OCT is playing a growing role in support of research into the development and progression of human disease as well as the development of organ systems in animal models (11).
OCT can provide tomographic images with micron scale resolution and rapid imaging speeds. Typically, the imaging depth in highly scattering tissues is 1-2 mm, but it can be much higher in weakly scattering tissues such as the eye. A unique aspect of OCT among other optical imaging technologies is that the axial resolution is independent of the lateral resolution. This feature is particularly important for imaging in the eye where the optics of the eye determine the lateral resolution. Likewise, imaging the coronary arteries requires a long depth of focus (lower lateral resolution) due to the fact that the relative position of the intravascular catheter endoscope to the artery lumen is not controlled. While the lateral resolution may suffer in both cases, the axial resolution can be maintained at the obvious expense of an asymmetric point-spread function. Typical lateral resolutions range from 10-40 μm, whereas the axial resolution is inversely proportional to the frequency bandwidth of the light source and typically ranges from 3-15 μm.
Cross-sectional and volumetric images are captured by scanning the illumination in x and y while collecting line images in z. Hence, the line-rate fundamentally limits the image acquisition speed. Typical line rates for OCT range from 50-200 kHz and are sufficient to mitigate many of the issues other imaging technologies have with motion artifact, even the fast saccades of the eye. Line rates in excess of 1 MHz (12, 13) have been demonstrated; opening up the possibility of measuring fast dynamical processes.
OCT fills a niche between the higher-resolution optical imaging technologies such as confocal reflectance microscopy and the lower-resolution technologies such as diffuse optical tomography. It offers high-speed, high-resolution tissue level imaging of morphology that cannot readily be generated in any other way. Unfortunately, OCT lacks the straightforward functional molecular imaging extensions available for these other technologies, e.g. confocal fluorescence microscopy and fluorescence diffuse optical tomography. This is largely due to the fact that incoherent processes such as fluorescence emission and Raman scattering are not readily detectable with the technique that underlies all OCT systems, low coherence interferometry. Fundamentally, OCT images are derived from measuring spatial variations in the intensity of backscattered near infrared light. These spatial variations arise from variations in the refractive index of the sample. For biological soft tissues these changes in refractive index are typically small and demarcate tissue morphologies. Changes in the refractive index unfortunately correlate poorly with specific biomolecular species. These facts have made it difficult to develop functional extensions of OCT that would enable molecular imaging. Still, molecular imaging with OCT through either endogenous or exogenous contrast agents is highly desirable, as it would enable functional biomolecular imaging in addition to the morphological imaging available through standard OCT.
Given the growing penetration of OCT into clinical practice, robust molecular imaging extensions could have long term clinical impact. To that end, a significant effort has been brought to bear on the development of techniques to enable molecular imaging with OCT. A variety of approaches have been and are continuing to be developed. There is also a growing body of work dedicated to combining OCT with other optical imaging technologies that can already garner molecular information. While this review will primarily be dedicated to the former, i.e. techniques that derive their molecular information directly from OCT images, we will also briefly summarize the multimodal OCT approaches. Our goal will be to provide some basic understanding of the physical process being exploited, noting some of the distinct properties of each technique, along with the essential technical details of the optical system. Finally we will briefly overview the current problems that are being investigated using each technology.
2. Photothermal OCT
2.1 Theory
Photothermal OCT (PTOCT) provides absorption based contrast by monitoring changes in the optical path length caused by the photothermal effect (14). In the photothermal effect, photons are absorbed by chromophores within a sample causing a localized rise in temperature. The variance of temperature at the target area caused by the photothermal effect generates isolated variations in the refractive index which in turn generates a variation in the optical path length (15). The optical path length variations typically generated by the photothermal effect, often nanometer in scale, can be resolved with phase-sensitive OCT (16, 17).
PTOCT utilizes separate laser sources for photothermal excitation and OCT signal generation. The photothermal source is coupled into the sample arm of the OCT system. Amplitude modulation of the photothermal source enables the differentiation of photothermal heating from the scattering signal (17). Selecting the ideal wavelength for absorption by the target chromophore enables specific molecules to be targeted. Figure 1 depicts a typical schematic for performing PTOCT.
Figure 1.
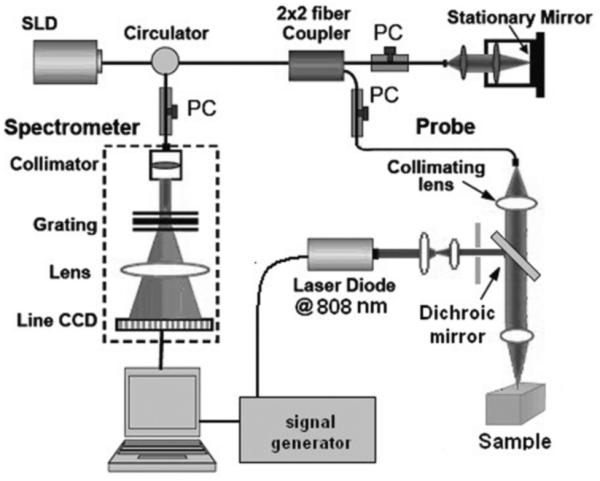
Schematic diagram of the photothermal phase sensitive spectral domain optical coherence tomography system. Reprinted with permission from (18). Copyright 2011 SPIE.
In most applications of PTOCT, a series of temporally resolved depth scans (M-mode scans) are obtained. Following a Fourier transform of the OCT phase data at each point in depth, the magnitude of the PTOCT data is located at the modulation frequency of the photothermal laser(17, 19). Prior studies have investigated the relationships between the magnitude of PTOCT signal and the concentrations of the target chromophores (17, 19). Additionally, a relationship has been demonstrated between PTOCT signal and the intensity of the photothermal source. The magnitude of the phase shift generated in the OCT signal, Δϕ, is related to the change in refractive index per unit temperature of the sample, , the thermal conductivity, k, the center wavelength, λ, the concentration of the absorbing sample, and the size of the excitation volume (19-22). For gold nanoparticles, a common target of photothermal OCT, the phase shift, elicited by the photothermal response can be approximated by Eq. 1 (19).
where N is the number of gold nanoparticles in the optical excitation volume, σ is the absorption cross section of the gold nanoparticles and is the intensity of the photothermal source.
A variety of work has gone into improving the sensitivity of PTOCT. As Eq. 1 shows, the magnitude of the PTOCT signal is linearly dependent upon the optical intensity of the photothermal source as well as the concentration of the targeted chromophore. However, as the modulation frequency of the photothermal source increases, the signal strength decreases logarithmically (20). This decrease in signal strength is predicted in closed-form solutions to the bio-heat conduction for radial heat transfer and is a fundamental limitation to current techniques (21). A range of modulation frequencies from 25 Hz up to 120 kHz have been explored. Due to the logarithmic decrease in signal with modulation frequency, there is a trade-off between image speed and signal strength. Additionally, while the amplitude of the OCT signal does not directly impact the intensity of the PTOCT signal, lower OCT signal amplitude increases the noise of PTOCT.
Complex post processing algorithms have been attempted to increase phase sensitivity, including averaging of overlapping short time Fourier transforms (20), subtraction of frequency components to compensate for additive noise (20), and polynomial background order subtraction (19, 23).An alternative approach for monitoring the photothermal signal has been explored through photothermal optical lock-in optical coherence microscopy (OCM). Phase modulations are generated in the reference arm to match the amplitude modulation frequency of the heating beam. The result is a demodulated photothermal signal of the absorbers without the need for m-mode scanning (24); however, this detection technique sacrifices the fundamental OCT signal.
2.2. Applications
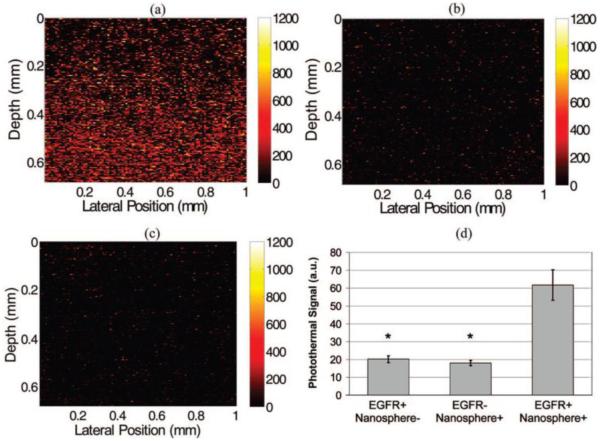
Photothermal OCT is often used to monitor exogenous contrast agents, most notably gold nanoparticles. In addition to their biocompatibility, gold nanoparticles are desirable because they have established methods for molecular targeting, and can easily be used for photothermal therapy (25). PTOCT imaging of immunotargeted gold nanoparticles has been demonstrated by Skala, et al for detection of epidermal growth factor receptor (EGFR) (19). EGFR is a cell surface receptor which binds specific ligands, and mutations to EGFR which have been linked to the formation of cancer (26, 27). To target EGFR, gold nanospheres were conjugated with EGR specific antibodies. The targeted nanospheres were placed in cell cultures expressing EGFR (Fig. 2(a)) and cell cultures with no expression of EGFR (Fig. 2(b)). Additionally, non-targeted nanospheres were added to cell culture containing cellular overexpression of EGFR (Fig. 2(c)). Figure 2(d) demonstrates the specific targeting of the antibody conjugated nanoparticles to cellular expression of EGFR.
Figure 2.
Images of EGFR expression in three-dimensional cell constructs containing EGFR+ cells (MDA-MB-468) with and without antibody-conjugated nanospheres (a and c, respectively) and EGFR-cells (MDA-MB-435) with antibody-conjugated nanospheres (b). There was a significant increase in the photothermal signal from EGFR overexpressing cell constructs labeled with antibody conjugated nanospheres (d) compared to the two controls (EGFR+/Nanosphere-and EGFR-/Nanosphere+). N = 17 images for each group, (*, p < 0.0001). Pump power 8.5 kW/cm2. Reproduced with permission from (19). Copyright 2008, American Chemical Society.
To the best of our knowledge, this is currently the only documented use of a targeted contrast agent for PTOCT imaging of nanoparticles. However, gold nanoparticles have widely been used for targeted molecular contrast for various applications (28). Tumors are also often passively labeled with gold nanoparticles via the enhanced permeability and retention effect (29). Other exogenous contrast agents have been demonstrated in the form of carbon nanorods (20), polypyrrole nanoparticles (30), indocyanine green encapsulated by poly (lactic-co-glycolic) acid nanoparticles (31), and iron oxide-silica-gold nanoprobes (32).
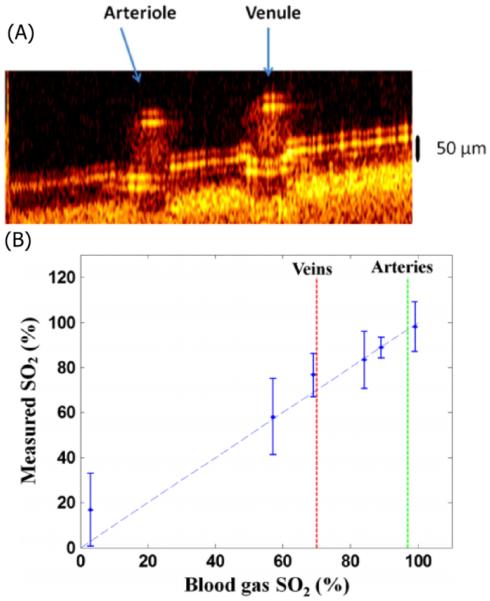
While PTOCT has largely been applied to exogenous contrast agents, it can potentially be used to image a variety of endogenous chromophores. If we take guidance from photoacoustic microscopy, which operates via a similar contrast mechanism, there is the potential to generate PTOCT images targeting nucleic acids, cytochromes, hemoglobin, and melanin (33-35). To date only hemoglobin has been successfully measured with PTOCT. Milner and coworkers developed a dual wavelength PTOCT system to characterize the oxygen saturation of hemoglobin. Using 780 nm and 800 nm pump wavelengths coupled with a 1064 nm center wavelength OCT system the oxygen concentration of hemoglobin in a 300 μm microvessel phantom was monitored. Figure 3(a) shows an en-face image of this sample, while Fig. 3(b) shows a b-scan of the region of interest. Using a dual wavelength approach enables PTOCT to monitor the oxygenation of blood. (36). Figure 3(c) compares the measured oxygen concentration of porcine blood via PTOCT compared to a reading taken using a commercial oximeter (37).
Figure 3.
(a) B-scan PTOCT image of an arterial-venous phantom sample. (B) Blood SO2 level measured by DWP-OCT (vertical) versus oximeter values (horizontal). Blood is stationary for all measurements. Modified from (37). Copyright 2013 SPIE. -
The interest in PTOCT is a rapidly expanding, especially for applications with gold nanostructures. Gold nanoshells and similar plasmonic nanostructures are being investigated for a number of biomedical applications that exploit their tunable plasmon resonances, including biomolecular sensing (38, 39), imaging (40, 41), and diagnostics (42, 43). They are also under investigation for therapy with ongoing clinical trials for the treatment of primary prostate cancer and primary and/or metastatic lung tumors (44). Robust PTOCT imaging technology has the potential to make an impact across many of these areas of interest.
3. Spectroscopic OCT
3.1 Theory of SOCT
Absorption spectroscopy is a common analytical tool used to identify specific molecules, sometimes in very complex samples, not unlike biological tissues. All molecular species have the capacity to absorb light. The absorption spectrum is characteristic of a particular molecular species, but also sensitive to environment. The broad spectral bandwidth of low-coherence light sources used in OCT, especially those used for ultrahigh resolution, are well suited to measuring absorption spectra. Thus, a natural method to achieve molecular contrast via OCT is through what is known as spectroscopic OCT (SOCT) (45) which exploits the broad spectrum light source to garner absorption contrast.
In SOCT there is always a competition between the desire for high spatial resolution and high spectral resolution. Both cannot be simultaneously satisfied leading to the development of a variety of approaches to the inevitable compromise. The approaches, in general, fall into two categories, those that make the compromise in hardware by selecting several light sources with different center wavelength (46, 47) and those that make the compromise in software using post processing algorithms and a single broadband light source (48-51)
One hardware approach uses three light sources to triangulate a peak in the absorption spectrum of a target chromophore [42]. The center wavelength of one source is chosen to coincide with the peak absortion while the other two wavelengths are chosen to coincide with low absorption regions above and below the peak. This method enables the identification of the peak in the attenuation and therefore separate attenuation due to scattering which is approximatelly linear over this range from attenuation due to absorption. Using this approach, Yang et al. [42] imaged indocyanine green in a Xenopus Laevis tadpole. A limitation of this approach is the requirement to select source wavelengths based on a priori knowledge of a given chromophore absorption spectrum.
More commonly, SOCT is performed in post-processing of broadband OCT data via time-frequency transform. This approach is more versatile, enabling the adaptation of the algorithm for each target chromophore in the sample. Three common approaches to a time-frequency transform have been utilized. Two common linear transformations are the short-time Fourier transform (STFT) and the Morlet-wavelet transform (MWT). MWTs are typically performed logarithmically and are therefore more applicable to wider frequency band imaging. They also do not suffer from windowing artifacts found in STFTs (52). Wigner-Ville distributions (WVD) are a form of bilinear transformation which provide better time-frequency responses; however, cross-terms hinder the interpretation of the data. A more detailed discussion of these three techniques may be found in the literature (53) (49) (52).
Wax and coworkers (48) have recently developed an algorithm that incorporates two STFTs, one with a narrow spectral window and one with a broad spectral window, known as a dual window (DW) approach. The two TFDs are multiplied point by point to generate a TFD with both high spatial and spectral resolution. The net result minimizes the trade-off between spectral and spatial resolution similar to that of the WVD. The resulting signal can then be filtered to remove artifacts. Recently, Bosschaart, et al, published a quantitative comparison of short-time Fourier transforms and the DW approach with respect to monitoring the concentration and oxygen saturation of hemoglobin (54). In addition to the tradeoff between spatial and spectral resolution, Bosschaart, et al, discuss the importance of obtaining accurate spectral information when quantifying the concentration of chromophores.
3.2 Applications of SOCT
SOCT can gain contrast from a variety of exogenous chromophores, including the catalogue of commercially available fluorescent dyes primarily used for fluorescence microscopy. The best contrast agents possess a strongly peaked absorption spectrum in the range of the broadband source to be used. A discussion of common near infrared dyes well suited for use in SOCT can be found in the literature (55). Gold nanoparticles have also been utilized for absorption based contrast (19, 56). Varying the size and geometry gold nanostructure enables tuning of the peak of the absorption spectrum (57) to match the broadband source. Custom nanoparticle contrast agents have also been explored for use with true-color spectroscopic optical coherence tomography (58).
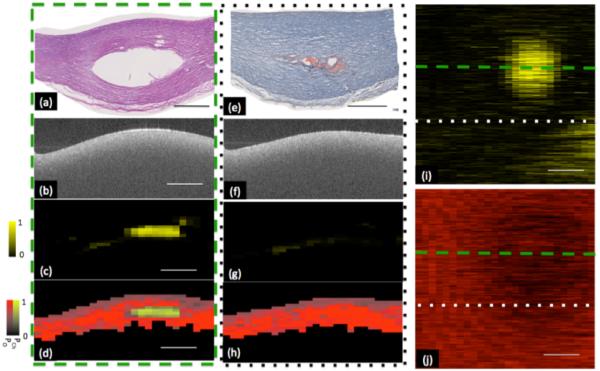
Endogenous contrast has been widely explored for SOCT. Early work monitored the absorption due to water in the cornea through SOCT (59). More recently, the potential for utilizing SOCT to monitor the lipid content of atherosclerotic plaques has been investigated (60). Atherosclerotic phantoms were generated by injecting lipid pools into freshly excised porcine arteries and imaged using a 1300 nm center wavelength FD-OCT system. To obtain spectrally resolved images of the sample, short time Fourier analysis was performed on the raw OCT data. Figure 4 illustrates the system sensitivity to lipid within the sample. The authors compensate for the overlapping spectra of endogenous chromophores through preprocessing to smooth the spectra as well as statistical analysis to determine the presence of lipids (61).
Figure 4.
Representative classification of lipid plaque phantom. Two sites within volumetric data set are shown in (a-d) and (e-h). (a,e) Histology taken through two cross sections within phantom plaque, showing void created by injection of fat emulsion. Corresponding H&E and oil-red-o stains respectively showing void created by the injection of a fat emulsion within center of plaque. (b, f) Optical frequency domain imaging (OFDI) image of phantom lipid plaque corresponding to histology shown in panels a and e respectively. OFDI image shown in panel b is taken through the center of the artificial plaque whereas panel f is taken from the edge of the plaque. (c,g) Probability of cholesterol image derived from the output of the classification algorithm. A high probability of cholesterol is measured from the OFDI image taken through the center of the plaque. A low probability of cholesterol is measured through the edge of the plaque. (d, h) Classification and probability image utilizing a Hue-Saturation-Value (HSV) convention where hue encodes class (red-other, yellow- cholesterol) and saturation and value encode probability. (i) Depth resolved integration of cholesterol probability. (j) Depth resolved integration of collagen probability. Within chemograms, lipid plaque can be seen as a circular region with increased cholesterol (i) and decreased collagen probability (j). Low probability of lipid was coded as black and high probability of lipid was coded as bright yellow. Low probability of collagen was coded as black and high probability of collagen was coded as bright red. Scale bar = 1mm. Reproduced from (60). Copyright 2013 Optical Society of America.
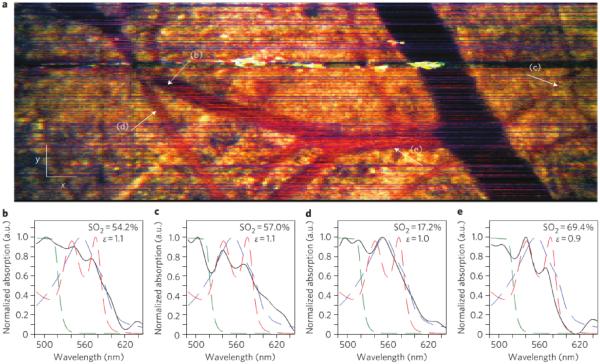
The most common endogenous target for SOCT imaging has been hemoglobin (62, 63). SOCT has been explored both as a way to map vasculature and as a way to measure blood oxygen saturation (64). Robles and coworkers demonstrated the use of a dual window approach, noted above, along with a broadband short wavelength (455-695 nm) source for imaging blood oxygen saturation. Using a mouse window chamber model they were able to measure oxygen saturation in vivo. Figure 5 depicts tissue contrast as well as SO2 measurements in an en face image.
Figure 5.
(a) En face METRiCS OCT image with arrows indicating points where the spectra are extracted. White x and y scale bars, 100 μm. (b)–(e) Spectral profiles from corresponding points in (a). Measured spectral profiles (black) are superposed with the theoretical oxy- (dashed red) and deoxy- (dashed blue) hemoglobin normalized extinction coefficients, and normalized absorption of NaFS (dashed green). Also shown are the SO2 levels and the relative absorption of sodium Fluorescence (NaFS) with respect to total hemoglobin (Hb) (ε ≡ NaFS/Hb). All spectra were selected from depths immediately below each corresponding vessel. Reprinted with permission from (48). Copyright 2011 Macmillan.
The development and application of SOCT is in part driven by the fact that it can largely be implemented as a post-processing algorithm. Hence, it could be widely adapted to current OCT systems including commercial devices used clinically. That being said a confounding factor is that SOCT works best when the absorption spectrum of the target chromophore(s) have a distinct peak in the wavelength band of the light source. For exogenous contrast that largely restricts SOCT imaging to near IR dyes. For endogenous chromophores the OCT system sometimes has to be adapted to the absorption spectrum of the chromophore. For instance, the blood oxygen saturation measurements highlighted above used an atypical short wavelength range OCT system in order to overlap with the distinct visible absorption peaks of oxy and deoxy hemoglobin. Such choices can have an impact on other performance metrics for the OCT system such as the imaging depth.
4. Magnetic Contrast Agents for OCT
4.1 Theory
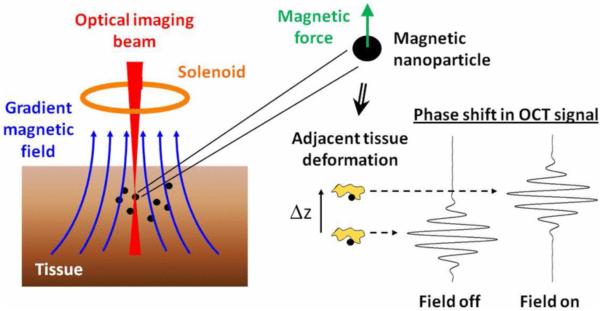
Magnetomotive OCT (MMOCT) exploits induced magnetic motion to enable molecular contrast in OCT. Since human tissues have a low magnetic susceptibility, the introduction of targeted magnetic particles to tissues enables MMOCT to provide highly sensitive molecular contrast (65). Modulated magnetic fields are generated within the sample arm of the OCT system to induce movement or spin of magnetic particles. Movement of the particles can be detected by monitoring the phase variance of the OCT signal[67].
MMOCT is typically implemented in phase sensitive OCT systems through the addition of an electromagnet to the sample arm.. As illustrated in Fig. 6, it is important to align the magnetic coil with the sample such that it generates electromotive forces parallel to the optical axis. To enable frequency domain detection, a sinusoidal modulation is applied to the magnetic field. Localized heating may occur at modulation frequencies greater than 100kHz (66). Imaging is typically performed with modulation frequencies on the order of 10s of Hz. It has been noted in the literature that increasing the strength of the magnetic field yields diminishing returns, with high field strengths eventually resulting in saturation of the magnetic movement (67, 68).
Figure 6.
Cartoon schematic of the principle of MMOCT depicting how a magnetic actuation of nanoparticles inside the imaging volume induces a phase shift in the OCT interferogram. Reprinted with permission from (69). Copyright 2011 IEEE.
MMOCT has primarily been used to image exogenous contrast agents. Other imaging modalities, such as magnetic resonance imaging (70), x-ray luminescence tomography (71), and single photon emission computed tomography (72), have driven the development of magnetic nanoparticles which may also serve as contrast agents for MMOCT. The most prevalent of these magnetic nanoparticles are superparamagnetic iron oxides (SPIOs). SPIOs are ideal for MMOCT because they have sufficient magnetic susceptibility, proven molecular targeting, and have previously been approved by the FDA for in vivo contrast agents in MRI. The primary endogenous magnetic target is hemoglobin. The high concentration of hemoglobin in red blood cells enables them to serve as targets for MMOCT (73). However, in vivo imaging of hemoglobin with MMOCT is confounded by the fact that the red blood cells are also moving.
4.2 Current Applications
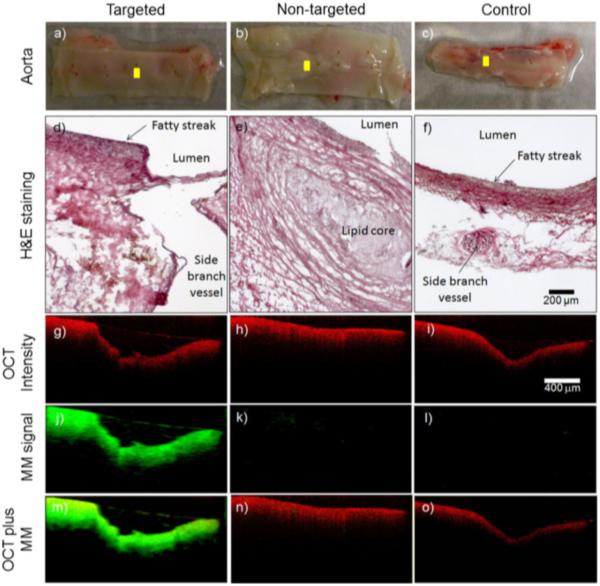
MMOCT has been utilized in targeted applications of magnetic nanoparticles to detect a variety of pathologies. The potential for MMOCT to image atherosclerosis, a disease in which the arterial wall thickens due to the buildup of fats (74), has been explored through selective targeting of key molecular and cellular components. Oh et al demonstrated the ability to detect iron oxide nanoparticles taken up by macrophages in an atherosclerosis animal model (75). More recently, Kim, Ahmad, and coworkers targeted magnetic nanoparticles to αvβ3, an integrin overexpressed in atherosclerosis, by functionalizing the surface of the nanoparticle with the arginine-glycine-aspartic acid (RGD) tripeptide. This technique enabled MMOCT to detect ex vivo atherosclerotic lesions with high specificity. Three ex vivo artherosclerotic lesions were imaged using this technique. The first lesion Fig. 7(a, d, g, j, m) was treated with magnetic nanoparticles functionalized with the RGD tripeptide to target atherosclerotic plaque. The resulting MMOCT image, Fig. 7(j), demonstrates the uptake of the magnetic nanoparticles in the plaque. The second lesion, Fig. 7(b, e, h, k, n) was treated with magnetic nanoparticles that were not targeted to the atherosclerotic plaque. The resulting MMOCT image, Fig. 7(k), shows minimal presence of the the magnetic nanoparticles, implying that functionalization of the nanoparticles enables targeting of the atherosclerotic plaque. Finally, the control lesion, Fig. 7(c, f, I, l, o) demonstrates that the presence of nanoparticles had minimal impact of the morphology seen in the OCT image, and that there is no innate signal from MMOCT((76). The same surface modification can be utilized to target cancerous tissues. In breast cancer, αvβ3 and Her2 receptors are often overexpressed (77). These receptors can be targeted by functionalizing the surface of magnetic nanoparticles with the RGD tripeptide (78).
Figure 7.
Representative MMOCT images from the ex vivo aorta specimens. The visual appearance of the luminal walls of the aortas (a–c) and corresponding histological sections (d–f) reveal the development of early-stage fatty streaks and plaques with lipid cores. OCT structural images (g–i) were superimposed (m–o) with magnetomotive images (j–l). The cross-sectional MMOCT images correspond to the yellow scan lines shown in (a–c). The red and green channels represent the structural OCT intensity and MMOCT signal, respectively. Reprinted with permission from (76). Copyright 2014 Springer.
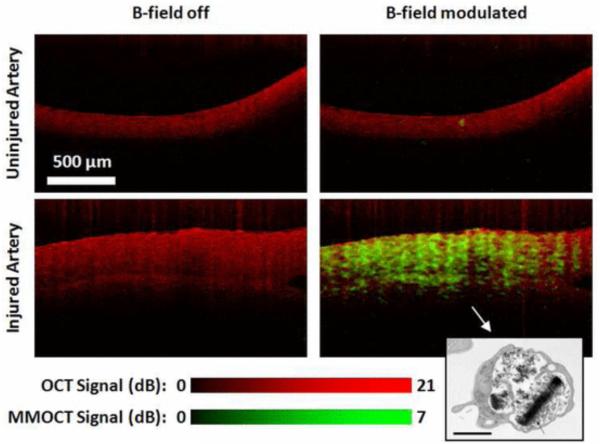
As a substitute for targeting magnetic nanoparticles to specific cells or molecular signals, cells may be tagged in vitro then introduced to a living sample. Two previous studies performed by Oldenburg et al have demonstrated the capability to image magnetically tagged platelets, small cell fragments involved in the wound healing process, using MMOCT. Dextran coated SPIOs were uptaken by platelets and introduced into both in vitro and ex vivo samples to track the location of injured vasculature (68, 69). When contacting activating factors, such as collagen, platelets will aggregate at a region of injury, initiating the clotting of blood (79). Figure 8 depicts the aggregation of SPIO tagged platelets at the site of an injury in vasculature (69).
Figure 8.
OCT (red) and MMOCT (green) of ex vivo porcine arteries exposed to SPIO loaded rehydrated lyophilized (SPIO-RL)platelets in a flow chamber. MMOCT contrast is specific to the artery that was injured, due to specific adhesion of SPIO-RL platelets. Lower right inset: TEM of an SPIO-RL platelet, 1 μm scalebar. Reprinted with permission from (69). Copyright 2011 IEEE.
The fact that there exists FDA approved SPIOs means that MMOCT could make it to clinical application with off-label use of the SPIOs even with only very limited clinical applications. An additional advantage is that much of the labeling chemistry has been worked out such that SPIOs can readily be target to key indicators of pathologies such as cancer and atherosclerosis. Outside of molecular contrast, MMOCT has been shown to potentially be useful for enhancing signal in optical coherence elastography (80) (81).
5. Second Harmonic OCT
5.1 Theory
Second harmonic optical coherence tomography (SHOCT) provides OCT with contrast via the non-linear process of second-harmonic generation (SHG). SHG fundamentally refers to the phenomena where two photons simultaneously interact with a noncentro-symmetric material and combine to generate a single photon with twice the frequency (half the wavelength) (82). Second harmonic generation is a coherent process, hence directly detectable using low coherence interferometry.
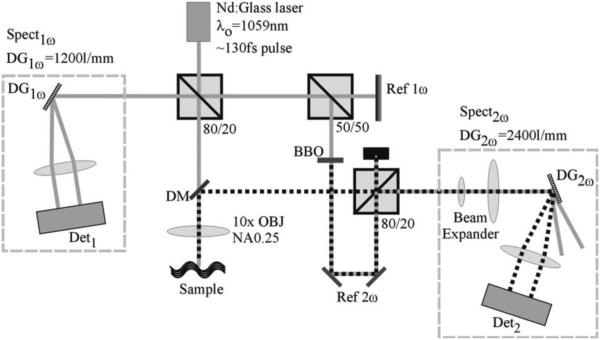
SHOCT requires the use of a femtosecond laser source due to the fact that the second harmonic signal is inversely proportional to the pulse duration of the light source. As a consequence SHOCT is only compatible with spectrometer based OCT or time-domain OCT, i.e. it is incompatible with swept-source techniques. A second requirement is a nonlinear medium, typically a nonlinear crystal, in the reference arm to generate the second harmonic reference signal. Otherwise, the SHOCT optical system can take on any geometry normally used for OCT. Figure 9 illustrates a typical setup of a SHOCT system. Two spectrometers are necessary in order to collect the backscattered near IR (fundamental) light as well as the visible (second harmonic) light. Depth resolution occurs in the same way as for standard OCT except the SHOCT signal is only generated in the tissue where there is noncentro-symmetric media, typically collagen. A SHOCT system is usually setup to have better lateral resolution than a typical OCT system because there is an added benefit to the second harmonic signal strength which is proportional to the square of the fundamental light intensity.
Figure 9.
Schematic of the SD SH-OCT layout. The solid gray line represents the fundamental beam path, and the dotted black line represents the beam path for the secondharmonic light. Spectnω , spectrometer designed for the nth harmonic; DG, diffraction grating; Det, detector; OBJ, objective; NA, numerical aperture. Reproduced from (83). Copyright 2007 Optical Society of America.
5.2 Applications
As noted above the most efficient second harmonic source in biological systems is collagen. The triple helical structure of collagen provides the necessary noncentro-symmetric geometry necessary for SHG (84, 85). Collagen has been the target from the earliest example of SHOCT imaging in tissue (86). An example SHOCT image (87) of rat tail tendon is show in Figure 10a. Many of the morphological structures that are responsible for the mechanical properties of the tendon can be seen in the image, which correlate well with the structures seen in the polarization microscopy image in Fig 10b.
Figure 10.

(a) SH-OCT image showing an area of 100 × 50 μm in the rat-tail tendon, where many cable-like, parallel oriented, and slightly wavy collagen fiber bundles (fascicles) can be visualized; (b) 60X polarization microscope image of the same sample (scale bar: 10 μm). Reproduced with permission from (87). Copyright 2005 AIP Publishing LLC.
Additional information may be extracted from SHOCT by measuring the polarization dependence of the SHOCT signal. This dependence can be quantified with the anisotropy parameter, β= (Iǁ − )/(Iǁ + 2, where ǁ and are respectively the intensity of parallel and perpendicular linear polarization second harmonic signals emitted from the sample. The anisotropy parameter should vary depending on the relative orientation of the collagen fibrils. Applegate et al. (88) demonstrated the first polarization resolved imaging on a sample of salmon skin shown in Fig. 11. Depending on the polarization state, the SHG signal varied across the sample, Fig 11(a) and (b). Vector addition of the signals from the two polarization states lead to the polarization independent image shown in Fig. 11(c). Finally, Fig. 11(d) is a map of the anisotropy parameter indicating the relative orientation of the collagen fibrils.
Figure 11.
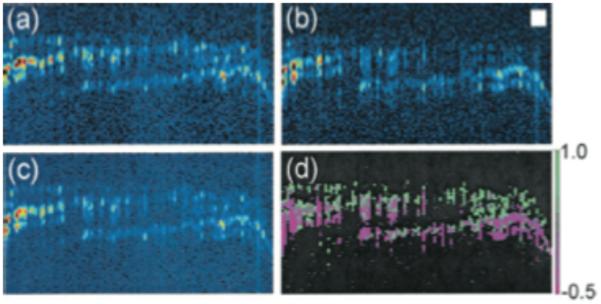
SHOCT image of the overlap of three fish scales, recorded with the reference-arm second- harmonic light polarization parallel to the fundamental light polarization. (b) SHOCT image recorded with the reference-arm second-harmonic light polarization perpendicular to the fundamental light polarization. (c) Polarization-independent image derived from (a) and (b). (d) Image of the anisotropy parameter, β. Reprinted from (88). Copyright 2004 Optical Society of America. Currently, SHOCT is somewhat limited by the prevalent forward scattering of SHG light from collagen. The forward scattered light may be backscattered by a deeper reflector in the sample, confounding localization of the collagen which generated the second harmonic signal. To the best of our knowledge, no exogenous SHG agent has been demonstrated in the literature for SHOCT, further limiting its application.
6. Pump-Probe OCT
6.1 Theory
Pump-Probe optical coherence tomography (PPOCT) integrates OCT with the pump-probe spectroscopy to provide molecular contrast. The pump-probe technique has been widely employed in experimental molecular physics to measure excited electronic states and molecular dynamics. Nominally, in pump-probe spectroscopy, when a molecule absorbs the energy of a pump photon, an electron is promoted into an excited state. The measurements of subsequent probe photon interactions with the molecule reveals how the excited state evolves over time. Both the intensity of the pump-probe interaction and the time evolution of the signal measured by varying the delay between the pump and the probe are unique molecular properties that may be used to distinguish among different molecules. In practice, given the complexity of both the molecules of interest and their tissue environment it is unlikely that the simple mechanism noted above can hold in its entirety. Fundamentally, any mechanism that leads to a change in the probe intensity after interaction with the pump will generate PPOCT signal.
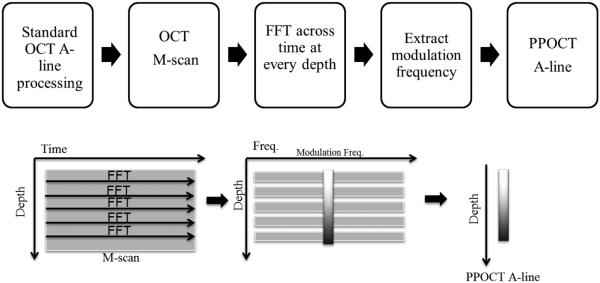
PPOCT may be accomplished by integrating a pump laser into the sample arm of an existing OCT system. The light source for the OCT system may then serve as the probe beam. The pump source needs to be selected based upon the molecular properties of the target molecule. The co-propagating pump and probe beams excite the sample. A typical setup for PPOCT is shown in Fig. 12. By modulating the pump beam with frequency, fm, the pump-probe interaction can be monitored by scanning the sample over time. The frequency response of a time domain PPOCT system can be expressed as the carrier frequency of the reference arm plus or minus fm (89) . In a spectral-domain OCT system, the pump-probe signal can be filtered out from an OCT M-scan (line images measured as a function of time instead of space). The PPOCT signal from spectral domain OCT may be extracted at the fm following a Fourier transform along the time axis of an M-scan. A flow chart of this process is shown in Figure 13.
Figure 12.
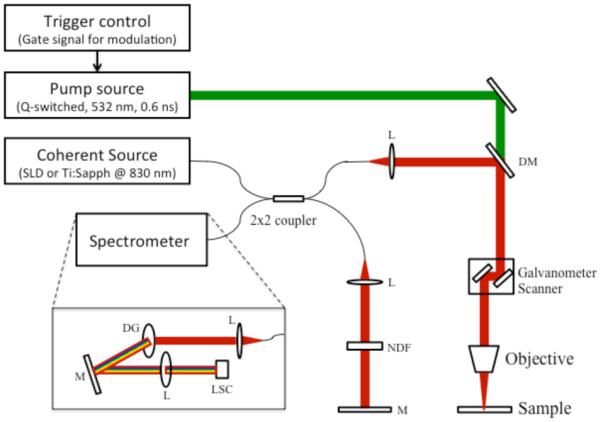
A schematic diagram of PPOCT. Pump light source: Q-switched 532nm laser, Probe light source: SLD or Ti:Sapphire laser at 830nm center wavelength, L: lens, NDF: neutral density filter, DM: dichroic mirror, M: mirror, DG: diffraction grating, LSC: line-scanning camera. Reprinted from (90). Copyright 2013 John Wiley & Sons, Inc.
Figure 13.
Flowchart of data collection and processing of PPOCT. An M-scan of OCT is collected and a Fourier transform is taken at every depth. The modulation frequency is extracted at each depth to compile the PPOCT A-line.
6.2 Applications
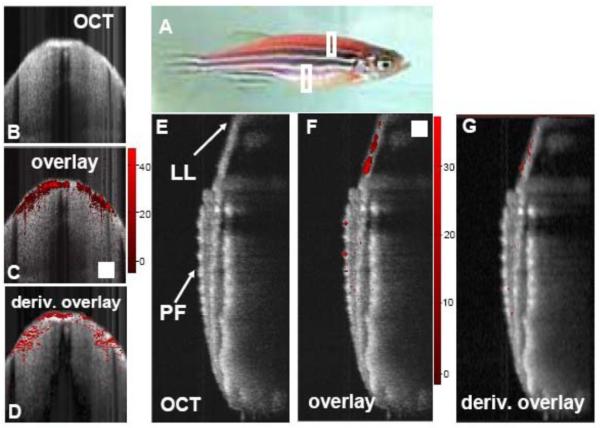
In principle, any molecule that absorbs light can be used as an exogenous contrast agent for PPOCT, including fluorescent dyes and proteins. Indocyanine green (91), dsRed (89), and methylene blue (92) have all been shown to provide contrast via PPOCT. In the initial PPOCT experiments, Rao and coworkers (92) demonstrated the ability to monitor the pump-probe interactions of methylene blue using a 532 nm pump and 800 nm probe. Following up this work, Applegate et al. (89) developed a degenerate PPOCT system with a pump and probe at 532 nm and used it to image the distribution of the fluorescent protein dsRed in the skeletal muscle of transgenic zebrafish. Some results from this study are shown in Fig. 14. Images were recorded from two areas of the zebrafish indicated by the boxes in Fig 14a. OCT images and overlays of the PPOCT onto the OCT images are shown in Figs 14b, c, e, and f. Figures 14 d and g show the overlay of the derivative of the PPOCT signal onto the OCT image. The derivative was calculated to take into account the fact that light absorption is integrated in depth, in other words light can be absorbed along the entire path the light travels, not just where the light is backscattered.
Figure 14.
Fig. 5. A) Photo of transgenic zebra danio fish expressing dsRed in its skeletal muscle. B) OCT cross-section recorded through the back of the fish, anterior to the dorsal fin as indicated by the top white box in the photo. C) Overlay of the corresponding ground state recovery PPOCT (gsrPPOCT) image onto the OCT image in B. The color bar indicates the SNR of the gsrPPOCT signal (max 47 dB). D) Derivative image derived from panel C. E, F, G) Same as B, C, and D except recorded along a cross-section (bottom white box) bisecting the pectoral fin (PF) and continuing into the lateral line (LL). The maximum recorded SNR gsrPPOCT in panel E was 37 dB. The scale box is 200 μm×200 μm.Reprinted with permission from (89). Copyright 2008 Optical Society of America.
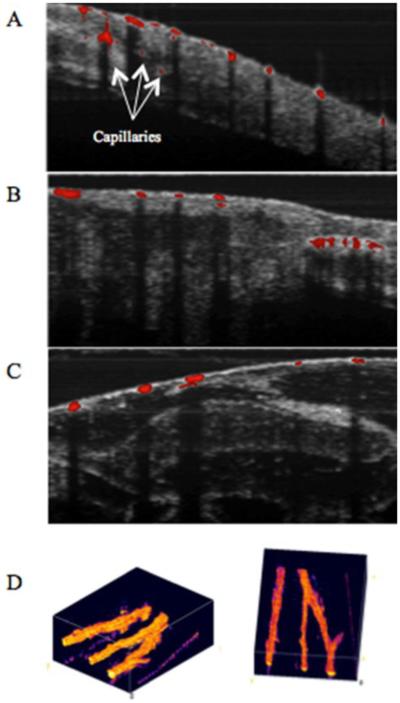
Several endogenous chromophores have also been probed with PPOCT. Previous studies have demonstrated melanin (93, 94), Phytochrome A (95), and hemoglobin (90) imaging via PPOCT. Recently, a two-color (532 nm pump, 830 nm probe) PPOCT system was utilized to image the microvasculature of Xenopus laevis in vivo, shown in Fig. 14. (90) Hemoglobin has a strong absorption peak near 532 nm which causes a change in the probe response of the OCT signal. The Overlays in Figs 14 a, b, and c show a range of vasculature varying in size from capillaries to arterioles/venules. The shadowing in the OCT image below the vessels is due to the strong absorption of 830 nm light and is commonly observed in standard OCT imaging. The strong shadowing largely obviates the need to calculate the derivative image as was done in (89). The ability to directly measure hemoglobin opens up the possibility to measure blood oxygen saturation using approaches similar to those used in photoacoustic imaging (96, 97).
PPOCT imaging has been demonstrated with methylene blue and indocyanine green, two of only a few FDA approved dyes. This taken with the ability to image hemoglobin and the promise of blood oxygen saturation measurements motivates continued development of PPOCT. Using these contrast agents, robust high-speed PPOCT imaging technology could find eventual clinical use.
7. Optical Multimodality Imaging with OCT
7.1. Background
Thus far we have focused on reviewing imaging technologies that somehow derive molecular information from the OCT signal. A second path to the desired end result, an imaging technology that can effectively probe both morphological and biochemical pathological changes in tissue, is to combine modalities. In many cases, individual optical imaging modalities have demonstrated promising results for differentiating between healthy and diseased tissues and cells. However, the complex, pathological mechanisms of disease progression limit the diagnostic accuracy using individual modalities. Combining two or more optical imaging modalities to provide different optical responses of biological samples improves the accuracy, sensitivity and specificity for early diagnosis. In general, the optical multimodality imaging is constructed by combining morphological and functional imaging modalities. As OCT is an excellent morphological imaging modality, a variety of research combining OCT and functional imaging modalities such as steady-state fluorescence spectroscopy (98-100), time-resolved fluorescence lifetime imaging microscopy (FLIM) (5, 101), florescence laminar optical tomography (102, 103) and Raman spectroscopy (104, 105) have been studied for acquiring complementary optical responses of biological samples.
A multimodality imaging system combining OCT with other functional imaging modalities is typically constructed by partially or fully combining optical and mechanical parts, light sources and data acquisition. Figure 16 is an example of a multimodal system that combines OCT and FLIM by using a common set of imaging optics, but otherwise remains two distinct imaging systems.
Figure 16.
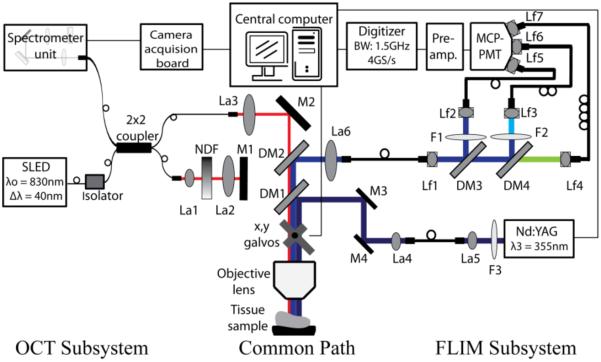
Schematic diagram of the multimodality imaging system by combining OCT and FLIM subsystems. L1, L2 and L5: free-space collimation and coupling lenses, L3, L4, L6-L12: fiber-connected collimation and coupling lenses, NDF: neutral density filter, M1-M4: mirrors, DM1-DM4: dichroic mirrors, and F1-F4: filters. Reprinted with permission from (101). Copyright 2010 Optical Society of America.
7.2 Applications
Fluorescence is widely used as a method of identifying molecular species. The unique fluorescent characteristics of endogenous (e.g. collagen, elastin and NADH) and exogenous (e.g. luciferase, indocyanine green and fluorescein) fluorophores have been measured by steady-state (intensity) and/or time-resolved (lifetime) fluorescence. Changes in characteristic fluorescence with the onset of pathological changes in tissues have been investigated for diagnosing and monitoring various diseases.
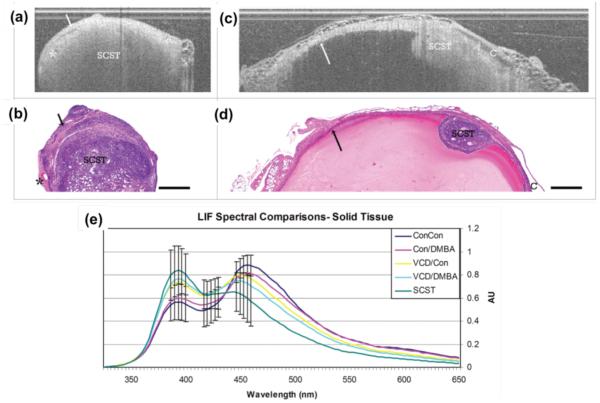
Simultaneous measurement of morphological and biochemical information by combining OCT and different fluorescence detection modalities increase the sensitivity and specificity for detecting cancers (5, 98, 99) and atherosclerotic plaques (101). Barton et al. developed a multimodality imaging system by combining OCT and steady-state laser-induced fluorescence (LIF) spectroscopy for diagnosis of ovarian (98) and colon (99) cancers, and designed an OCT/LIF miniature endoscope for animal and clinical studies (100). Figure 17 demonstrates OCT images and corresponding histology of solid sex cord-stromal tumors (SCST) (a-d) and LIF spectral comparison of all experimental groups (f) with murine ovarian model. They reported that OCT images of solid SCST shows rapid attenuating homogeneous masses and large vascular spaces adjacent to neoplastic masses compared to control tissues. In LIF spectra, 390nm peak is greater than 450nm peak due to high collagen content from thin collagenous capsule and decrease NADH content with slowly proliferating neoplasm with sensitivity of 88% to SCST and specificity of 60% to normal cycling ovaries (98).
Figure 17.
Solid SCST and Life spectral curves. (a) and (b) OCT image of ovary with solid SCST and corresponding histology. (c) and (d) OCT image of solid SCST within benign and corresponding histology. (e) Solid spectral curves. SCST: sex cord-stromal tumor, arrow: benign cyst lining, asterisk: vascular spaces, C: adjacent benign cyst, Scale bar: 500 μm, Con: Control, VCD: 4-vinylcyclohexene diepoxide, DMBA:7,12-dimethylbenz[a]anthracene, Grouping (IP injection/Ovarian injection). Reprinted with permission from (98). Copyright 2010 Landes Bioscience.
A multimodality OCT/FLIM system was developed to simultaneously acquire co-registered OCT and autofluorescence FLIM images for detection of oral cancer using in vivo hamster model (5) and atherosclerotic plaque using ex-vivo human coronary arteries (101). Compared to the steady-state LIF system providing fluorescence intensity only, FLIM can provide fluorescence intensity as well as lifetime as a function of wavelength. The advantage of using lifetime information over intensity is that it is more stable in the experimental environment including motion artifact of samples and variation of excitation pulse energy, which is a critical factor for clinical measurement. Figure 18 shows a volumetric (a) and cross-sectional (b) OCT structure images of a squamous cell carcinoma (SCC) area in an in vivo hamster check pouch, a related histopathology (c) and en-face fluorescence intensity and lifetime images at three target wavelength channels (d). The SCC tumor was significantly thicker (~1mm) than normal oral mucosa (~0.4 mm) and lost the layered structures, as shown in the OCT volume. The fluorescence intensity and lifetime of malignant tissue followed the characteristics of both NADH and FAD, suggesting the autofluorescence emission of malignant tissue (5).
Figure 18.
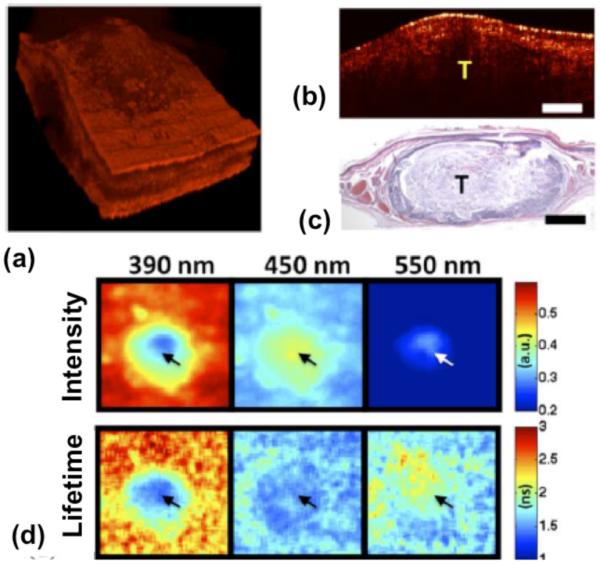
In-vivo co-registered OCT and FLIM images of SCC with hamster check pouch model. (a) OCT 3-D volume shows a thick middle region surrounded by thinner tissue. (b) and (c) sample OCT cross-sectional image and corresponding histology. (d) FLIM images showed two distinct regions: a center area with a fluorescence that is characteristic of nicotinamide adenine dinucleotide (NADH) and flavin adenine dinucleotide (FAD), and a surrounding area with an emission that is characteristic of collagen. Tumor area (tumor (T), scale bar = 300 μm, and field of view: 2 × 2 mm2). Reprinted with permission from (5). Copyright 2010 IEEE.
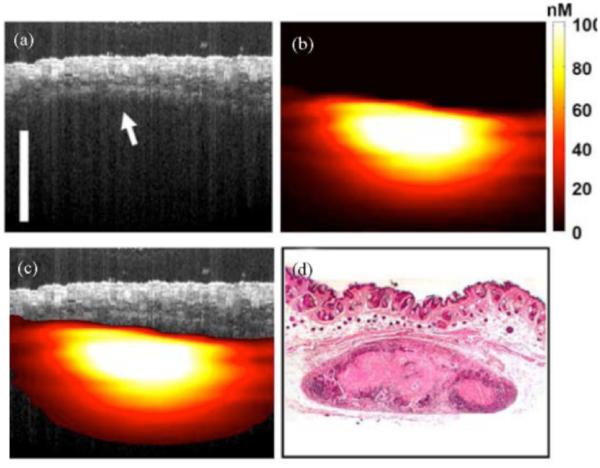
Another optical multimodality imaging technique is to combine OCT and fluorescence laminar optical tomography (FLOT) to simultaneously acquire morphological and molecular information from a biological sample with a depth resolution of a couple millimeters. FLOT uses a photodetector array to detect back-scattered light away from a scanning spot with different pathways. A depth-resolved image is reconstructed from the detected signals utilizing a mathematical algorithm such as a radiative transport equation based on a Monte-Carlo simulation (102, 103). Figure 19 shows OCT/FLOT images of a human breast cancer xenograft model in vivo. In the OCT image (a), the layers of skin are not clear due to the similar scattering, but the boundary between the skin and tumor is clearly visible. The co-registered FLOT image (b) indicates the subcutaneous tumor. The fused OCT/FLOT image (c) demonstrates the position, distribution and size of the tumor located underneath skin, and is confirmed with corresponding histology (d) (103).
Figure 19.
In-vivo co-registered OCT/FLOT image of subcutaneous human breast tumor xenograft in a mouse model. (a) a cross-sectional OCT image of tumor. The boundary between skin and tumor is clearly visible (arrow) (b) Co-registered FLOT image of tumor (c) Fused OCT/FLOT image and (d) corresponding histology. scalebar = 1mm. Reprinted with permission from (103). Copyright 2010 IEEE.
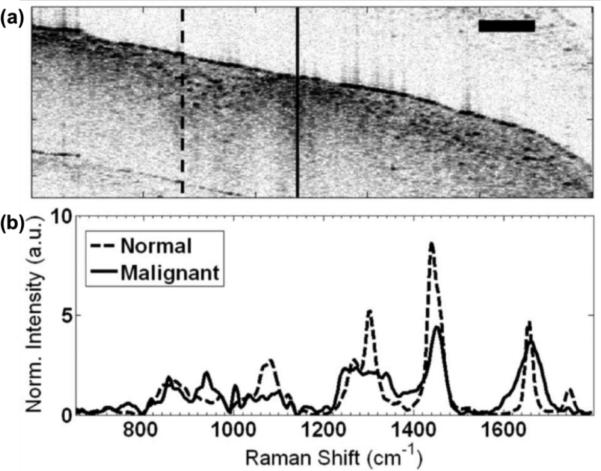
The combination of OCT and Raman spectroscopy (RS) is also capable of providing structural and molecular information from complex tissue samples. Despite the long integration times ranging from approximately 3 to 30 seconds and low quality structural information, near-infrared RS techniques have the advantage of high molecular specificity which can be an asset for detecting cancers (104, 105). The combination with OCT can compensate for some of the drawbacks by providing optical sectioned tomographic images with micron scale resolution. Figure 20 displays an OCT cross-sectional image of ex vivo malignant human breast tissue using an OCT/RS system. Normal and abnormal regions with high-density scattering signals were noted in the OCT cross-sectional image of fig. 20(a). Using the OCT as a guide, RS signal was collected from the areas of interest. Figure 20(b) shows the Raman spectra from the two areas identified as normal and malignant. The Raman spectrum of the normal area was dominated by signals consistent with the presence of lipids. However, the malignant region had showed a higher contribution from DNA and proteins, especially collagen (104).
Figure 20.
OCT Image and Raman shift of ex-vivo malignant human breast tissue from OCT/RS system. (a) OCT cross-sectional image, normal region of tissue (solid line), malignant region of tissue (dashed line) (b) Intensity of Raman shift signal from the (a), scalebar = 500 μm. Reprinted with permission from (104). Copyright 2010 Optical Society of America.
Development of multimodal OCT systems can clearly profit by tapping into the wealth of research that has gone into the modality that it is being paired with. In the case of fluorescence and Raman spectroscopy there has been considerable research related to cancer diagnosis (106, 107). Nevertheless, the ensuing technology tends to be much more complex and requires compromises related to the typical mismatch between imaging speed, resolution, and/or dimensionality of the image (e.g. 2-D v. 3-D).
8. Discussion and Conclusions
In this review, we have highlighted a range of approaches for achieving molecular contrast in OCT. It is difficult to make fair comparisons of the relative sensitivity given the heterogeneity of the approaches. Likewise, each tends to be optimal for different contrast agents. We will refrain from making such comparisons and refer the reader to two prior works (108, 109). Nevertheless, it can be insightful to make some direct comparisons between the approaches.
PTOCT, SOCT, and PPOCT utilize unique approaches to measure absorption. PPOCT and SOCT directly measure the attenuation due to absorption in the tissue sample. PPOCT separates attenuation due to scattering by frequency encoding (via the pump) the absorption signal. SOCT separates attenuation due to absorption from scattering based on the distinct peaked spectral characteristics of the absorber. PPOCT has the added requirement that there must be a resonance at both the pump and probe wavelengths. Both PPOCT and SOCT have to, in some way, deal with the fact that absorption is an integrative process, such that light backscattered from a particular depth in the tissue reports on the attenuation throughout its entire path through the tissue. In PTOCT, photothermal induced changes in the refractive index will alter the optical pathlength of all light that traverses the affected region, hence in a similar manner the measured signal is integrated over the entire pathlength through the tissue. An additional consideration of PTOCT is that if the local heating spreads significantly beyond the area of the absorber the effective resolution can be degraded.
PTOCT, PPOCT, and MMOCT all nominally require time encoding of the molecular signals. In other words multiple A-lines are collected at each spatial position before a post processing algorithm can be applied to extract the molecular information. The number of A-lines needed for the algorithm, clearly impacts the total imaging time.
PTOCT and MMOCT both rely on modifications to what are nominally phase-sensitive OCT systems. Phase-sensitive measurements are very susceptible to small variations in optical pathlength where even the choice of scanning mechanism can significantly impact the noise level of the system. Likewise, while both can nominally operate with modulation frequencies in the 10s of kHz they tend to work better at much lower frequencies, leaving them susceptible to 1/f noise. Both issues can be managed, however it requires additional complexity in the signal processing algorithms and/or system hardware.
The sensitivity of PTOCT, SOCT, PPOCT, and MMOCT are fundamentally bound to the signal-to-noise ratio of the standard OCT signal. In contrast the SHOCT signal is wavelength shifted and detected independently, requiring no algorithm for signal extraction thus preserving imaging speed. For similar reasons the SHOCT signal-to-noise is not bound by the standard OCT signal-to-noise and could in fact be larger given a bright enough second harmonic emitter. On the other hand, SHG tends to be a relatively weak process for collagen in tissue. Likewise, there are currently no proven exogenous contrast agents for SHOCT.
An attractive alternative to developing new technologies that enable molecular imaging through some modulation of the OCT signal is to instead pair OCT with an already established molecular imaging modality. That reduces some of the required development effort, but typically results in a more complex optical system. Likewise, the technical mismatch between the two modalities forces a compromise with respect to resolution, imaging speed, and/or image dimensionality. Nevertheless, this approach holds some promise because it enables pairing with much more mature imaging modalities that have already been heavily investigated as diagnostics for numerous diseases.
An assortment of both endogenous and exogenous contrast agents have been observed with the technologies reviewed here. Clearly the ability to measure endogenous contrast or FDA approved contrast agents will facilitate clinical application of these techniques. In all cases there is still rese
Figure 15.
(A), (B), and (C) are PPOCT B-scans overlaid on the corresponding co-registered OCT B-scans. X. laevis vasculature are clearly depicted. Arrows in (A) point to capillaries that were not visible in conventional OCT. Scale bar is 100 μm. (D) Two views of a volumetric reconstruction of the PPOCT data recorded on a euthanized Xenopus tadpole. The volume is 2 mm × 2 mm × 1 mm. The lines in the lower left and right edges of the images are artifacts. Modified from (90). Copyright 2013 John Wiley & Sons, Inc.
Acknowledgements
We gratefully acknowledge financial support for some of the work reviewed here from the National Institutes of Health (1R21CA132433, 1R21RR025799, 1R21EB007729, 1R01HL111361) and the National Science Foundation (CBET-1055359).
Footnotes
The published manuscript is available at EurekaSelect via http://www.eurekaselect.com/128182/issue/2
References
- 1.Gora MJ, Sauk JS, Carruth RW, Gallagher KA, Suter MJ, Nishioka NS, et al. Tethered capsule endomicroscopy enables less invasive imaging of gastrointestinal tract microstructure. Nature Medicine. 2013;19(2):238–40. doi: 10.1038/nm.3052. [DOI] [PMC free article] [PubMed] [Google Scholar]
- 2.Chen Y, Aguirre AD, Hsiung PL, Desai S, Herz PR, Pedrosa M, et al. Ultrahigh resolution optical coherence tomography of Barrett's esophagus: preliminary descriptive clinical study correlating images with histology. Endoscopy. 2007;39(7):599–605. doi: 10.1055/s-2007-966648. [DOI] [PubMed] [Google Scholar]
- 3.Karl A, Stepp H, Willmann E, Buchner A, Hocaoglu Y, Stief C, et al. Optical coherence tomography for bladder cancer -- ready as a surrogate for optical biopsy? Results of a prospective mono-centre study. European journal of medical research. 2010;15(3):131–4. doi: 10.1186/2047-783X-15-3-131. [DOI] [PMC free article] [PubMed] [Google Scholar]
- 4.Kim CS, Wilder-Smith P, Ahn YC, Liaw LHL, Chen ZP, Kwon YJ. Enhanced detection of early-stage oral cancer in vivo by optical coherence tomography using multimodal delivery of gold nanoparticles. Journal of Biomedical Optics. 2009;14(3) doi: 10.1117/1.3130323. [DOI] [PMC free article] [PubMed] [Google Scholar]
- 5.Jo JA, Applegate BE, Park J, Shrestha S, Pande P, Gimenez-Conti IB, et al. In Vivo Simultaneous Morphological and Biochemical Optical Imaging of Oral Epithelial Cancer. Ieee T Bio-Med Eng. 2010;57(10):2596–9. doi: 10.1109/TBME.2010.2060485. [DOI] [PMC free article] [PubMed] [Google Scholar]
- 6.Gladkova ND, Petrova GA, Nikulin NK, Radenska-Lopovok SG, Snopova LB, Chumakov YP, et al. In vivo optical coherence tomography imaging of human skin: norm and pathology. Skin Res Technol. 2000;6(1):6–16. doi: 10.1034/j.1600-0846.2000.006001006.x. [DOI] [PubMed] [Google Scholar]
- 7.Greaves N, Benatar B, Baguneid M, Bayat A. Is Noninvasive Optical Coherence Tomography a Reliable Alternative to Invasive Histological Assessment of Acute Wound Healing in Human Skin? Wound Repair Regen. 2013;21(6):A66. doi: 10.1111/bjd.12786. A. [DOI] [PubMed] [Google Scholar]
- 8.Srinivas SM, de Boer JF, Park H, Keikhanzadeh K, Huang HEL, Zhang J, et al. Determination of burn depth by polarization-sensitive optical coherence tomography. Journal of Biomedical Optics. 2004;9(1):207–12. doi: 10.1117/1.1629680. [DOI] [PubMed] [Google Scholar]
- 9.Nguyen FT, Zysk AM, Chaney EJ, Kotynek JG, Oliphant UJ, Bellafiore FJ, et al. Intraoperative evaluation of breast tumor margins with optical coherence tomography. Cancer Res. 2009;69(22):8790–6. doi: 10.1158/0008-5472.CAN-08-4340. [DOI] [PMC free article] [PubMed] [Google Scholar]
- 10.Alawi SA, Kuck M, Wahrlich C, Batz S, McKenzie G, Fluhr JW, et al. Optical coherence tomography for presurgical margin assessment of non-melanoma skin cancer - a practical approach. Experimental dermatology. 2013;22(8):547–51. doi: 10.1111/exd.12196. [DOI] [PubMed] [Google Scholar]
- 11.Drexler W, Fujimoto JG, SpringerLink (Online service) Berlin. Springer; New York: 2008. Optical coherence tomography technology and applications. Available from: http://lib-ezproxy.tamu.edu:2048/login?url=http://dx.doi.org/10.1007/978-3-540-77550-8. [Google Scholar]
- 12.Klein T, Wieser W, Andre R, Pfeiffer T, Eigenwillig CM, Huber R. Multi-MHz FDML OCT: Snapshot retinal imaging at 6.7 million axial-scans per second. Optical Coherence Tomography and Coherence Domain Optical Methods in Biomedicine Xvi. 2012:8213. [Google Scholar]
- 13.Xu JJ, Zhang C, Xu JB, Wong KKY, Tsia KK. Megahertz all-optical swept-source optical coherence tomography based on broadband amplified optical time-stretch. Opt Lett. 2014;39(3):622–5. doi: 10.1364/OL.39.000622. [DOI] [PubMed] [Google Scholar]
- 14.Telenkov SA, Dave DP, Milner TE. Low-coherence optical probe for non-contact detection of photothermal and photoacoustic phenomena in biomaterials. Rev Prog Q. 2003;20:852–8. [Google Scholar]
- 15.Telenkov SA, Dave DP, Sethuraman S, Akkin T, Milner TE. Differential phase optical coherence probe for depth-resolved detection of photothermal response in tissue. Phys Med Biol. 2004;49(1):111–9. doi: 10.1088/0031-9155/49/1/008. [DOI] [PubMed] [Google Scholar]
- 16.Akkin T, Dave DP, Youn JI, Telenkov SA, Rylander HG, Milner TE. Imaging tissue response to electrical and photothermal stimulation with nanometer sensitivity. Laser Surg Med. 2003;33(4):219–25. doi: 10.1002/lsm.10221. [DOI] [PubMed] [Google Scholar]
- 17.Kim J, Oh J, Milner TE. Measurement of optical path length change following pulsed laser irradiation using differential phase optical coherence tomography. J Biomed Opt. 2006;11:041122. doi: 10.1117/1.2236289. [DOI] [PubMed] [Google Scholar]
- 18.Guan G, Reif R, Huang Z, Wang RK. Depth profiling of photothermal compound concentrations using phase sensitive optical coherence tomography. J Biomed Opt. 2011;16:126003. doi: 10.1117/1.3659211. [DOI] [PMC free article] [PubMed] [Google Scholar]
- 19.Skala MC, Crow MJ, Wax A, Izatt JA. Photothermal optical coherence tomography of epidermal growth factor receptor in live cells using immunotargeted gold nanospheres. Nano letters. 2008;8:3461–7. doi: 10.1021/nl802351p. [DOI] [PMC free article] [PubMed] [Google Scholar]
- 20.Tucker-Schwartz JM, Meyer TA, Patil CA, Duvall CL, Skala MC. In vivo photothermal optical coherence tomography of gold nanorod contrast agents. Biomed Opt Express. 2012;3:2881–95. doi: 10.1364/BOE.3.002881. [DOI] [PMC free article] [PubMed] [Google Scholar]
- 21.Adler DC, Huang S-W, Huber R, Fujimoto JG. Photothermal detection of gold nanoparticles using phase-sensitive optical coherence tomography. Opt Express. 2008;16:4376. doi: 10.1364/oe.16.004376. [DOI] [PubMed] [Google Scholar]
- 22.Boyer D, Tamarat P, Maali A, Lounis B, Orrit M. Photothermal imaging of nanometer-sized metal particles among scatterers. Science. 2002;297(5584):1160–3. doi: 10.1126/science.1073765. [DOI] [PubMed] [Google Scholar]
- 23.Zhou C, Tsai T-H, Adler DC, Lee H-C, Cohen DW, Mondelblatt A, et al. Photothermal optical coherence tomography in ex vivo human breast tissues using gold nanoshells. Opt Lett. 2010;35:700–2. doi: 10.1364/OL.35.000700. [DOI] [PMC free article] [PubMed] [Google Scholar]
- 24.Pache C, Bocchio NL, Bouwens A, Villiger M, Berclaz C, Goulley J, et al. Fast three-dimensional imaging of gold nanoparticles in living cells with photothermal optical lock-in Optical Coherence Microscopy. Opt Express. 2012;20:21385–99. doi: 10.1364/OE.20.021385. [DOI] [PubMed] [Google Scholar]
- 25.Kennedy LC, Bickford LR, Lewinski NA, Coughlin AJ, Hu Y, Day ES, et al. A new era for cancer treatment: gold-nanoparticle-mediated thermal therapies. Small (Weinheim an der Bergstrasse, Germany) 2011;7:169–83. doi: 10.1002/smll.201000134. [DOI] [PubMed] [Google Scholar]
- 26.Zhang HT, Berezov A, Wang Q, Zhang G, Drebin J, Murali R, et al. ErbB receptors: from oncogenes to targeted cancer therapies. J Clin Invest. 2007;117(8):2051–8. doi: 10.1172/JCI32278. [DOI] [PMC free article] [PubMed] [Google Scholar]
- 27.Lynch TJ, Bell DW, Sordella R, Gurubhagavatula S, Okimoto RA, Brannigan BW, et al. Activating mutations in the epidermal growth factor receptor underlying responsiveness of non-small-cell lung cancer to gefitinib. New Engl J Med. 2004;350(21):2129–39. doi: 10.1056/NEJMoa040938. [DOI] [PubMed] [Google Scholar]
- 28.Puvanakrishnan P, Diagaradjane P, Kazmi SMS, Dunn AK, Krishnan S, Tunnell JW. Narrow band imaging of squamous cell carcinoma tumors using topically delivered anti-EGFR antibody conjugated gold nanorods. Laser Surg Med. 2012;44(4):310–7. doi: 10.1002/lsm.22019. [DOI] [PubMed] [Google Scholar]
- 29.Keely NO, Meegan MJ. Targeting tumors using estrogen receptor ligand conjugates. Current cancer drug targets. 2009;9:370–80. doi: 10.2174/156800909788166628. [DOI] [PubMed] [Google Scholar]
- 30.Kasaragod D, Au KM, Lu ZH, Childs D, Armes SP, Matcher SJ. Photothermal detection of the contrast properties of polypyrrole nanoparticles using optical coherence tomography. Reporters, Markers, Dyes, Nanoparticles, and Molecular Probes for Biomedical Applications V. 2013;8596 [Google Scholar]
- 31.Subhash HM, Xie H, Smith JW, McCarty OJT. Optical detection of indocyanine green encapsulated biocompatible poly (lactic-co-glycolic) acid nanoparticles with photothermal optical coherence tomography. Opt Lett. 2012;37:981. doi: 10.1364/ol.37.000981. [DOI] [PMC free article] [PubMed] [Google Scholar]
- 32.Jung Y, Guan G, Wei C-W, Reif R, Gao X, O'Donnell M, et al. Multifunctional nanoprobe to enhance the utility of optical based imaging techniques. J Biomed Opt. 2012;17:016015. doi: 10.1117/1.JBO.17.1.016015. [DOI] [PMC free article] [PubMed] [Google Scholar]
- 33.Maslov K, Stoica G, Wang LV. In vivo dark-field reflection-mode photoacoustic microscopy. Opt Lett. 2005;30:625. doi: 10.1364/ol.30.000625. [DOI] [PubMed] [Google Scholar]
- 34.Yao DK, Chen RM, Maslov K, Zhou QF, Wang LV. Optimal ultraviolet wavelength for in vivo photoacoustic imaging of cell nuclei. J Biomed Opt. 2012;17(5) doi: 10.1117/1.JBO.17.5.056004. [DOI] [PMC free article] [PubMed] [Google Scholar]
- 35.Zhang C, Zhang YS, Yao DK, Xia YN, Wang LHV. Label-free photoacoustic microscopy of cytochromes. J Biomed Opt. 2013;18(2) doi: 10.1117/1.JBO.18.2.020504. [DOI] [PMC free article] [PubMed] [Google Scholar]
- 36.Tay BC-M, Chow T-H, Ng B-K, Loh TK-S. Dual-window dual-bandwidth spectroscopic optical coherence tomography metric for qualitative scatterer size differentiation in tissues. IEEE transactions on bio-medical engineering. 2012;59:2439–48. doi: 10.1109/TBME.2012.2202391. [DOI] [PubMed] [Google Scholar]
- 37.Yin B, Kuranov RV, McElroy AB, Kazmi S, Dunn AK, Duong TQ, et al. Dual-wavelength photothermal optical coherence tomography for imaging microvasculature blood oxygen saturation. J Biomed Opt. 2013;18:56005. doi: 10.1117/1.JBO.18.5.056005. [DOI] [PMC free article] [PubMed] [Google Scholar]
- 38.Raschke G, Brogl S, Susha AS, Rogach AL, Klar TA, Feldmann J, et al. Gold nanoshells improve single nanoparticle molecular sensors. Nano Lett. 2004;4(10):1853–7. [Google Scholar]
- 39.Wang Y, Qian WP, Tan Y, Ding SH. A label-free biosensor based on gold nanoshell monolayers for monitoring biomolecular interactions in diluted whole blood. Biosens Bioelectron. 2008;23(7):1166–70. doi: 10.1016/j.bios.2007.10.020. [DOI] [PubMed] [Google Scholar]
- 40.Skala MC, Crow MJ, Wax A, Izatt JA. Photothermal Optical Coherence Tomography of Epidermal Growth Factor Receptor in Live Cells Using Immunotargeted Gold Nanospheres. Nano Letters. 2008;8(10):3461–7. doi: 10.1021/nl802351p. [DOI] [PMC free article] [PubMed] [Google Scholar]
- 41.Su CH, Sheu HS, Lin CY, Huang CC, Lo YW, Pu YC, et al. Nanoshell magnetic resonance imaging contrast agents. J Am Chem Soc. 2007;129(7):2139–46. doi: 10.1021/ja0672066. [DOI] [PubMed] [Google Scholar]
- 42.Gobin AM, Lee MH, Halas NJ, James WD, Drezek RA, West JL. Near-infrared resonant nanoshells for combined optical imaging and photothermal cancer therapy. Nano Lett. 2007;7(7):1929–34. doi: 10.1021/nl070610y. [DOI] [PubMed] [Google Scholar]
- 43.Coughlin AJ, Ananta JS, Deng N, Larina IV, Decuzzi P, West JL. Gadolinium-Conjugated Gold Nanoshells for Multimodal Diagnostic Imaging and Photothermal Cancer Therapy. Small. 2013 doi: 10.1002/smll.201302217. [DOI] [PMC free article] [PubMed] [Google Scholar]
- 44.Nanospectra Biosciences I [cited 2014 January 29]. Available from: http://www.nanospectra.com/about/about.html.
- 45.Morgner U, Drexler W, Kärtner FX, Li XD, Pitris C, Ippen EP, et al. Spectroscopic optical coherence tomography. Opt Lett. 2000;25:111. doi: 10.1364/ol.25.000111. [DOI] [PubMed] [Google Scholar]
- 46.Schmitt JM, Xiang SH, Yung KM. Differential absorption imaging with optical coherence tomography. Journal of the Optical Society of America A. 1998;15:2288. [Google Scholar]
- 47.Yang CH, McGuckin LEL, Simon JD, Choma MA, Applegate BE, Izatt JA. Spectral triangulation molecular contrast optical coherence tomography with indocyanine green as the contrast agent. Opt Lett. 2004;29(17):2016–8. doi: 10.1364/ol.29.002016. [DOI] [PMC free article] [PubMed] [Google Scholar]
- 48.Robles FE, Wilson C, Grant G, Wax A. Molecular imaging true-colour spectroscopic optical coherence tomography. Nature photonics. 2011;5:744–7. doi: 10.1038/nphoton.2011.257. [DOI] [PMC free article] [PubMed] [Google Scholar]
- 49.Xu C, Kamalabadi F, Boppart SA. Comparative performance analysis of time-frequency distributions for spectroscopic optical coherence tomography. Appl Optics. 2005;44:1813. doi: 10.1364/ao.44.001813. [DOI] [PubMed] [Google Scholar]
- 50.Jaedicke V, Agcaer S, Robles FE, Steinert M, Jones D, Goebel S, et al. Comparison of different metrics for analysis and visualization in spectroscopic optical coherence tomography. Biomed Opt Express. 2013;4:2945–61. doi: 10.1364/BOE.4.002945. [DOI] [PMC free article] [PubMed] [Google Scholar]
- 51.Bosschaart N, Aalders MCG, Faber DJ, Weda JJA, van Gemert MJC, van Leeuwen TG. Quantitative measurements of absorption spectra in scattering media by low-coherence spectroscopy. Opt Lett. 2009;34(23):3746–8. doi: 10.1364/OL.34.003746. [DOI] [PubMed] [Google Scholar]
- 52.Oldenburg AL, Xu C, Boppart SA. Spectroscopic Optical Coherence Tomography and Microscopy. IEEE Journal of Selected Topics in Quantum Electronics. 2007;13:1629–40. [Google Scholar]
- 53.Kang JU, Liu XA. High Resolution Hemoglobin Oxygen Saturation Level Imaging Using Morlet Wavelet Transformed Spectroscopic Optical Coherence Tomography. I S Biomed Imaging. 2010:1431–4. [Google Scholar]
- 54.Bosschaart N, van Leeuwen TG, Aalders MCG, Faber DJ. Quantitative comparison of analysis methods for spectroscopic optical coherence tomography. Biomed Opt Express. 2013;4(11):2570–84. doi: 10.1364/BOE.4.002570. [DOI] [PMC free article] [PubMed] [Google Scholar]
- 55.Xu C, Ye J, Marks DL, Boppart SA. Near-infrared dyes as contrast-enhancing agents for spectroscopic optical coherence tomography. Opt Lett. 2004;29:1647. doi: 10.1364/ol.29.001647. [DOI] [PubMed] [Google Scholar]
- 56.Oldenburg AL, Hansen MN, Ralston TS, Wei A, Boppart SA. Imaging gold nanorods in excised human breast carcinoma by spectroscopic optical coherence tomography. Journal of materials chemistry. 2009;19:6407. doi: 10.1039/b823389f. [DOI] [PMC free article] [PubMed] [Google Scholar]
- 57.Khlebtsov NG, Dykman LA. Optical properties and biomedical applications of plasmonic nanoparticles. Journal of Quantitative Spectroscopy and Radiative Transfer. 2010;111:1–35. [Google Scholar]
- 58.Li YL, Seekell K, Yuan HK, Robles FE, Wax A. Multispectral nanoparticle contrast agents for true-color spectroscopic optical coherence tomography. Biomed Opt Express. 2012;3(8):1914–23. doi: 10.1364/BOE.3.001914. [DOI] [PMC free article] [PubMed] [Google Scholar]
- 59.Pircher M, Gotzinger E, Leitgeb R, Fercher AF, Hitzenberger CK. Measurement and imaging of water concentration in human cornea with differential absorption optical coherence tomography. Opt Express. 2003;11(18):2190–7. doi: 10.1364/oe.11.002190. [DOI] [PubMed] [Google Scholar]
- 60.Fleming CP, Eckert J, Halpern EF, Gardecki JA, Tearney GJ. Depth resolved detection of lipid using spectroscopic optical coherence tomography. Biomed Opt Express. 2013;4(8):1269–84. doi: 10.1364/BOE.4.001269. [DOI] [PMC free article] [PubMed] [Google Scholar]
- 61.Barnes RJ, Dhanoa MS, Lister SJ. Standard Normal Variate Transformation and De-Trending of near-Infrared Diffuse Reflectance Spectra. Appl Spectrosc. 1989;43(5):772–7. [Google Scholar]
- 62.Faber DJ, Mik EG, Aalders MCG, van Leeuwen TG. Toward assessment of blood oxygen saturation by spectroscopic optical coherence tomography. Opt Lett. 2005;30:1015. doi: 10.1364/ol.30.001015. [DOI] [PubMed] [Google Scholar]
- 63.Faber DJ, Mik EG, Aalders MCG, van Leeuwen TG. Light absorption of (oxy-)hemoglobin assessed by spectroscopic optical coherence tomography. Opt Lett. 2003;28(16):1436–8. doi: 10.1364/ol.28.001436. [DOI] [PubMed] [Google Scholar]
- 64.Bosschaart N, Faber DJ, van Leeuwen TG, Aalders MCG. In vivo low-coherence spectroscopic measurements of local hemoglobin absorption spectra in human skin. J Biomed Opt. 2011;16(10) doi: 10.1117/1.3644497. [DOI] [PubMed] [Google Scholar]
- 65.Oldenburg AL, Gunther JR, Boppart SA. Imaging magnetically labeled cells with magnetomotive optical coherence tomography. Opt Lett. 2005;30:747. doi: 10.1364/ol.30.000747. [DOI] [PubMed] [Google Scholar]
- 66.Hamaguchi S, Tohnai I, Ito A, Mitsudo K, Shigetomi T, Ito M, et al. Selective hyperthermia using magnetoliposomes to target cervical lymph node metastasis in a rabbit tongue tumor model. Cancer Sci. 2003;94(9):834–9. doi: 10.1111/j.1349-7006.2003.tb01527.x. [DOI] [PMC free article] [PubMed] [Google Scholar]
- 67.Oldenburg AL, Crecea V, Rinne SA, Boppart SA. Phase-resolved magnetomotive OCT for imaging nanomolar concentrations of magnetic nanoparticles in tissues. Opt Express. 2008;16:11525–39. [PMC free article] [PubMed] [Google Scholar]
- 68.Oldenburg AL, , Gallippi CM, , Tsui F, , Nichols TC, , Beicker KN, , Chhetri RK, et al. Magnetic and contrast properties of labeled platelets for magnetomotive optical coherence tomography. Biophysical journal. 2010;99:2374–83. doi: 10.1016/j.bpj.2010.08.007. [DOI] [PMC free article] [PubMed] [Google Scholar]
- 69.Oldenburg AL, Wu G, Spivak D, Tsui F, Wolberg AS, Fischer TH. Imaging and Elastometry of Blood Clots Using Magnetomotive Optical Coherence Tomography and Labeled Platelets. IEEE journal of selected topics in quantum electronics : a publication of the IEEE Lasers and Electro-optics Society. 2011;18:1100–9. doi: 10.1109/JSTQE.2011.2162580. [DOI] [PMC free article] [PubMed] [Google Scholar]
- 70.Pouliquen D, Perdrisot R, Ermias A, Akoka S, Jallet P, Lejeune JJ. Superparamagnetic Iron-Oxide Nanoparticles as a Liver Mri Contrast Agent - Contribution of Microencapsulation to Improved Biodistribution. Magn Reson Imaging. 1989;7(6):619–27. doi: 10.1016/0730-725x(89)90530-4. [DOI] [PubMed] [Google Scholar]
- 71.Chen H, Colvin DC, Qi B, Moore T, He J, Mefford OT, et al. Magnetic and optical properties of multifunctional core-shell radioluminescence nanoparticles. Journal of materials chemistry. 2012;22:12802–9. doi: 10.1039/C2JM15444G. [DOI] [PMC free article] [PubMed] [Google Scholar]
- 72.Madru R, Kjellman P, Olsson F, Wingardh K, Ingvar C, Stahlberg F, et al. Tc-99m-Labeled Superparamagnetic Iron Oxide Nanoparticles for Multimodality SPECT/MRI of Sentinel Lymph Nodes. J Nucl Med. 2012;53(3):459–63. doi: 10.2967/jnumed.111.092437. [DOI] [PubMed] [Google Scholar]
- 73.Kim J, Oh J, Milner TE, Nelson JS. Hemoglobin contrast in magnetomotive optical Doppler tomography. Optics Letters. 2006;31(6):778–80. doi: 10.1364/ol.31.000778. [DOI] [PubMed] [Google Scholar]
- 74.Debus ES, Torsello G, Schmitz-Rixen T, Hupp T, Lang W, Noppeney T, et al. Manifestations and prevention of arteriosclerosis. Gefasschirurgie. 2013;18(7):644–51. [Google Scholar]
- 75.Oh J, Feldman MD, Kim J, Kang HW, Sanghi P, Milner TE. Magneto-motive detection of tissue-based macrophages by differential phase optical coherence tomography. Laser Surg Med. 2007;39(3):266–72. doi: 10.1002/lsm.20473. [DOI] [PubMed] [Google Scholar]
- 76.Kim J, Ahmad A, Marjanovic M, Chaney EJ, Li J, Rasio J, et al. Magnetomotive Optical Coherence Tomography for the Assessment of Atherosclerotic Lesions Using alpha(v)beta(3) Integrin-Targeted Microspheres. Mol Imaging Biol. 2014;16(1):36–43. doi: 10.1007/s11307-013-0671-6. [DOI] [PMC free article] [PubMed] [Google Scholar]
- 77.Tal M, King CR, Kraus MH, Ullrich A, Schlessinger J, Givol D. Human Her2 (Neu) Promoter - Evidence for Multiple Mechanisms for Transcriptional Initiation. Mol Cell Biol. 1987;7(7):2597–601. doi: 10.1128/mcb.7.7.2597. [DOI] [PMC free article] [PubMed] [Google Scholar]
- 78.John R, Nguyen FT, Kolbeck KJ, Chaney EJ, Marjanovic M, Suslick KS, et al. Targeted multifunctional multimodal protein-shell microspheres as cancer imaging contrast agents. Molecular imaging and biology : MIB : the official publication of the Academy of Molecular Imaging. 2012;14:17–24. doi: 10.1007/s11307-011-0473-7. [DOI] [PMC free article] [PubMed] [Google Scholar]
- 79.Broughton G, Janis JE, Attinger CE. The basic science of wound healing. Plast Reconstr Surg. 2006;117(7):12s–34s. doi: 10.1097/01.prs.0000225430.42531.c2. [DOI] [PubMed] [Google Scholar]
- 80.Crecea V, Ahmad A, Boppart SA. Magnetomotive optical coherence elastography for microrheology of biological tissues. J Biomed Opt. 2013;18(12):121504. doi: 10.1117/1.JBO.18.12.121504. [DOI] [PMC free article] [PubMed] [Google Scholar]
- 81.Liang X, Crecea V, Boppart SA. Dynamic Optical Coherence Elastography: A Review. J Innov Opt Heal Sci. 2010;3(4):221–33. doi: 10.1142/S1793545810001180. [DOI] [PMC free article] [PubMed] [Google Scholar]
- 82.Bloember N, Chang RK, Jha SS, Lee CH. Optical Second-Harmonic Generation in Reflection from Media with Inversion Symmetry. Phys Rev. 1968;174(3):813. &. [Google Scholar]
- 83.Sarunic MV, Applegate BE, Izatt JA. Spectral domain second harmonic optical coherence tomography. Optics Letters. 2005;30(18):2391–3. doi: 10.1364/ol.30.002391. [DOI] [PubMed] [Google Scholar]
- 84.Fraser RDB, MacRae TP. The crystalline structure of collagen fibrils in tendon. Journal of Molecular Biology. 1979;127(1):129–33. doi: 10.1016/0022-2836(79)90463-7. [DOI] [PubMed] [Google Scholar]
- 85.Shoulders MD, Raines RT. Collagen Structure and Stability. Annu Rev Biochem. 2009;78:929–58. doi: 10.1146/annurev.biochem.77.032207.120833. [DOI] [PMC free article] [PubMed] [Google Scholar]
- 86.Jiang Y, Tomov I, Wang YM, Chen ZP. Second-harmonic optical coherence tomography. Optics Letters. 2004;29(10):1090–2. doi: 10.1364/ol.29.001090. [DOI] [PubMed] [Google Scholar]
- 87.Jiang Y, Tomov IV, Wang YM, Chen ZP. High-resolution second-harmonic optical coherence tomography of collagen in rat-tail tendon. Appl Phys Lett. 2005;86(13) [Google Scholar]
- 88.Applegate BE, Yang CH, Rollins AM, Izatt JA. Polarization-resolved second-harmonic-generation optical coherence tomography in collagen. Optics Letters. 2004;29(19):2252–4. doi: 10.1364/ol.29.002252. [DOI] [PubMed] [Google Scholar]
- 89.Applegate BE, Izatt JA. Molecular imaging of endogenous and exogenous molecular chromophores with ground state recovery pump-probe optical coherence tomography. Optics Express. 2006;14(20):9142–55. doi: 10.1364/oe.14.009142. [DOI] [PubMed] [Google Scholar]
- 90.Carrasco-Zevallos O, Shelton RL, Kim W, Pearson J, Applegate BE. In vivo pump-probe optical coherence tomography imaging in Xenopus laevis. Journal of Biophotonics. 2013 doi: 10.1002/jbio.201300119. [DOI] [PMC free article] [PubMed] [Google Scholar]
- 91.Yaqoob Z, McDowell E, Wu JG, Heng X, Fingler J, Yang CH. Molecular contrast optical coherence tomography: a pump-probe scheme using indocyanine green as a contrast agent. J Biomed Opt. 2006;11(5) doi: 10.1117/1.2360525. [DOI] [PubMed] [Google Scholar]
- 92.Rao KD, Choma MA, Yazdanfar S, Rollins AM, Izatt JA. Molecular contrast in optical coherence tomography by use of a pump-probe technique. Optics Letters. 2003;28(5):340–2. doi: 10.1364/ol.28.000340. [DOI] [PubMed] [Google Scholar]
- 93.Jacob D, Shelton RL, Applegate BE. Fourier domain pump-probe optical coherence tomography imaging of Melanin. Optics Express. 2010;18(12):12399–410. doi: 10.1364/OE.18.012399. [DOI] [PMC free article] [PubMed] [Google Scholar]
- 94.Wan Q, Applegate BE. Multiphoton coherence domain molecular imaging with pump-probe optical coherence microscopy. Optics Letters. 2010;35(4):532–4. doi: 10.1364/OL.35.000532. [DOI] [PMC free article] [PubMed] [Google Scholar]
- 95.Yang CH, Choma MA, Lamb LE, Simon JD, Izatt JA. Protein-based molecular contrast optical coherence tomography with phytochrome as the contrast agent. Optics Letters. 2004;29(12):1396–8. doi: 10.1364/ol.29.001396. [DOI] [PubMed] [Google Scholar]
- 96.Shelton RL, Mattison SP, Applegate BE. Molecular specificity in photoacoustic microscopy by time-resolved transient absorption. Manuscript Submitted for Publication. 2014 doi: 10.1364/OL.39.003102. [DOI] [PubMed] [Google Scholar]
- 97.Zhang HF, Maslov K, Stoica G, Wang LV. Functional photoacoustic microscopy for high-resolution and noninvasive in vivo imaging. Nature biotechnology. 2006;24:848–51. doi: 10.1038/nbt1220. [DOI] [PubMed] [Google Scholar]
- 98.Hariri LP, Liebmann ER, Marion SL, Hoyer PB, Davis JR, Brewer MA, et al. Simultaneous optical coherence tomography and laser induced fluorescence imaging in rat model of ovarian carcinogenesis. Cancer Biol Ther. 2010;10(5) doi: 10.4161/cbt.10.5.12531. [DOI] [PMC free article] [PubMed] [Google Scholar]
- 99.Hariri LP, Tumlinson AR, Besselsen DG, Utzinger U, Gerner EW, Barton JK. Endoscopic optical coherence tomography and laser-induced fluorescence spectroscopy in a murine colon cancer model. Laser Surg Med. 2006;38(4):305–13. doi: 10.1002/lsm.20305. [DOI] [PubMed] [Google Scholar]
- 100.Wall RA, Bonnema GT, Barton JK. Focused Optical Coherence Tomography and Laser-Induced Fluorescence Endoscope. Laser Surg Med. 2010:72. [Google Scholar]
- 101.Park J, Jo JA, Shrestha S, Pande P, Wan QJ, Applegate BE. A dual-modality optical coherence tomography and fluorescence lifetime imaging microscopy system for simultaneous morphological and biochemical tissue characterization. Biomed Opt Express. 2010;1(1):186–200. doi: 10.1364/BOE.1.000186. [DOI] [PMC free article] [PubMed] [Google Scholar]
- 102.Yuan SA, Li Q, Jiang J, Cable A, Chen Y. Three-dimensional coregistered optical coherence tomography and line-scanning fluorescence laminar optical tomography. Opt Lett. 2009;34(11):1615–7. doi: 10.1364/ol.34.001615. [DOI] [PubMed] [Google Scholar]
- 103.Yu C, Shuai Y, Wierwille J, Naphas R, Qian L, Blackwell TR, et al. Integrated Optical Coherence Tomography (OCT) and Fluorescence Laminar Optical Tomography (FLOT) Selected Topics in Quantum Electronics, IEEE Journal of. 2010;16(4):755–66. [Google Scholar]
- 104.Patil CA, Bosschaart N, Keller MD, van Leeuwen TG, Mahadevan-Jansen A. Combined Raman spectroscopy and optical coherence tomography device for tissue characterization. Opt Lett. 2008;33(10):1135–7. doi: 10.1364/ol.33.001135. [DOI] [PMC free article] [PubMed] [Google Scholar]
- 105.Ashok PC, Praveen BB, Bellini N, Riches A, Dholakia K, Herrington CS. Multi-modal approach using Raman spectroscopy and optical coherence tomography for the discrimination of colonic adenocarcinoma from normal colon. Biomed Opt Express. 2013;4(10):2179–86. doi: 10.1364/BOE.4.002179. [DOI] [PMC free article] [PubMed] [Google Scholar]
- 106.Mahadevan-Jansen A, Richards-Kortum RR. Raman spectroscopy for the detection of cancers and precancers. J Biomed Opt. 1996;1(1):31–70. doi: 10.1117/12.227815. [DOI] [PubMed] [Google Scholar]
- 107.Georgakoudi I, Jacobson BC, Muller MG, Sheets EE, Badizadegan K, Carr-Locke DL, et al. NAD(P)H and collagen as in vivo quantitative fluorescent biomarkers of epithelial precancerous changes. Cancer Res. 2002;62(3):682–7. [PubMed] [Google Scholar]
- 108.Yang C. Molecular Contrast Optical Coherence Tomography: A Review. Photochem Photobiol. 2005;81(2):215–37. doi: 10.1562/2004-08-06-IR-266. [DOI] [PMC free article] [PubMed] [Google Scholar]
- 109.Applegate BE, Yang C, Izatt JA. Theoretical comparison of the sensitivity of molecular contrast optical coherence tomography techniques. Optics Express. 2005;13(20):8146–63. doi: 10.1364/opex.13.008146. [DOI] [PubMed] [Google Scholar]


