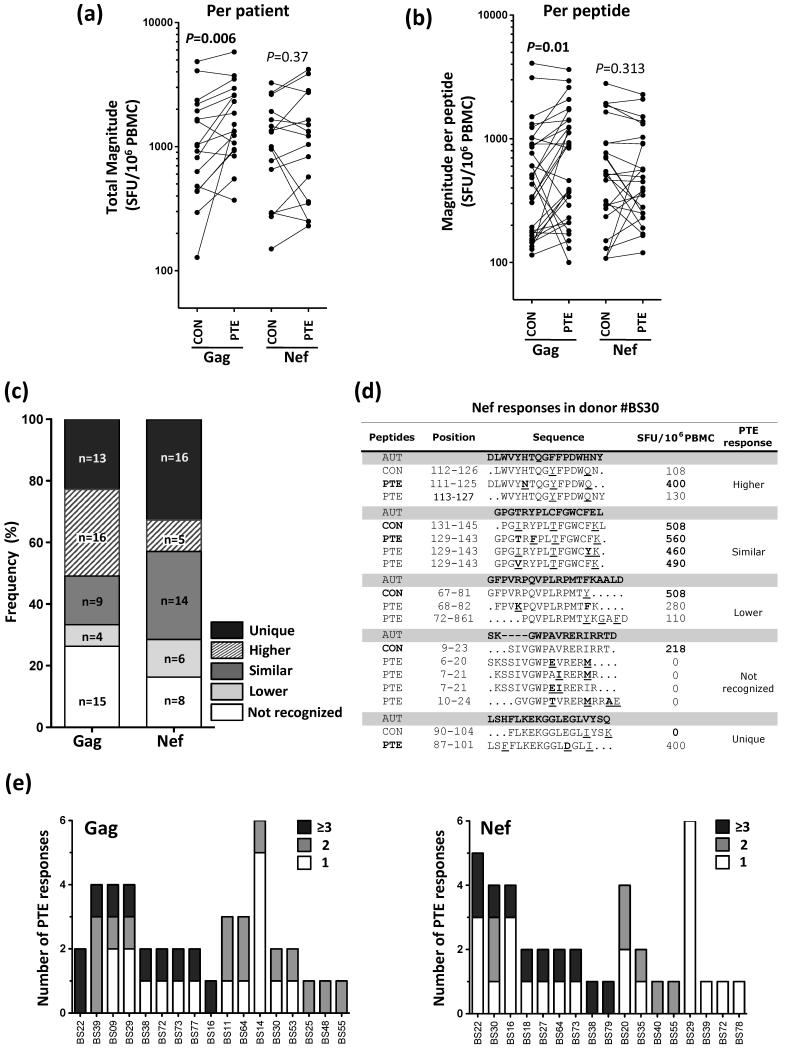
Fig. 1. Comparison of IFN-γ ELISPOT responses to Consensus (CON) and Potential T cell Epitope (PTE) peptides in HIV-infected individuals.
(a) Total magnitude of Gag- and Nef-specific T cell responses in 17 HIV-infected individuals using CON M or PTE M peptides. The total magnitude of response was determined by the sum of the responses to all epitopic regions. PTE peptides with an overlap of at least 10 amino acids were considered the same epitopic region. When multiple variants of a PTE peptide were recognized, the highest magnitude response was enumerated in the total magnitude. (b) Magnitude of individual Gag- and Nef-specific T cell responses detected using CON M or PTE M peptides. Only peptides that had a corresponding reactive peptide in both peptide sets are shown, which was 30 peptides for Gag and 25 for Nef. (c) Profile of Gag and Nef PTE responses compared to CON peptide responses. PTE responses were divided in five groups, namely ‘Unique’, where a PTE peptide elicited a detectable response while the corresponding CON peptide did not; ‘Higher’, where the PTE response magnitude was >30% higher than the corresponding CON peptide; ‘Similar’, where the magnitude of a PTE response was comparable to the magnitude of the corresponding CON; ‘Lower’, where the magnitude of a PTE response was >30% lower than the corresponding CON peptide; and ‘Not recognized’, where the PTE peptide did not elicit a detectable response while the corresponding CON peptide did. (d) Nef-specific responses in one donor (BS30), indicating the full spectrum of response profiles indicated in (c). Autologous viral sequences (generated by population sequencing) are indicated. Mismatches between the viral sequence and the peptide sequences are underlined, and differences in PTE peptides compared to CON are shown in bold. Amino acid position is based on HXB2. (e) Depth of Gag (left panel) and Nef (right panel) PTE responses in 17 HIV-infected individuals. The number of responses detected to PTE peptides with one variant only are shown in white, two variants in gray and three or more variants in black. Statistical comparisons were performed using a Wilcoxon matched pairs test and P values are indicated. CON, Consensus M peptide; PTE, Potential T cell Epitope peptide; AUT, autologous viral sequence.

