Abstract
The origin of mutations is central to understanding evolution and of key relevance to health. Variation occurs non-randomly across the genome, and mechanisms for this remain to be defined. Here, we report that the 5′-ends of Okazaki fragments have significantly elevated levels of nucleotide substitution, indicating a replicative origin for such mutations. With a novel method, emRiboSeq, we map the genome-wide contribution of polymerases, and show that despite Okazaki fragment processing, DNA synthesised by error-prone Pol-α is retained in vivo, comprising ~1.5% of the mature genome. We propose that DNA-binding proteins that rapidly re-associate post-replication act as partial barriers to Pol-δ mediated displacement of Pol-α synthesised DNA, resulting in incorporation of such Pol-α tracts and elevated mutation rates at specific sites. We observe a mutational cost to chromatin and regulatory protein binding, resulting in mutation hotspots at regulatory elements, with signatures of this process detectable in both yeast and humans.
Introduction
Mutations occur despite the exquisite fidelity of DNA replication, efficient proofreading and mismatch repair (MMR)1, resulting in heritable disease and providing the raw material for evolution. Genome variation is non-uniform2, the outcome of diverse mutational processes3, repair mechanisms4 and selection pressures5,6. This variability is exemplified by nucleotide substitution rates around nucleosome binding sites, with the highest rates at the nucleosome midpoint (dyad position)7-12.
Bidirectional replication of genomic DNA necessitates discontinuous synthesis of the lagging strand as a series of Okazaki fragments (OFs)13,14, which then undergo processing to form an intact continuous DNA strand15,16. Recently, the genomic locations at which OFs are ligated (Okazaki junctions, OJs) were mapped17. In this experimental system, OJs occurred at an average rate of 0.6% per nucleotide, however frequency was strongly influenced by the binding of nucleosomes and transcription factors (TFs). These proteins act as partial blocks to Pol-δ processivity, resulting in the accumulation of OJs at their binding sites. Here, we demonstrate the mutational consequences of such protein binding.
Results
Substitutions correlate with OJs
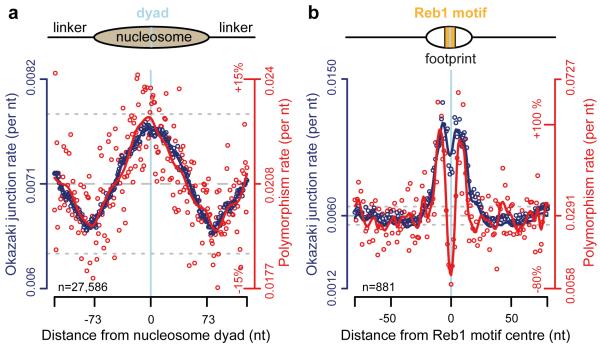
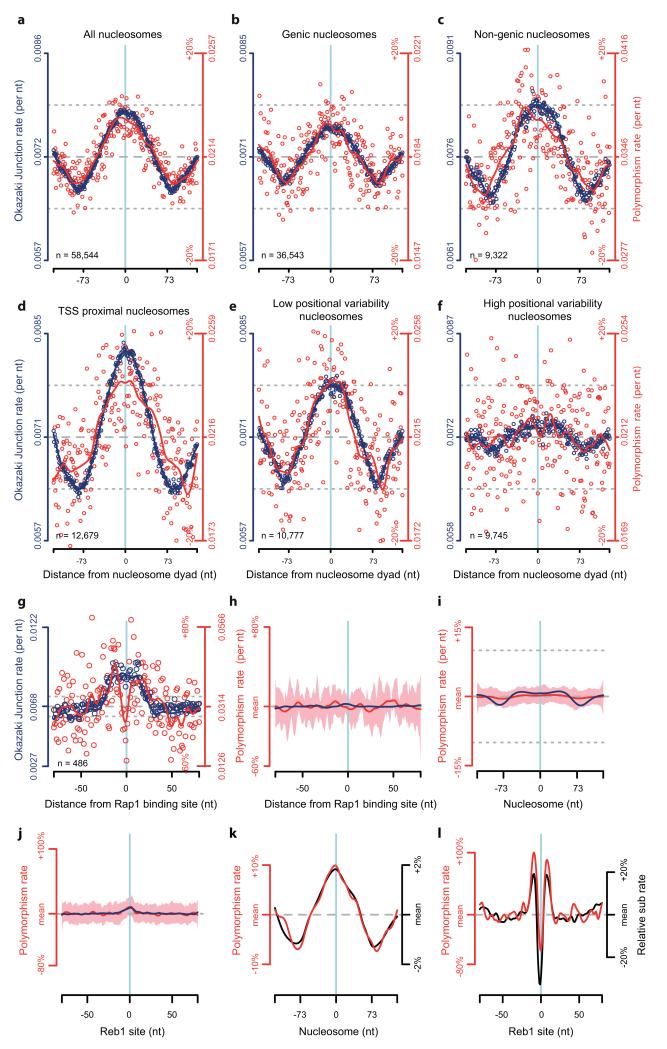
We were struck by the similarity of the distribution of S. cerevisiae OJ sites at nucleosomes17 to that previously reported for nucleotide substitutions7,8,10-12, and set out to investigate the potential reasons for this. We established that nucleotide substitution and OJ distributions are highly correlated (Pearson’s correlation coefficient = 0.76, p = 2.2·10−16) and essentially identical in pattern (Fig. 1a). Furthermore, differences in OJ distribution by nucleosome type (genic vs non-genic), spacing or consistency of binding were mirrored by the substitution rate distribution (Extended data Fig. 1a-f). We found similar strong correlation in the regions directly surrounding TF binding sites of Reb1 (Fig. 1b; Pearson’s cor = 0.57, p = 5.6·10−15), and Rap1 (Extended data Fig. 1g), providing further evidence for a direct association. At the sequence-specific binding sites themselves, substitution rates were depressed relative to the OJ, resulting from strong selection pressure to maintain TF binding, and obscuring any mutational signal at these nucleotides.
Figure 1. Elevated substitution rates at OJs.
a, b, Nucleotide substitution rates (red) closely correlate with elevated OJ site frequency (blue) at (a) nucleosome and (b) Reb1 binding sites. S. cerevisiae polymorphism rates per nucleotide computed using sequences from nucleosome and Reb1 binding sites. Individual data points, open circles. Solid curves, best fit splines. Mean, dashed grey line; ±10% dotted grey lines.
Given that both classes of sites (nucleosomes and TFs) are present genome-wide and represent different biological processes, this association was likely the direct consequence of protein binding at these sites. However, to rule out site-specific biases in sequence as a confounding explanation for the observed distributions, we randomly sampled the rest of the genome for tri-nucleotides of identical sequence compositions and calculated the substitution rate at these sites, on a nucleotide by nucleotide position basis (Extended data Fig. 1h-j). This resulted in loss of the observed patterns, establishing that nucleotide composition bias was not a contributing factor. Furthermore, the observed association was not restricted to polymorphism rates, as yeast inter-species nucleotide substitution frequencies at both nucleosome and Reb1 TF binding sites were identical (Extended data Fig. 1k, l).
We therefore concluded that OJ frequency and nucleotide substitution rates could be causally related, and set out to investigate the potential mechanism for this association.
Mutations at 5′ ends of OFs
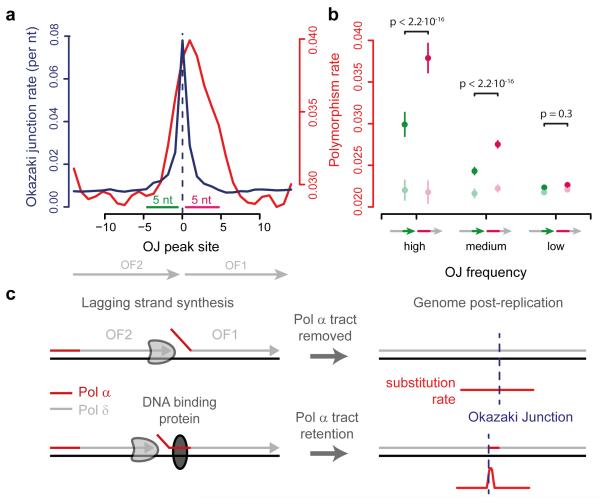
The synthesis and processing of OFs is directional. Therefore substitution rates would be expected to be asymmetrical relative to the direction of synthesis, if a component of this process was the cause. As most of the genome is preferentially replicated with either the forward or reverse strand as the lagging strand, we orientated regions by their dominant direction of lagging strand synthesis. This revealed substantially elevated nucleotide substitution rates immediately downstream of OJs (Fig. 2a), the level of mutational signal correlating with OJ site frequency. Quantification of substitution rates for the five nucleotides immediately upstream and downstream of the OJ (Fig. 2b), demonstrated that high frequency OJ sites (11-fold elevated OJ rate relative to baseline; top 99.9 centile of sites) displayed the highest substitution rate (p < 2.2·10−16), with significant elevation (p < 2.2·10−16) for medium frequency sites, (6.1-fold, 99-99.9 centile) but not low frequency sites (p = 0.3, 1.7-fold, OJ sites <99 centile). This was not due to site-specific sequence biases, as the increase in substitution rate was lost after a 3-mer preserving genome shuffle. Therefore point mutations are enriched at the 5′ ends of mature OFs of frequently occurring OJ sites, sites that correspond to protein barriers to Pol-δ processivity17.
Figure 2. Frequent nucleotide substitutions at OF 5′-ends.
a, Mutation rates are elevated downstream of OJs. Substitution polymorphisms (red) and OJ rate (blue) in regions surrounding high frequency OJs (top 0.1%). n=5,660 sequences orientated for dominant direction of OF synthesis. b, Mutation rates correlate with OJ peak size. Mutations are significantly enriched downstream of the junction (pink), compared to genome shuffle controls (light green/pink). Sites grouped by OJ frequency. Error bars, SD; paired two-sided t-test. c, Hypothesis: DNA synthesised by non-proofreading Pol-α is preferentially trapped in regions rapidly bound by proteins post-replication. These act as partial barriers to Pol-δ displacement of Pol-α synthesised DNA, resulting in locally elevated mutations.
Hypothesis: retention of Pol-α DNA
We next considered which aspect of lagging strand synthesis might be responsible. OFs are generated by the consecutive actions of Pol-α and δ (Fig. 2c). When the previously synthesised, downstream OF is encountered, OF processing occurs18, involving the coordinated action of FEN1 and DNA2 nucleases15,16 in conjunction with continuing DNA synthesis by Pol-δ, prior to final ligation of adjoining DNA fragments. During this process most if not all of the 10-30 nucleotide long DNA primer Pol-α synthesises19,20 has been thought to be removed alongside the RNA primer, and replaced by Pol-δ synthesised DNA16,21,22. This would be desirable, as unlike other replicative DNA polymerases Pol-α lacks 3′ to 5′ proofreading exonuclease activity, limiting its intrinsic fidelity23. On the other hand studies on the mutagenesis pattern of reduced fidelity polymerase mutants in yeast demonstrate that Pol-α synthesised DNA does contribute to the genome21,24-26. How comprehensive the removal or retention of such DNA is in vivo is unknown, but significantly the retention of error-prone Pol-α synthesised DNA at the 5′ end of OFs would provide a straightforward explanation for the elevated mutation rates we observed. Given that protein barriers have been shown to influence OF processing17, we therefore hypothesise that Pol-α synthesised DNA is preferentially retained at sites where proteins bind shortly after initial OF DNA synthesis (Fig 2c). Our model would predict (1) that Pol-α tracts are retained at a significant level within the mature genome post-replication, and (2) that mutational signatures arising from such Pol-α synthesised DNA will be elevated at many DNA-binding protein sites in eukaryotes.
EmRiboSeq
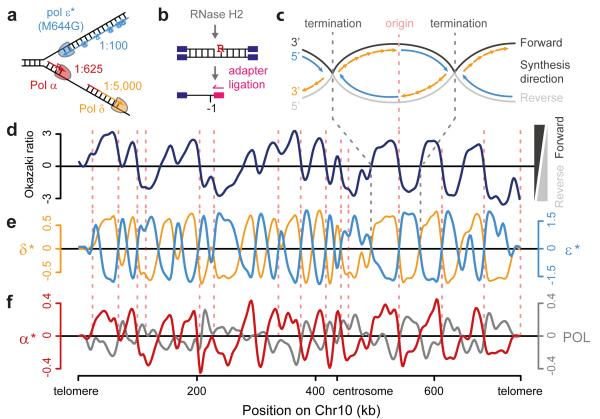
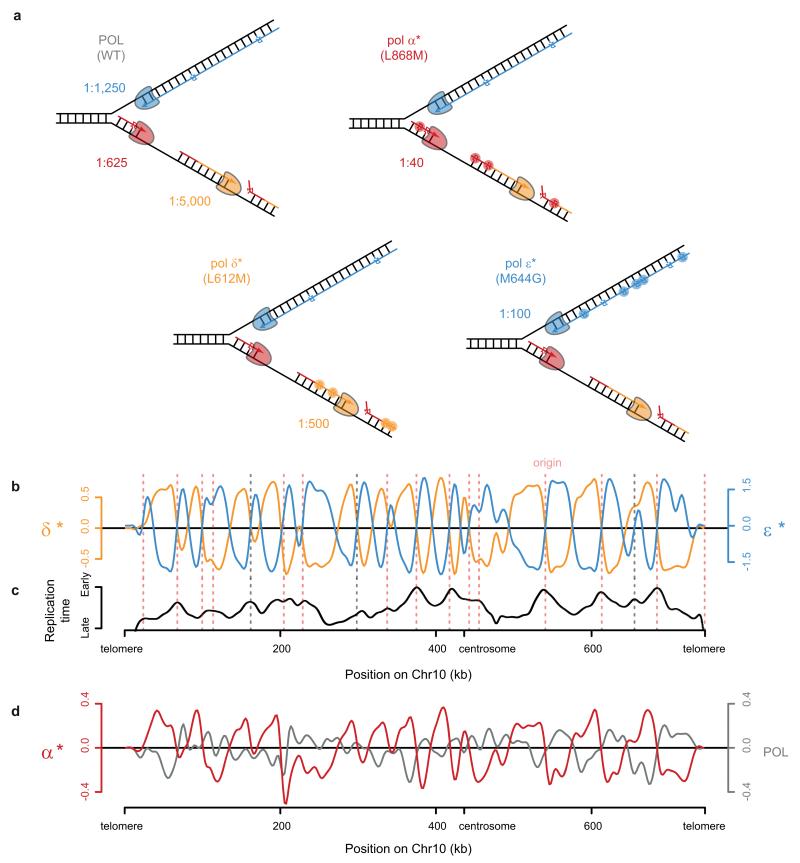
To address where error-prone Pol-α DNA is retained in vivo, we utilised the incorporation of ribonucleotides into genomic DNA to track the activity of specific DNA polymerases. Ribonucleotides are covalently incorporated into genomic DNA by replicative polymerases27,28, although they are normally efficiently removed by Ribonucleotide Excision Repair (RER), a process initiated by the RNase H2 enzyme29. In RNase H2 deficient budding yeast such ribonucleotides are generally well tolerated: Δrnh201 yeast has proliferation rates identical to wild type under normal growth conditions27, and therefore in this genetic background ribonucleotides can be used as a ‘label’ to track polymerase activity. Furthermore, the contribution of specific polymerases can be studied using polymerases with catalytic site point mutations (Pol-α L868M, Pol-δ L612M and Pol-ε M644G) that incorporate ribonucleotides at higher rates than their wildtype counterparts (21,26,27,30 and JS Williams, AR Clausen & TA Kunkel, personal communication; Fig. 3a). Yeast strains expressing these mutant polymerases have previously been used to demonstrate that Pol-ε and Pol-δ are the major leading and lagging strand polymerases respectively, by measuring strand-specific alkaline sensitivity of particular genomic loci30-32.
Figure 3. Mapping DNA synthesis in vivo using emRiboSeq.
a, Replicative polymerases can be tracked using point mutants with elevated ribonucleotide incorporation. Schematic of replication fork with Pol-ε (*, M644G mutant) and ribonucleotide incorporation rates for each polymerase. Embedded ribonucleotides (R) highlighted. b, Schematic of emRiboSeq methodology. c, Schematic of replication. d, e, Mapping of leading/lagging strand synthesis and replication origins using emRiboSeq. Ratio of OFs reads17 between forward and reverse strands of chromosome 10 (d) corresponds to the ratio of their respective ribonucleotide content (e) for Pol-δ* (orange), whereas Pol-ε* shows negative correlation (cyan). Intersections with x-axis correspond to replication origins and termination regions (c-e). Experimentally validated origins (dotted pink lines). f, Pol-α* DNA is detected genome-wide by emRiboSeq as a component of the lagging strand. Strand ratios are shown as best fit splines, y-axes log2 of ratios (d-f)
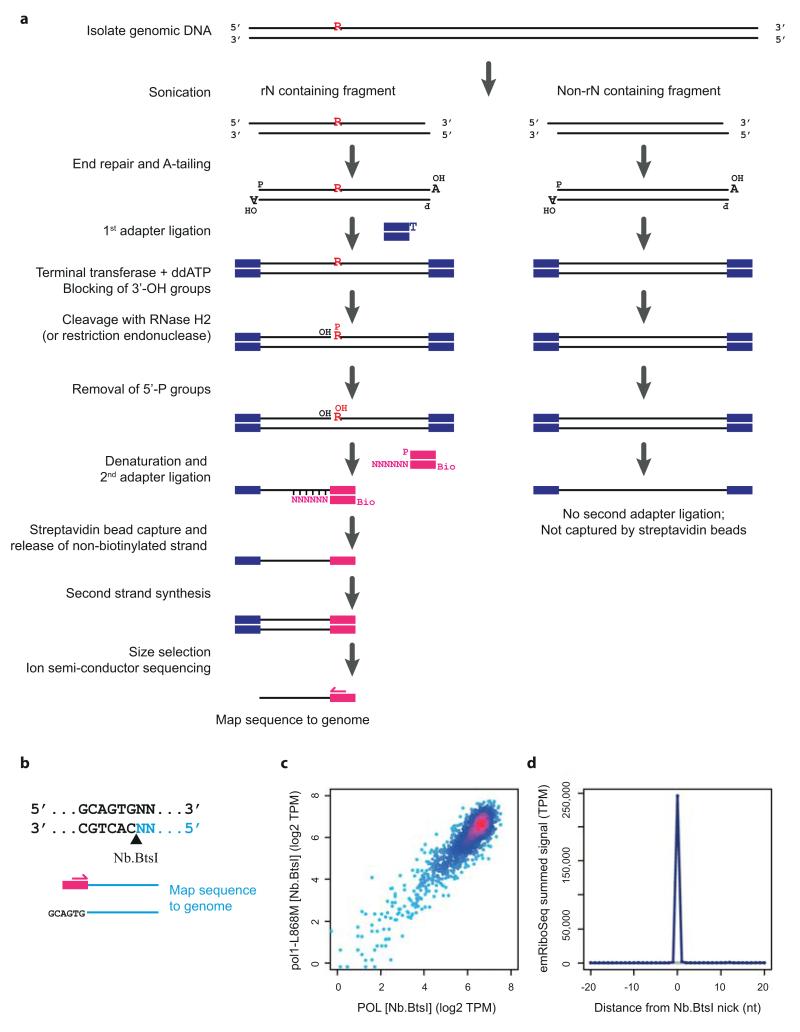
To directly track the genome-wide contribution of polymerases we developed a next generation sequencing approach, which we term emRiboSeq (for embedded Ribonucleotide Sequencing), that determines the strand-specific, genome-wide distribution of embedded ribonucleotides. This is achieved by treatment of genomic DNA with recombinant type 2 ribonuclease H, to generate nicks 5′ of embedded ribonucleotides, followed by ligation of a sequencing adapter to the 3′-hydroxyl group of the deoxynucleotide immediately upstream of the ribonucleotide (Fig. 3b; Extended data Fig. 2a). Subsequent ion-semiconductor sequencing permits strand-specific mapping of ribonucleotide incorporation sites.
Control experiments using endonucleases of known sequence specificity demonstrated 99.9% strand specificity and 99.9% site specificity for the technique (Extended data Fig. 2b-d). Using RNase H2 deficient Pol-ε M644G and Pol-δ L612M yeast strains we then mapped the relative contributions of these respective polymerases genome-wide (Fig. 3c-e; Extended data Fig. 3). We found that ribonucleotide incorporation in the Pol-δ L612M strain was substantially enriched on the DNA strand that is preferentially synthesised by lagging strand synthesis17, in keeping with its function as the major lagging strand polymerase30,33,34, while ribonucleotide incorporation in the Pol-ε M644G strain exhibited an entirely reciprocal pattern consistent with its function as the leading strand polymerase31,35 (Fig. 3e). Furthermore, points at which neither enzyme showed strand preference (intersection of both Pol-ε and Pol-δ plots with the x-axis) corresponded precisely with annotated origins of replication. Other intersection points were also evident that correspond to replication termination regions, as well as putative, non-annotated origins. The latter overlapped with early replicating regions36 (Extended data Fig. 3b-c). Therefore we concluded that emRiboSeq can be used to determine the distribution of polymerase activity genome-wide, and has utility for the identification of replication origin and termination sites.
Pol-α synthesised DNA ~1.5% of genome
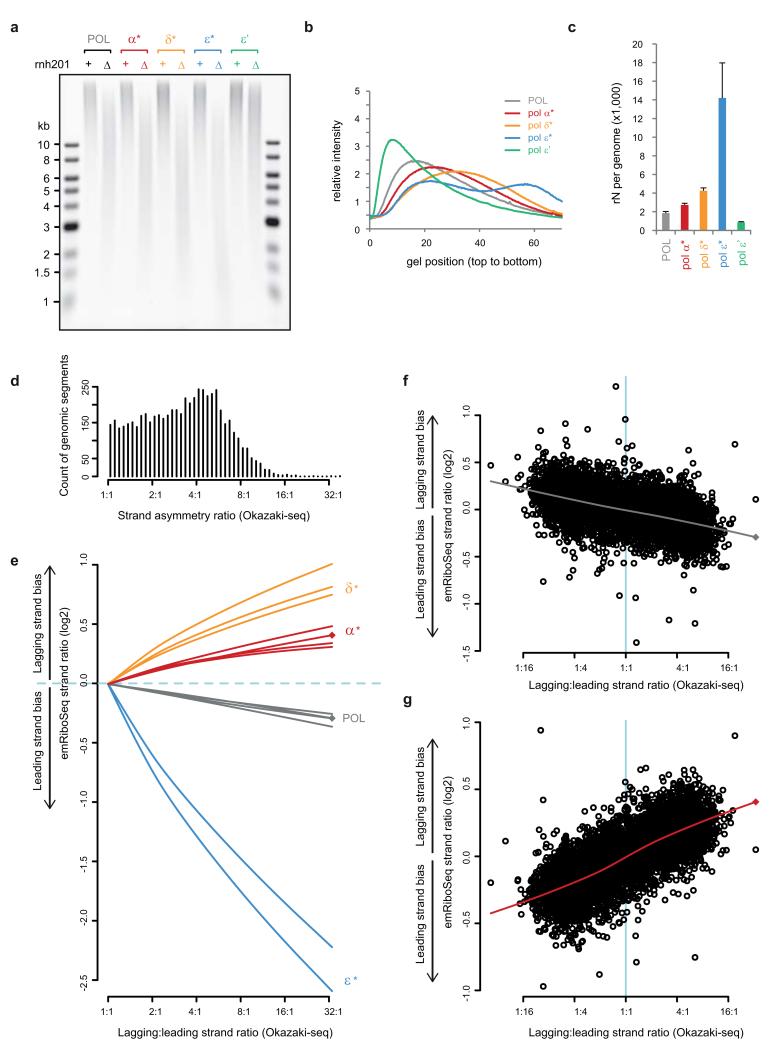
Having demonstrated the validity of our technique through detailed mapping of the major replicative polymerases, we next examined the contribution of Pol-α synthesised DNA to the budding yeast genome. Significantly, the Pol-α L868M Δrnh201 strain had a strand ratio distribution identical to that seen for Pol-δ L612M Δrnh201, consistent with the expected role for Pol-α in lagging strand replication (Fig. 3f). Furthermore, the Pol-α L868M pattern of strand incorporation was reciprocal to that of a wildtype polymerase strain (POL), which displayed leading strand bias, in keeping with a strong propensity for ribonucleotide incorporation by leading strand polymerase Pol-ε compared to Pol-δ37. Increased ribonucleotide retention on the lagging strand was also present in DNA from stationary phase Pol-α L868M Δrnh201 yeast (Extended data Fig. 3d), demonstrating that Pol-α-derived DNA is retained in the mature genome post-replication and that this signal was not due to the transient presence of Pol-α DNA during S-phase.
To provide biochemical validation, we performed alkaline gel electrophoresis on genomic DNA extracted from Pol-α L868M, Pol-δ L612M and Pol-ε M644G Δrnh201 yeast. Increased fragmentation was detected in all three strains (Extended data Fig. 4a-c) and elevated ribonucleotide incorporation was also detected in genomic DNA from stationary phase Pol-α L868M yeast (Fig. 4a-c), consistent with Pol-α tract retention in mature genomic DNA. To quantify the contribution of Pol-α DNA to the genome, we used densitometry measurements from the alkaline gels to calculate ribonucleotide incorporation rates28. We detected 1,500 embedded ribonucleotides per genome in Δrnh201 genomic DNA, which increased to 2,400 sites per genome for Pol-α L868M (Fig. 4c). Observed ribonucleotide incorporation rates correspond to the product of the incorporation frequency of each polymerase and the amount of DNA it contributes to the genome. Using the in vitro ribonucleotide incorporation rates of wildtype and mutant polymerases and the number of embedded ribonucleotides embedded in vivo (Extended data Fig. 3a and 4a-c) we estimated the relative contributions of each of the replicative polymerases to the genome (Fig. 4d), calculating the contribution of Pol-α to be 1.5 ± 0.3%.
Figure 4. Pol-α DNA synthesis contributes ~1.5% of the mature genome.
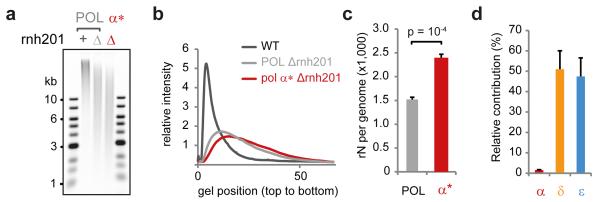
a, b Increased ribonucleotide incorporation in Pol-α* stationary phase yeast is detected by alkaline gel electrophoresis. c, Quantification confirms significantly elevated rates (n=6; error bars, SE; paired two-sided t-test) in the Pol-α* genome. d, Estimate of relative contribution of polymerases to the genome (n=4; error bars, SE).
RNase H enzymes may contribute to removal of OF RNA primers16,38 and consequently Δrnh201 strains could have altered levels of Pol-α synthesised DNA to that seen in wild type strains. This confounding factor was excluded using an RNH201 separation of function (SOF) mutant39, which established that retention of Pol-α DNA was independent of a role for RNase H2 in RNA primer removal (Extended data Fig. 5).
In conclusion, Pol-α synthesised DNA makes a small but significant contribution to the genome, relative to the major replicative polymerases, confirming the first prediction of our model.
Mutational cost of TF binding in humans
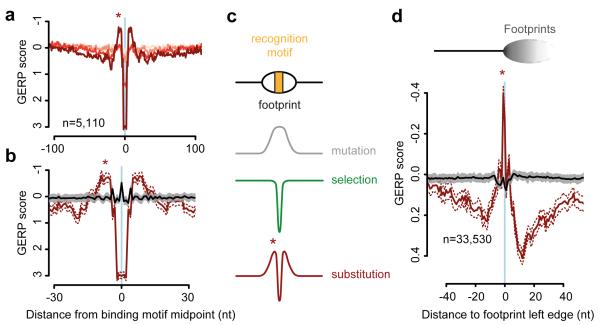
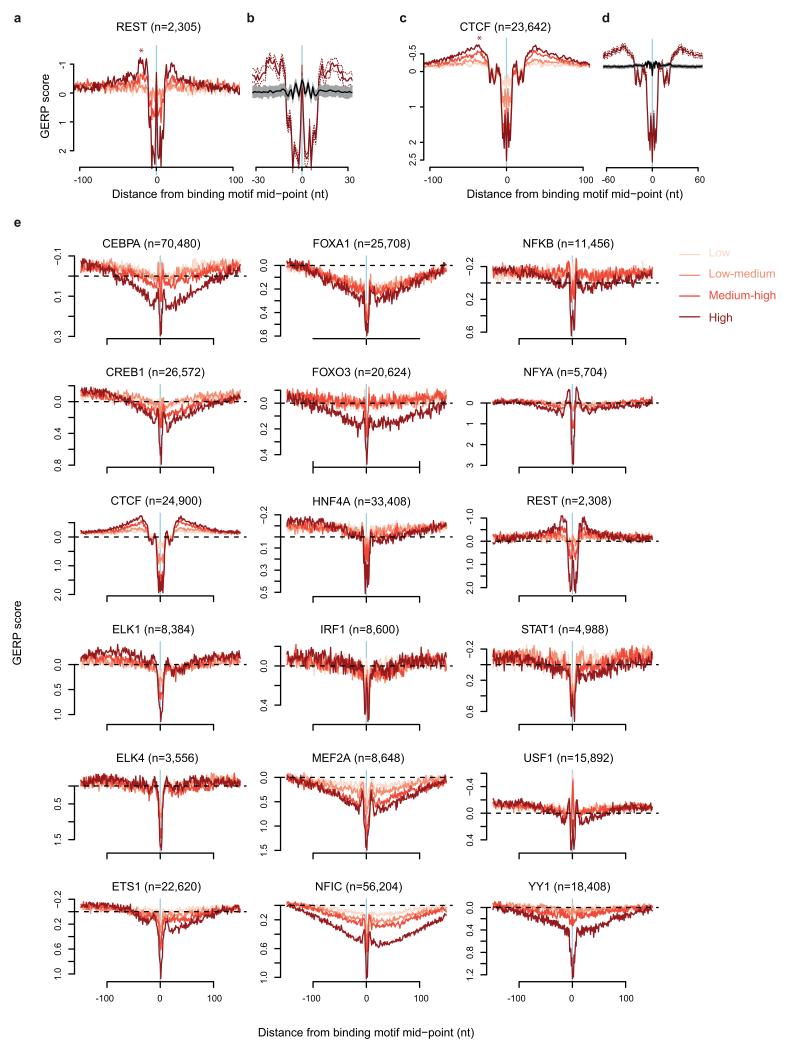
As OF processing is a conserved process in eukaryotes, we next considered whether an OF-related mutational signature was also present in humans. Substitution rates are also elevated at nucleosome cores in humans7 with an identical distribution to yeast. Furthermore, the TF NFYA has an unexplained “shoulder” of elevated substitution proximal to its binding sites40, reminiscent of the Reb1 pattern (Fig. 1b). We therefore investigated if similar mutational patterns are present at other experimentally defined human TF and chromatin protein binding sites. Elevated inter-species nucleotide substitution rates were detected flanking essential binding site residues, for many, but not all TFs, as well as CTCF binding sites (Fig. 5a,b and Extended data Fig. 6). Substitution rates were measured using GERP scores, which quantify nucleotide substitution rates relative to a genome wide expectation of neutral evolution41, such that a negative GERP score indicates increased nucleotide substitution rates. Furthermore, elevation in mutation rate correlated with the degree of enrichment reported in exoChIP datasets for these proteins, likely reflecting the strength of binding or frequency of occupancy at specific sites, which would be expected to influence pol-δ processivity and consequent mutation levels.
Figure 5. OF mutational signatures are conserved in humans.
a, Nucleotide substitutions (plotted as GERP scores) are elevated immediately adjacent to TF NFYA binding sites. Pink to brown: lower to higher quartiles of ChIP-seq peak height (reflecting strength of binding/occupancy). Stronger binding correlates with substitution rate in the ‘shoulder’ region (*). b, Elevated substitution rates are not a consequence of local sequence composition effects. Strongest binding sites (brown) compared to 3-mer preserving shuffle (black). c, Model: Nucleotide substitution profiles are the sum of mutation rate and selective pressure. d, Interspecies substitution rates are also elevated adjacent to DNase I footprint edges (*). Sequences aligned to left footprint edges as indicated in schematic. Right footprint edge is indistinct due to heterogeneity in footprint length. Substitution rates are no longer increased after 3-mer preserving shuffle from local flanking sequences (black). 95% confidence intervals, brown dashes and grey shading (b, d).
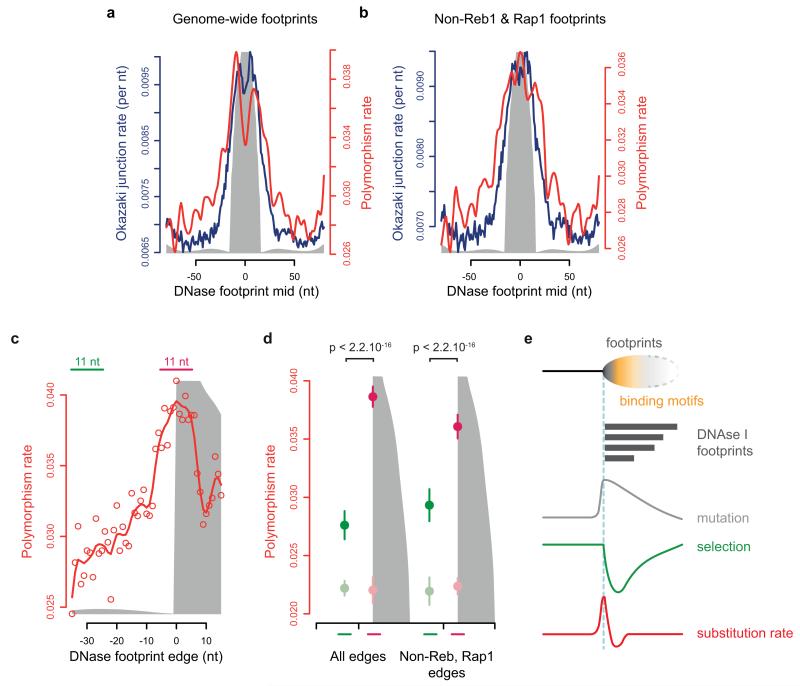
Finally, to extend our analysis beyond common TF binding sites, we investigated whether the same mutational signature could be found for a broad range of regions at which regulatory proteins bind, regions we identified by the presence of DNase I footprints. Our preceding analysis of TFs suggested that nucleotide substitutions would be elevated immediately adjacent to the protein binding region defined by such footprints. In yeast we found that DNase I footprint edges served as a good proxy for elevated OJ rate with significantly elevated substitution rates (Extended data Fig. 7). Similarly, in humans, aligning regions containing DNase I footprints on the basis of boundary junctions (left-hand edge of footprint), detected substantially elevated nucleotide substitution rates close to the junction, relative to the baseline rate in the immediate region (Fig. 5d). These increased substitution rates were related to position rather than sequence content, as this signal was lost when a 3-mer preserving genome shuffle was applied, both for individual TFs (Fig. 5b; Extended data Fig. 6a-d) and DNase I footprints (Fig. 5d). Therefore this mutational signature is not due to the retention of mutagenic sequences (e.g. CpG dinucleotides) at such sites42, and is a widespread phenomenon in the genome at protein binding sites in both yeast and humans.
Discussion
Here we establish a mutational signature at protein binding sites that we suggest could result from the activity of the replicative polymerase Pol-α. We use a novel technique, emRiboSeq, to demonstrate that error-prone DNA synthesised by Pol-α is retained in the mature lagging strand. EmRiboSeq tracks genome-wide in vivo polymerase activity using ribonucleotides as a ‘non-invasive’ label, and will have significant future utility for the in vivo study of DNA polymerases in replication and repair. Further optimisation of emRiboSeq should permit high resolution examination of the role of polymerases at specific sites, such as Pol α tract retention at protein binding sites. It will also be a useful method for defining replication origin and termination sites, and furthermore will facilitate the investigation of physiological roles of genome-embedded ribonucleotides30,43,44.
A direct relationship between OF junctions and mutation frequency is indicated by the significant correlations between substitution rate and OF junction sites at diverse protein binding sites, although future experimental validation will be needed to formally establish causality. We find that substitution rates are specifically elevated downstream of such junction sites, suggesting a replicative origin for such mutations. As Pol-α DNA tracts occur genome-wide, and Pol-δ processing of OFs is impaired by DNA-bound proteins17, we propose that retention of Pol-α DNA is increased at these functionally important sites, and is responsible for the increased mutation rate (Fig. 2c). Replication fidelity processes, including efficient MMR at the 5′ end of OFs25,45, will mitigate Pol-α replication errors. Additionally, Pol-α DNA will be incorporated at relatively low frequency (Extended data Fig. 8), with the majority of DNA at such sites still synthesised by Pol-δ and Pol-ε. However, over evolutionary timescales, it appears that these processes are insufficient to fully compensate for the lack of Pol-α proofreading activity. An alternative possibility is that protein binding may impair access of replication-related repair factors, such as Exo1 to correct errors in Pol-α synthesised DNA45. However, it does not appear that the MMR machinery is generally obstructed at such sites, as MMR efficiency at nucleosomes is reported to be uniform with respect to dyad position24.
Nucleosome formation has a key role in ensuring genome stability46, and consequently there is an imperative for the rapid repackaging of the genome post-replication. However, we now show that this comes at the cost of increased mutation at specific sites, detectable on an evolutionary time scale. OF-associated mutagenesis could also have significance for human genetics, as it elevates mutation rates at TF and regulatory protein binding sites. Such increased mutagenesis has been substantially obscured by strong purifying selection at these sites necessary to maintain functionality. Significantly, increased mutation suggests they will be evolutionary hotspots, and may help explain the rapid evolutionary turnover of TF sites47 and the difficulty in non-coding functional site prediction by interspecies sequence conservation comparisons. Furthermore, as hyper-mutable loci, TF binding sites may be frequently mutated in inherited disease and neoplasia.
In summary, we demonstrate that DNA synthesised by Pol-α contributes to the eukaryotic genome, likely elevating mutations at specific regulatory sites of relevance to both human genetics and the shaping of the genome during evolution.
METHODS
Yeast reference genome and annotation
All analyses were performed on the sacCer3 (V64) S. cerevisiae reference genome assembly. Datasets originally obtained with coordinates on other assemblies were projected into the sacCer3 assembly using liftOver (v261)48 with the corresponding chain files obtained from http://www.yeastgenome.org. All regions of the sacCer3 genome were used for read alignment but analyses including strand ratios and all rate estimates excluded the following multi-copy regions: the mitochondrial genome, rDNA locus chrXII:459153-461153 and any 100 nucleotide segment with mappability score of <0.9 (gem-mappability49 with k-mer = 100). In total this masked 951,532 nucleotides (7.8%) of the reference genome. Gene structure annotations were the SGD consensus annotations extracted from the UCSC genome browser in November 2013. Annotated origins of replication were obtained from Eaton et al50. DNase I hypersensitive sites and footprints were obtained from Hesselberth et al51 and nucleosome position, occupancy and positional fuzzyness (positional heterogeneity) measures were from Jiang & Pugh52. Yeast replication timing data was obtained from Raghuraman et al36 where we have plotted the percentage of Heavy-Light (replicated) DNA (pooled samples dataset). Higher percentage indicates earlier average replication time.
Yeast polymorphisms and between species substitution rates
Yeast polymorphism data was obtained from the Saccharomyces Genome Resequencing project53. A polymorphic difference between any of the 37 sequenced S. cerevisiae strains was called as a polymorphic site. Sites with n>2 alleles were only counted once as a polymorphic site. Only nucleotide point substitutions were considered, insertions and deletions were excluded. The polymorphism rate reported is the number of polymorphic sites divided by the number of sacCer3 sites with sequence coverage in at least two additionally sequenced strains.
Yeast between-species substitution rates were calculated from MultiZ stacked pairwise alignments obtained from the UCSC genome browser (Supplementary Information, Table 1). Alignments for five sensu stricto yeast species (S. cerevisiae, S. paradoxus, S. mikatae, S. kudriavzevii, S. bayanus) were extracted from the original seven species alignment. The reference assembly names and phylogenetic relationship are represented by the tree (((sacCer3, sacPar), sacMik), sacKud, sacBay). Substitution rates were calculated over whole chromosomes using baseml from the paml54 package (version 4.6) under the HKY85 substitution model with ncatG=5 categorical gamma. Per-nucleotide relative rate estimates (branch length multipliers) were obtained over the sacCer3 genome.
Human conservation measures
Genomic Evolutionary Rate Profiling (GERP) scores41 were used as a measure of between species nucleotide diversity across 46 vertebrate species. Single nucleotide resolution bigWig files were obtained from UCSC genome browser (hg19). For consistency of presentation with plots of polymorphism rate and yeast between-species nucleotide substitution rate, the y-axes in plots showing GERP scores have been inverted so that greater constraint is low and greater diversity is high.
OF sequence processing
OF sequence data was obtained from Smith and Whitehouse17 (GEO:GSM835651). Analysis primarily focussed on the larger “replicate” library but results were confirmed in the “sample” library (GEO:GSM835650). The OF strand ratio was calculated as the sum of per nucleotide read coverage on the forward strand divided by the same measure for reverse strand reads. OF strand ratios were calculated in windows of 2,001 nucleotides. A pseudo count of 1 read covered nucleotide was added to both strands in each window to avoid divisions by zero. Results shown are for de-duplicated read data (identical start and end coordinates were considered duplicates). De-duplication minimises potential biases in PCR amplification, qualitatively similar results were obtained with non-de-duplicated data and support identical conclusions.
Rather than using separate Okazaki 5′ and 3′ end counts that did not always correlate well, likely due to amplification biases, sequencing and size selection biases; we produced a normalised OJ rate measure. This is the average of (1) the fraction of upstream OFs that terminate with a 3′ end at a focal nucleotide, and (2) the fraction of downstream OFs whose 5′ end is at the focal nucleotide. The upstream and downstream coverage measures were based on mean Okazaki read coverage for the nucleotides located between 5 and 12 nucleotides upstream (downstream) of the focal 3′ (5′) end. This OJ rate was calculated at single nucleotide resolution over both strands of the sacCer3 genome.
EmRiboSeq alignment and processing
Sequence reads (see Supplementary Information, Table 2 for runs and read numbers) were aligned to the unmasked sacCer3 genome with bowtie2 (version 2.0.0). Subsequent filtering and format conversion were performed using Samtools (version 0.1.18) and BEDTools (version 2.16.2). Only reads with a mapping quality score >30 were kept for analysis. As there had been no pre-sequencing amplification, de-duplication was not performed. Read 5′-end counts were summed per strand at single nucleotide resolution over the yeast reference genome. Note that under the emRiboSeq protocol, the ribonucleotide incorporation site would be one nucleotide upstream and on the opposite strand to the mapped read 5′ end. To facilitate comparison between libraries of differing read depth, read counts were normalised to sequence tags per million (TPM) mapped into the non-masked portion of the genome.
Defining TF binding sites
Reb1 and Rap1 ChIP-exo data was obtained from Rhee and Pugh55 (Sequence Read Archive: SRA044886). Sequence bar-codes were clipped and sequences sorted using Perl (version 5.18.2). Reads were aligned using bowtie2 (version 2.0.0). Following the previously published protocol55 up to three mismatches across the length of each tag sequence were allowed, and the 3′ most 6 bp removed. Peaks were called with MACS (version 2.0.10). Following Rhee and Pugh55 sites were defined as monomer if no other peaks were present within 100 bp. Where two or more peaks were present within 100 bp the peak with the highest occupancy was labelled as the primary peak. Telomeric sites were excluded using annotations within the sacCer3 sgdOther UCSC table (http://www.yeastgenome.org). The presence or absence of a motif was determined using the Motif Occurrence Detection Suite (MOODS)56 (version 1.0.1). Consensus binding motifs positional weight matrices were obtained from JASPAR57 (http://jaspar.genereg.net/). The matching motif significance threshold was set at 0.005. Multiple peaks were aligned (x=0) to the midpoint of the JASPAR defined motif. Human TF binding sites were defined using ChIP-seq data (Supplementary Information, Table 1) as for yeast except that the peak clustering threshold was reduced to 50 nt.
Computational and statistical analyses
Analysis and all statistical calculations were performed in R (version 3.0.0). Lines of fit used the smooth.spline function with degrees of freedom: Fig. 1a, 18 degrees; Fig 1b, 34 degrees; Fig. 3d-f, 80 degrees of freedom (strand ratio calculated in 2,001 nt consecutive windows). Sliding window averages used the rollapply function from the Zoo package with centre alignment and null padding. Sliding window averages used the rollapply function from the Zoo package with centre alignment and null padding. Pearson’s correlation was performed with the cor.test function in R, paired Student’s t-test with the t.test function, Mann-Whitney tests with the wilcox.test function and lowess (locally weighted scatterplot smoothing) with the lowess function and default parameters.
Rate estimates with compositional correction
Polymorphism and OJ rates were calculated separately for each nucleotide (A, T, C or G) and the average of these for rates used as the reported or plotted measure for a nucleotide site or group of sites. This corrects for mononucleotide compositional biases that are abundant when sampling specific features of a genome. The between species relative substitution rate calculation incorporates a compositional correction. The rate estimates shown are the number of observations divided by the number of sites with non-missing data.
Trinucleotide preserving shuffles
Every nucleotide of the sacCer3 genome was assigned to one of 64 categories based on the identity of that nucleotide and its flanking nucleotides. A vector of transformations was produced by swapping the genomic coordinate of a nucleotide for one with an identical category chosen at random. Swaps between masked and unmasked sites (see above) were prevented. 100 such vectors were produced. For a set of stacked coordinates (e.g. Fig. 1a comprising 27,586 sequences, each of 251 nucleotides), every nucleotide of every sequence was substituted through the transformation vector, for a randomly selected proxy, matched for the same trinucleotide context and their corresponding rate or annotation used. This provides a compositionally well-matched null expectation. With 100 independent transformation vectors we provide empirically derived 95% confidence bounds and standard deviations on those null expectations. For human sites, shuffles were confined to sequences flanking the region of interest (100 to 300 nt distant from the binding site for TF analysis and 1,000 to 2,000 nt distant for DNase I footprint analysis). Human genomic coordinates in the ENCODE “Duke Excluded Regions”58 and those positions with a uniqueness score of <0.9 (gem-mappability49 with k-mer = 100) were excluded from shuffles.
Sites selected for analysis
Thresholds were applied to define specific subsets of sites to be evaluated. For the presented data (Fig. 1a) nucleosomes with an occupancy of >80%, positional fuzzyness52 of <30, with at least 30 OF reads over them, and located more than 200 nt from transcription start sites were used. Other combinations (Extended data Fig. 1) of these parameters gave qualitatively similar results and support the same conclusions. Reb1 (and Rap1) sites were defined as the primary ChIP-exo peak at a site, with sequences aligned (x=0) to the centre of the highest scoring Reb1/Rap1 position weight matrix match within 50 nt of the ChIP-exo peak summit. DNase I footprints from 41 human cell types were previously combined59 into consensus footprints (combined.fps.gz). We intersected the combined footprints with those found in each cell type using BEDtools (version 2.17.0) to identify the subset (n=33,530) that were detected in all 41 cell types. The left-edge coordinate as defined in the combined footprint file was used as the focal nucleotide (x=0) for analysis.
Comparison of polymorphism rates
The five nucleotide positions downstream and the five upstream of the focal OJ position (excluding x=0 in both cases) were scored for their polymorphism rate (Fig. 2b). Rate deltas were calculated as upstream minus downstream in 100 bootstrap replicates and a paired two-sided t-test performed against the same calculation performed on 100 trinucleotide preserving genome shuffles of the same sites. This tests if the difference in rate between upstream and downstream positions is greater in the observed data than the shuffled data.
DNA purification
Yeast strains were grown at 30°C in YPDA to mid log phase (see Supplementary Information, Table 3 for a list of strains) or to saturation for stationary phase. Per 5 OD600 units, cell pellets were resuspended in 200 μl lysis buffer (2% Triton X-100, 1% SDS, 0.5 M NaCl, 10 mM Tris-HCl pH8.0, 1 mM EDTA). An equal volume of TE-equilibrated phenol and glass beads (0.40-0.60 mm Φ, Sartorius) were added, and cells lysed by vortexing for 2 min; 200 μl of TE was then added, followed by an additional 1 min of vortexing. After centrifugation, the aqueous phase was further extracted with equal volumes of phenol:chloroform:isoamylalcohol (25:24:1) and chloroform. Total nucleic acids were precipitated with 1 ml of 100% ethanol, and dissolved in 0.5 M NaCl. RNA was degraded by treatment with 10 μg RNAse A (Roche) for 1 h at room temperature. DNA was finally purified with an equal volume of Ampure XP beads (Beckman Coulter) and eluted in nuclease-free water. For library preparations DNA was isolated from up to 40 OD600 units.
Alkaline gel electrophoresis
Isolated genomic DNA (0.5 μg) was treated with recombinant RNase H2, purified as previously described60 and ethanol precipitated. DNA pellets were dissolved in alkaline loading dye and separated on 0.7% agarose gels (50 mM NaOH, 1 mM EDTA) as previously described27, and stained with SYBR Gold (Life Technologies). Densitometry measurements and derivation of ribonucleotide incorporation rates as previously described28. Percentage genome contribution for each replicative polymerase (x) was calculated using the following formula: NΔpolx · Fpolx / (Npola · Fpola + Npold · Fpold + Npole · Fpole) with NΔpolx, the number of ribonucleotides incorporated in one yeast genome for the mutant polymerase, above that detected in the Δrnh201 POL strain, measured on the same alkaline gel, and Fpolx the frequency of incorporation by that polymerase (see Fig. 3a).
EmRiboSeq library preparation and sequencing
DNA was sonicated using a Bioruptor Plus (Diagenode) to achieve an average fragment length of approximately 400 bp. Fragmented DNA was concentrated by ethanol precipitation and size selected using 1.2 volumes of Ampure XP. DNA was quantified by nanodrop (Thermo Scientific) and up to 5 μg was used for NEBNext End Repair and dA-Tailing (New England Biolabs) following the manufacturer’s guidelines. After the End Repair reaction DNA was purified using 1.2 volumes of Ampure XP. Subsequent steps were performed in the presence of Ampure XP beads, capturing the DNA by adding NaCl and PEG8,000 to final concentrations of 1.25 M and 10% respectively. The trP1 adapter (see below) was attached using NEBNext Quick Ligation with 120 pmol of adapter per μg of DNA for 14-18 h at 16°C.
Terminal transferase (NEB) was then used to block any free 3′ ends with ddATP for 2 h at 37°C, with 20 U of TdT per μg of DNA. After Ampure XP purification, beads were removed and DNA nicked using recombinant RNase H2 (10 pmol per μg of library) or Nb.BtsI (NEB; 10 U per μg) for 2 h at 37°C. RNase H2 purification and reaction conditions were as previously described60. Enzymes were inactivated by heating at 80°C for 20 min, and DNA was purified using 1.8 volumes of Ampure XP. Shrimp Alkaline Phosphatase (Affymetrix; 5 U) was then used to remove 5′ phosphates at 37°C (1 h per μg of library). After heat inactivation for 15 min at 65°C and Ampure XP purification, DNA was denatured by heating at 95°C for 5 min and snap cooling. Subsequently, A adapter (see below; 120 pmol per μg of library) was attached using NEBNext Quick Ligation for 14-18 h at 16°C. Fragments with biotinylated A adapter were captured on streptavidin-coupled M-280 Dynabeads (Life Technologies) following the manufacturer’s guidelines, and non-biotinylated strands were released in 0.15 M NaOH. Single stranded fragments were concentrated by ethanol precipitation.
Phusion Flash High-Fidelity PCR Master Mix (Thermo Scientific) was then used for second strand synthesis with primer A to produce a double stranded library. Size selection of fragments between 200 and 300 bp in size was performed using 2% E-Gel EX (Life Technologies). Finally, this library was quality checked and quantified using a 2100 Bioanalyzer (Agilent Technologies) prior to emulsion PCR, using the Ion Torrent One Touch, and next generation sequencing on the Ion Torrent PGM or Proton platform (Life Technologies).
Oligonucleotides and adapter design
Custom oligonucleotides were synthesised by Eurogentec. Adapter primer pairs were annealed by heating at 95°C for 5 min and cooling gradually. Sequences of the adapter primer pairs were as follows. Adapter 1 (trP1): trP1-top, 5′-CCTCTCTATGGGCAGTCGGTGAT-phosphorothioate-T-3′; trP1-bottom, 5′-Phosphate-ATCACCGACTGCCCATAGAGAGGC-dideoxy-3′. Adapter 2 (A): A-top, 5′-Phosphate-CTGAGTCGGAGACACGCAGGGATGAGATGG-dideoxy-3′; A-bottom, 5′-Biotin-CCATCTCATCCCTGCGTGTCTCCGACTCAGNNNNNN-C3 phosphoramidite-3′. The sequence for primer A used in second strand synthesis was 5′-CCATCTCATCCCTGCGTGTCTCCGAC-3′.
Data sources, sequencing data and Saccharomyces cerevisae strains
Documented in Supplementary Information, Table 1-3.
Extended Data
Extended Data Figure 1. Increased OJ and polymorphism rates correlate at binding sites of different nucleosome classes and at Rap1 binding sites.
a-f, OJ and polymorphism rates are strongly correlated for different classes of nucleosomes. Data presented as in Fig. 1a, for different sub-classes of S. cerevisiae nucleosomes, demonstrating that OJ and polymorphism rates co-vary in all cases. Transcription start site (TSS) proximal nucleosomes (d) are likely subject to strong and asymmetrically distributed selective constraints, which likely explains the modestly reduced correlation for this subset. Such TSS proximal nucleosomes were excluded from analyses of other categories presented (b, c, e, f), except ‘All nucleosomes’ (a). g, OJ and polymorphism rates are correlated for the S. cerevisiae TF, Rap1. Data presented, as for Reb1 in Fig. 1b, show elevated OJ and polymorphism rates around its binding site, with a dip corresponding to its central recognition sequence. h-j, Elevated polymorphism and OJ rates at Rap1 (h), nucleosome (i) and Reb1 binding sites (j) are not due to biases in nucleotide content. Distributions calculated as for g, Fig. 1a and b respectively, using a 3-mer preserving genome shuffle. Pink shaded areas, 95% confidence intervals for nucleotide substitution rates (100 shuffles). k, l, Polymorphism (red) and between-species (black) substitution rates are highly correlated for nucleosome (k) and Reb1 (l) binding sites. Best fit splines shown only. Y-axes scaled to demonstrate similar shape distribution. Values plotted as percentage relative to the mean rate for all data points (central 11 nt excluded for calculation of mean in l).
Extended Data Figure 2. EmRiboSeq methodology and validation.
a, Schematic of emRiboSeq library preparation. b-d, Validation of strand-specific detection of enzymatically generated nicks through linker-ligation. Nb.BtsI nicking endonuclease cleaves the bottom strand of its recognition site releasing a 5′ fragment (cyan) with a free 3′-OH group after denaturation, to which the sequencing adaptor (pink) is ligated, allowing sequencing and mapping of this site to the genome (b). Nb.BtsI libraries have high reproducibility between Δrnh201 POL and Δrnh201 Pol-α* (pol1-L868M) strains after normalising read counts to sequence tags per million (TPM). Bona fide Nb.BtsI sites were equally represented, at maximal frequency, in both libraries (c). Those with lower frequencies represented sites in close proximity to other Nb.BtsI sites, causing their partial loss during size selection. Additionally, Nb.BtsI-like sites were detected as the result of star activity. Libraries were also prepared using BciVI restriction enzyme digestion, that did not show such star activity (data not shown), allowing calculation of the site specificity for the method (>99.9%). Summed signal at Nb.BtsI sites shows >99.9% strand specificity (blue, correct strand; grey, opposite strand) and >99% single nucleotide resolution (d).
Extended Data Figure 3. Mapping replicative polymerase DNA synthesis using emRiboSeq.
a, Point mutations in replicative polymerases elevate ribonucleotide incorporation rates, permitting their contribution to genome synthesis to be tracked. Schematic of replication fork with polymerases and their ribonucleotide incorporation rates (27,30 and JS Williams, AR Clausen & TA Kunkel, personal communication) as indicated (POL, WT polymerases; *, point mutants). Embedded ribonucleotides indicated by ‘R’; additional incorporation events due to polymerase mutations highlighted by shaded circles. b, c, Mapping of leading/lagging strand synthesis by Pol δ* and Pol ε* yeast strain using emRiboSeq (as in Fig. 3) highlights both experimentally validated (pink dotted lines) and putative replication origins (grey dotted lines). These often correspond to regions of early replicating DNA36 (c). d, Pol α* DNA is detected genome-wide by emRiboSeq as a component of the lagging strand in stationary phase yeast, as shown by the opposite pattern for a polymerase WT strain. Strand ratios are shown as best fit splines with 80 degrees of freedom, y-axes show log2 of the strand ratio calculated in 2,001 nt windows (b-d).
Extended Data Figure 4. Quantification of in vivo ribonucleotide incorporation by replicative polymerases.
a, b, Representative alkaline gel electrophoresis of genomic DNA from yeast strains with mutant replicative DNA polymerases (a), with accompanying densitometry plots (b). Embedded ribonucleotides are detected by increased fragmentation of genomic DNA following alkaline treatment in an RNase H2-deficient (Δrnh201) background. Elevated rates are seen with all three mutant polymerases (indicated by *, as defined in Extended data Fig. 3a), and are reduced in Pol-ε′ which contains the point mutation M664L, a mutation that increases selectivity for dNTPs over rNTPs27. c, Quantification of average ribonucleotide incorporation in polymerase mutants from n=4 independent experiments. DNA isolated from mid-log phase cultures; error bars, SE. Overall ribonucleotide content is the product of incorporation frequency and the total contribution of each polymerase, resulting in the total ribonucleotide content detected to be highest for Pol-ε* (14,200 per genome), followed by Pol-δ* (4,300 per genome), Pol-α* (2,700 per genome), POL (1,900 per genome) and Pol-ε′ (860 per genome). d, The majority of the yeast genome exhibits directional asymmetry in replication (median 4:1 strand ratio). Count of genomic segments calculated for consecutive 2,001 nt windows over the yeast genome based on reanalysis of OF sequencing data17 denoted as ‘Okazaki-seq’. The strand asymmetry ratio was calculated after re-orienting all regions such that the predominant lagging strand was the forward strand. e-g, Genome-wide quantification of strand-specific incorporation of wild type and mutant replicative DNA polymerases determined by emRiboSeq reflects their roles in leading and lagging strand replication. A close to linear correlation with Okazaki-seq strand ratios is observed. The strand ratio preference for lagging strand ribonucleotide incorporation for independent libraries (including stationary phase libraries for POL and Pol-α*, marked by diamonds) was plotted against the lagging:leading strand ratio determined using Okazaki-seq data (only ratios ≥ 1:1 for the latter are shown for clarity). There was high reproducibility between experiments in strand ratio preferences. Lines are lowess smoothed (see Methods) representations of the full datasets (representative examples given in f and g). f, g, Scatter plots illustrating the individual strand ratio data points for 2,001 nt windows, for stationary phase POL (f) and Pol-α* (g) yeast. Pearson’s cor=0.49, p < 2.2×10⁻¹⁶ for POL (f); cor=0.75, p< 2.2×10⁻¹⁶ for Pol-α* (g).
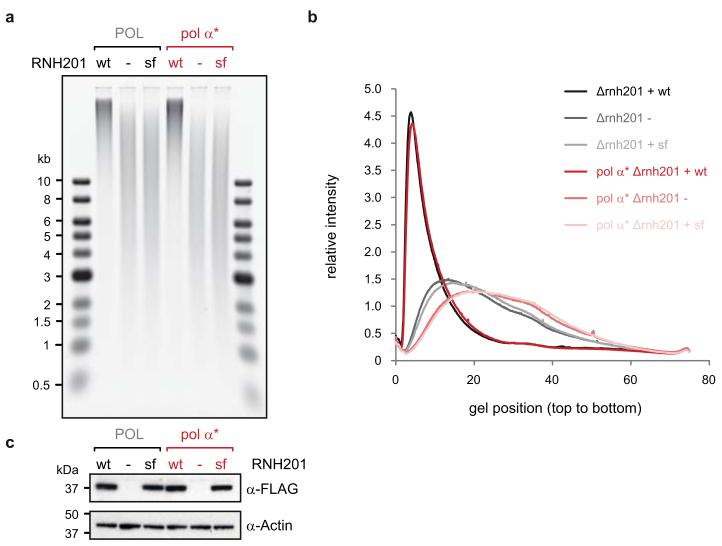
Extended Data Figure 5. Pol-α synthesised DNA retention is independent of RNaseH2 processing of RNA primers.
a, b, The ribonucleotide content of genomic DNA is unchanged between Δrnh201 strains transformed with empty vector (−) or vector expressing Rnh201p separation of function mutant (sf), that retains the ability to cleave RNA:DNA hybrids, including RNA primers, but cannot cleave single embedded ribonucleotides39. In contrast, the same vector expressing wild type Rnh201p (wt) fully rescues alkaline sensitivity of the DNA. As complementation with the SOF mutant had no detectable effect on the ribonucleotide content seen in the Pol-α L868M Δrnh201 strain, retention of Pol-α synthesised DNA appears to be independent of a putative role for RNase H2 in RNA primer removal. c, Wild type and mutant Rnh201p are expressed at equal levels, as shown by immuno-detection of the C-terminal FLAG tag. Loading control, actin.
Extended Data Figure 6. Elevated substitution rates are observed adjacent to many human TF binding sites.
a-d, Nucleotide substitution rates (plotted as GERP scores) are elevated immediately adjacent to REST (a, b) and CTCF binding sites (c, d). Colour intensity shows quartiles of ChIP-seq peak height (pink to brown: lower to higher), reflecting strength of binding/occupancy. Stronger binding correlates with greater elevation of proximal substitution rate in the ‘shoulder’ region (*). Elevated substitution rates are not a consequence of local sequence composition effects (b, d). Strongest binding quartile of sites (brown) is shown compared to a 3-mer preserving shuffle (black) based on the flanking sequence (100 to 300 nt from motif mid-point) of the same genomic locations. 95% confidence intervals are shown as a brown dashed line and grey shading, respectively. e, Substitution rates plotted as GERP scores for human TF binding sites identified in ChIP-seq datasets (in conjunction with binding site motif). Sites aligned (x=0) on the mid-point of the TF binding site within the ChIP-seq peak (colours as for a-d). Dashed black line shows y=0, the genome wide expectation for neutral evolution.
Extended Data Figure 7. OJ and polymorphism rates are elevated at yeast DNase I footprints.
a, b, DNase I footprint edges correspond, genome-wide, to elevated OJ rates and locally elevated polymorphism rates in S. cerevisiae (a), a pattern that is maintained when footprints associated with Reb1 and Rap1 binding sites are excluded (b). Genome-wide DNase I footprints (n=6,063) and excluding those within 50 nt of a Reb1 or Rap1 binding site (n=5,136) were aligned to their midpoint. c, d, Aligning DNase I footprints on their left edge rather than midpoint (to compensate for substantial heterogeneity in footprint size) demonstrates a distinct shoulder of elevated polymorphism rate at the aligned edge (c), with a significant elevation compared to nearby sequence upstream from the footprint (d). DNase I footprints from a were aligned to their left edge (x=0) with corresponding polymorphism rates shown (c). The elevated polymorphism rate cannot be explained by local sequence compositional distortions (d). Nucleotide substitution rates in the 11 nt centred on the DNase footprint edge (pink line), and another 11 nt encompassing positions −35 to −25 relative to the footprint edge (green line) were quantified. Darker pink and green filled circles denote the mean of observed substitution rates and lighter shades denote the mean for the same sites after 3-nucleotide preserving genomic shuffles. Error bars, SD; Mann-Whitney test. e, Model: Correlation of increased nucleotide substitution and OJ rates are consistent with elevated mutation frequency across heterogeneous DNase I footprints. Polymorphism is reduced at sequence-specific binding sites within the footprints, due to functional constraint. Therefore the effect of OF-related mutagenesis in these regions is most sensitively detected in the region immediately adjacent to the binding site (left of vertical dashed blue line, representing footprints aligned to their left edge). This ‘shoulder’ of elevated nucleotide substitutions represents sites with elevated, OJ-associated mutation is followed by a region of depressed substitution rates, owing to selective effects of the functional binding sites within the footprints (to the right of the dashed blue line). Signals further to the right are not interpretable given the heterogeneity in DNase I footprint sizes. Given strong selection at TF and DNase I footprint sites, this ‘shoulder’ of elevated nucleotide substitutions could represent a measure for the local mutation rate for such regions, analogous to that measured by the 4-fold degenerate sites in protein coding sequence.
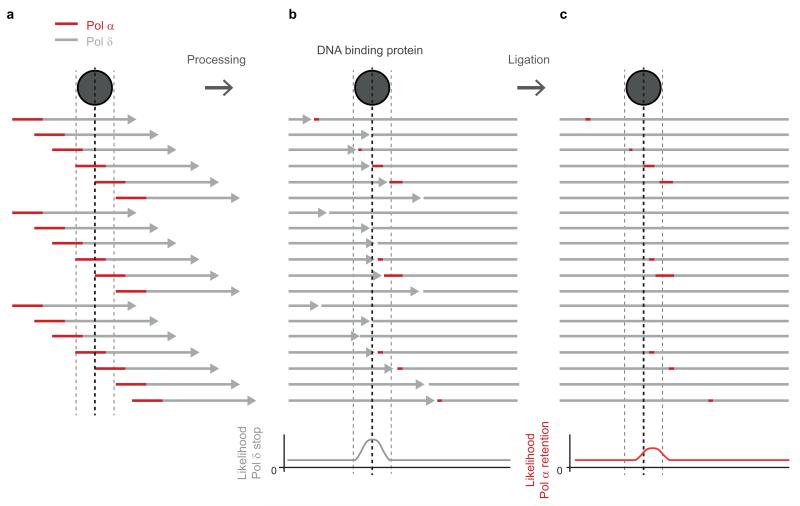
Extended Data Figure 8. Model: Pol-α DNA tract retention downstream of protein binding sites.
a, OF priming occurs stochastically, with the 5′ end of each OF initially synthesised by Pol-α and the remainder of the OF synthesised by Pol-δ. b, c, OF processing: when Pol-δ encounters the previously synthesised OF, Pol-δ continues to synthesise DNA displacing the 5′ end of the downstream OF, which is removed by nucleases to result in mature OFs which are then ligated. The OJs of such mature OFs prior to ligation were detected by Smith and Whitehouse17 after depletion of temperature sensitive DNA ligase I. They demonstrated that if a protein barrier is encountered (grey circle) Pol-δ progression is impaired, leading to reduced removal of the downstream OF (b). Given that ~1.5% of the mature genome is synthesised by Pol-α, a proportion of lagging strands will retain Pol-α synthesised DNA (red). When Pol-δ progression is impaired by protein binding, this will lead to an increased fraction of fragments containing Pol-α synthesised DNA downstream of such sites (c).
Supplementary Material
Acknowledgments
We thank N. Hastie and P. Burgers for discussions, I. Adams, J. Caceres, T.Aitman and P. Heyn for comments on the manuscript, and A. Gallacher for technical assistance. We are indebted to J. Williams, A. Clausen and T. Kunkel for sharing yeast strains and unpublished data, and to S. Cerritelli and R. Crouch for RNH201 vectors. Funding: MRC Centenary Award, MAMR; MRC and Lister Institute for Preventative Medicine, APJ; MRC and Medical Research Foundation, MST.
NGS data submitted to GEO accession number:GSE64521; R and PERL code submitted to GitHub repository taylorLab/LaggingStrand.
Footnotes
Competing financial interests
The authors declare no competing financial interests.
References
- 1.Kunkel TA. Evolving views of DNA replication (in)fidelity. Cold Spring Harb Symp Quant Biol. 2009;74:91–101. doi: 10.1101/sqb.2009.74.027. [DOI] [PMC free article] [PubMed] [Google Scholar]
- 2.Wolfe KH, Sharp PM, Li WH. Mutation rates differ among regions of the mammalian genome. Nature. 1989;337:283–5. doi: 10.1038/337283a0. [DOI] [PubMed] [Google Scholar]
- 3.Alexandrov LB, Stratton MR. Mutational signatures: the patterns of somatic mutations hidden in cancer genomes. Curr Opin Genet Dev. 2014;24:52–60. doi: 10.1016/j.gde.2013.11.014. [DOI] [PMC free article] [PubMed] [Google Scholar]
- 4.Ciccia A, Elledge SJ. The DNA damage response: making it safe to play with knives. Mol Cell. 2010;40:179–204. doi: 10.1016/j.molcel.2010.09.019. [DOI] [PMC free article] [PubMed] [Google Scholar]
- 5.Lindblad-Toh K, et al. A high-resolution map of human evolutionary constraint using 29 mammals. Nature. 2011;478:476–82. doi: 10.1038/nature10530. [DOI] [PMC free article] [PubMed] [Google Scholar]
- 6.Pollard KS, et al. Forces shaping the fastest evolving regions in the human genome. PLoS Genet. 2006;2:e168. doi: 10.1371/journal.pgen.0020168. [DOI] [PMC free article] [PubMed] [Google Scholar]
- 7.Prendergast JG, Semple CA. Widespread signatures of recent selection linked to nucleosome positioning in the human lineage. Genome Res. 2011;21:1777–87. doi: 10.1101/gr.122275.111. [DOI] [PMC free article] [PubMed] [Google Scholar]
- 8.Sasaki S, et al. Chromatin-associated periodicity in genetic variation downstream of transcriptional start sites. Science. 2009;323:401–4. doi: 10.1126/science.1163183. [DOI] [PMC free article] [PubMed] [Google Scholar]
- 9.Semple CA, Taylor MS. Molecular biology. The structure of change. Science. 2009;323:347–8. doi: 10.1126/science.1169408. [DOI] [PubMed] [Google Scholar]
- 10.Warnecke T, Batada NN, Hurst LD. The impact of the nucleosome code on protein-coding sequence evolution in yeast. PLoS Genet. 2008;4:e1000250. doi: 10.1371/journal.pgen.1000250. [DOI] [PMC free article] [PubMed] [Google Scholar]
- 11.Washietl S, Machne R, Goldman N. Evolutionary footprints of nucleosome positions in yeast. Trends Genet. 2008;24:583–7. doi: 10.1016/j.tig.2008.09.003. [DOI] [PubMed] [Google Scholar]
- 12.Ying H, Epps J, Williams R, Huttley G. Evidence that localized variation in primate sequence divergence arises from an influence of nucleosome placement on DNA repair. Mol Biol Evol. 2010;27:637–49. doi: 10.1093/molbev/msp253. [DOI] [PMC free article] [PubMed] [Google Scholar]
- 13.Johnston LH, Nasmyth KA. Saccharomyces cerevisiae cell cycle mutant cdc9 is defective in DNA ligase. Nature. 1978;274:891–3. doi: 10.1038/274891a0. [DOI] [PubMed] [Google Scholar]
- 14.Okazaki R, Okazaki T, Sakabe K, Sugimoto K, Sugino A. Mechanism of DNA chain growth. I. Possible discontinuity and unusual secondary structure of newly synthesized chains. Proc Natl Acad Sci U S A. 1968;59:598–605. doi: 10.1073/pnas.59.2.598. [DOI] [PMC free article] [PubMed] [Google Scholar]
- 15.Balakrishnan L, Bambara RA. Okazaki fragment metabolism. Cold Spring Harb Perspect Biol. 2013;5 doi: 10.1101/cshperspect.a010173. [DOI] [PMC free article] [PubMed] [Google Scholar]
- 16.Zheng L, Shen B. Okazaki fragment maturation: nucleases take centre stage. J Mol Cell Biol. 2011;3:23–30. doi: 10.1093/jmcb/mjq048. [DOI] [PMC free article] [PubMed] [Google Scholar]
- 17.Smith DJ, Whitehouse I. Intrinsic coupling of lagging-strand synthesis to chromatin assembly. Nature. 2012;483:434–8. doi: 10.1038/nature10895. [DOI] [PMC free article] [PubMed] [Google Scholar]
- 18.Stith CM, Sterling J, Resnick MA, Gordenin DA, Burgers PM. Flexibility of eukaryotic Okazaki fragment maturation through regulated strand displacement synthesis. J Biol Chem. 2008;283:34129–40. doi: 10.1074/jbc.M806668200. [DOI] [PMC free article] [PubMed] [Google Scholar]
- 19.Perera RL, et al. Mechanism for priming DNA synthesis by yeast DNA Polymerase alpha. Elife. 2013;2:e00482. doi: 10.7554/eLife.00482. [DOI] [PMC free article] [PubMed] [Google Scholar]
- 20.Walsh E, Eckert KA. Eukaryotic Replicative DNA Polymerases. Nucleic Acid Polymerases. 2014;30:17–41. [Google Scholar]
- 21.Pavlov YI, et al. Evidence that errors made by DNA polymerase alpha are corrected by DNA polymerase delta. Curr Biol. 2006;16:202–7. doi: 10.1016/j.cub.2005.12.002. [DOI] [PubMed] [Google Scholar]
- 22.Maga G, et al. Okazaki fragment processing: modulation of the strand displacement activity of DNA polymerase delta by the concerted action of replication protein A, proliferating cell nuclear antigen, and flap endonuclease-1. Proc Natl Acad Sci U S A. 2001;98:14298–303. doi: 10.1073/pnas.251193198. [DOI] [PMC free article] [PubMed] [Google Scholar]
- 23.Kunkel TA, Hamatake RK, Motto-Fox J, Fitzgerald MP, Sugino A. Fidelity of DNA polymerase I and the DNA polymerase I-DNA primase complex from Saccharomyces cerevisiae. Mol Cell Biol. 1989;9:4447–58. doi: 10.1128/mcb.9.10.4447. [DOI] [PMC free article] [PubMed] [Google Scholar]
- 24.Lujan SA, et al. Heterogeneous polymerase fidelity and mismatch repair bias genome variation and composition. Genome Res. 2014 doi: 10.1101/gr.178335.114. [DOI] [PMC free article] [PubMed] [Google Scholar]
- 25.Nick McElhinny SA, Kissling GE, Kunkel TA. Differential correction of lagging-strand replication errors made by DNA polymerases {alpha} and {delta} Proc Natl Acad Sci U S A. 2010;107:21070–5. doi: 10.1073/pnas.1013048107. [DOI] [PMC free article] [PubMed] [Google Scholar]
- 26.Niimi A, et al. Palm mutants in DNA polymerases alpha and eta alter DNA replication fidelity and translesion activity. Mol Cell Biol. 2004;24:2734–46. doi: 10.1128/MCB.24.7.2734-2746.2004. [DOI] [PMC free article] [PubMed] [Google Scholar]
- 27.Nick McElhinny SA, et al. Genome instability due to ribonucleotide incorporation into DNA. Nat Chem Biol. 2010;6:774–81. doi: 10.1038/nchembio.424. [DOI] [PMC free article] [PubMed] [Google Scholar]
- 28.Reijns MA, et al. Enzymatic Removal of Ribonucleotides from DNA Is Essential for Mammalian Genome Integrity and Development. Cell. 2012;149:1008–1022. doi: 10.1016/j.cell.2012.04.011. [DOI] [PMC free article] [PubMed] [Google Scholar]
- 29.Sparks JL, et al. RNase H2-initiated ribonucleotide excision repair. Mol Cell. 2012;47:980–6. doi: 10.1016/j.molcel.2012.06.035. [DOI] [PMC free article] [PubMed] [Google Scholar]
- 30.Lujan SA, Williams JS, Clausen AR, Clark AB, Kunkel TA. Ribonucleotides are signals for mismatch repair of leading-strand replication errors. Mol Cell. 2013;50:437–43. doi: 10.1016/j.molcel.2013.03.017. [DOI] [PMC free article] [PubMed] [Google Scholar]
- 31.Lujan SA, et al. Mismatch repair balances leading and lagging strand DNA replication fidelity. PLoS Genet. 2012;8:e1003016. doi: 10.1371/journal.pgen.1003016. [DOI] [PMC free article] [PubMed] [Google Scholar]
- 32.Miyabe I, Kunkel TA, Carr AM. The major roles of DNA polymerases epsilon and delta at the eukaryotic replication fork are evolutionarily conserved. PLoS Genet. 2011;7:e1002407. doi: 10.1371/journal.pgen.1002407. [DOI] [PMC free article] [PubMed] [Google Scholar]
- 33.Nick McElhinny SA, Gordenin DA, Stith CM, Burgers PM, Kunkel TA. Division of labor at the eukaryotic replication fork. Mol Cell. 2008;30:137–44. doi: 10.1016/j.molcel.2008.02.022. [DOI] [PMC free article] [PubMed] [Google Scholar]
- 34.Larrea AA, et al. Genome-wide model for the normal eukaryotic DNA replication fork. Proc Natl Acad Sci U S A. 2010;107:17674–9. doi: 10.1073/pnas.1010178107. [DOI] [PMC free article] [PubMed] [Google Scholar]
- 35.Pursell ZF, Isoz I, Lundstrom EB, Johansson E, Kunkel TA. Yeast DNA polymerase epsilon participates in leading-strand DNA replication. Science. 2007;317:127–30. doi: 10.1126/science.1144067. [DOI] [PMC free article] [PubMed] [Google Scholar]
- 36.Raghuraman MK, et al. Replication dynamics of the yeast genome. Science. 2001;294:115–21. doi: 10.1126/science.294.5540.115. [DOI] [PubMed] [Google Scholar]
- 37.Nick McElhinny SA, et al. Abundant ribonucleotide incorporation into DNA by yeast replicative polymerases. Proc Natl Acad Sci U S A. 2010;107:4949–54. doi: 10.1073/pnas.0914857107. [DOI] [PMC free article] [PubMed] [Google Scholar]
- 38.Kao HI, Bambara RA. The protein components and mechanism of eukaryotic Okazaki fragment maturation. Crit Rev Biochem Mol Biol. 2003;38:433–52. doi: 10.1080/10409230390259382. [DOI] [PubMed] [Google Scholar]
- 39.Chon H, et al. RNase H2 roles in genome integrity revealed by unlinking its activities. Nucleic Acids Res. 2013;41:3130–43. doi: 10.1093/nar/gkt027. [DOI] [PMC free article] [PubMed] [Google Scholar]
- 40.Boyle AP, et al. High-resolution genome-wide in vivo footprinting of diverse transcription factors in human cells. Genome Res. 2011;21:456–64. doi: 10.1101/gr.112656.110. [DOI] [PMC free article] [PubMed] [Google Scholar]
- 41.Cooper GM, et al. Distribution and intensity of constraint in mammalian genomic sequence. Genome Res. 2005;15:901–13. doi: 10.1101/gr.3577405. [DOI] [PMC free article] [PubMed] [Google Scholar]
- 42.Schmidt S, et al. Hypermutable non-synonymous sites are under stronger negative selection. PLoS Genet. 2008;4:e1000281. doi: 10.1371/journal.pgen.1000281. [DOI] [PMC free article] [PubMed] [Google Scholar]
- 43.Vengrova S, Dalgaard JZ. The wild-type Schizosaccharomyces pombe mat1 imprint consists of two ribonucleotides. EMBO Rep. 2006;7:59–65. doi: 10.1038/sj.embor.7400576. [DOI] [PMC free article] [PubMed] [Google Scholar]
- 44.Ghodgaonkar MM, et al. Ribonucleotides misincorporated into DNA act as strand-discrimination signals in eukaryotic mismatch repair. Mol Cell. 2013;50:323–32. doi: 10.1016/j.molcel.2013.03.019. [DOI] [PMC free article] [PubMed] [Google Scholar]
- 45.Liberti SE, Larrea AA, Kunkel TA. Exonuclease 1 preferentially repairs mismatches generated by DNA polymerase alpha. DNA Repair (Amst) 2013;12:92–6. doi: 10.1016/j.dnarep.2012.11.001. [DOI] [PMC free article] [PubMed] [Google Scholar]
- 46.Burgess RJ, Zhang Z. Histone chaperones in nucleosome assembly and human disease. Nat Struct Mol Biol. 2013;20:14–22. doi: 10.1038/nsmb.2461. [DOI] [PMC free article] [PubMed] [Google Scholar]
- 47.Villar D, Flicek P, Odom DT. Evolution of transcription factor binding in metazoans - mechanisms and functional implications. Nat Rev Genet. 2014;15:221–33. doi: 10.1038/nrg3481. [DOI] [PMC free article] [PubMed] [Google Scholar]
Methods References
- 48.Kuhn RM, Haussler D, Kent WJ. The UCSC genome browser and associated tools. Brief Bioinform. 2013;14:144–61. doi: 10.1093/bib/bbs038. [DOI] [PMC free article] [PubMed] [Google Scholar]
- 49.Derrien T, et al. Fast computation and applications of genome mappability. PLoS One. 2012;7:e30377. doi: 10.1371/journal.pone.0030377. [DOI] [PMC free article] [PubMed] [Google Scholar]
- 50.Eaton ML, Galani K, Kang S, Bell SP, MacAlpine DM. Conserved nucleosome positioning defines replication origins. Genes Dev. 2010;24:748–53. doi: 10.1101/gad.1913210. [DOI] [PMC free article] [PubMed] [Google Scholar]
- 51.Hesselberth JR, et al. Global mapping of protein-DNA interactions in vivo by digital genomic footprinting. Nat Methods. 2009;6:283–9. doi: 10.1038/nmeth.1313. [DOI] [PMC free article] [PubMed] [Google Scholar]
- 52.Jiang C, Pugh BF. A compiled and systematic reference map of nucleosome positions across the Saccharomyces cerevisiae genome. Genome Biol. 2009;10:R109. doi: 10.1186/gb-2009-10-10-r109. [DOI] [PMC free article] [PubMed] [Google Scholar]
- 53.Liti G, et al. Population genomics of domestic and wild yeasts. Nature. 2009;458:337–41. doi: 10.1038/nature07743. [DOI] [PMC free article] [PubMed] [Google Scholar]
- 54.Yang Z. PAML 4: phylogenetic analysis by maximum likelihood. Mol Biol Evol. 2007;24:1586–91. doi: 10.1093/molbev/msm088. [DOI] [PubMed] [Google Scholar]
- 55.Rhee HS, Pugh BF. Comprehensive genome-wide protein-DNA interactions detected at single-nucleotide resolution. Cell. 2011;147:1408–19. doi: 10.1016/j.cell.2011.11.013. [DOI] [PMC free article] [PubMed] [Google Scholar]
- 56.Korhonen J, Martinmaki P, Pizzi C, Rastas P, Ukkonen E. MOODS: fast search for position weight matrix matches in DNA sequences. Bioinformatics. 2009;25:3181–2. doi: 10.1093/bioinformatics/btp554. [DOI] [PMC free article] [PubMed] [Google Scholar]
- 57.Mathelier A, et al. JASPAR 2014: an extensively expanded and updated open-access database of transcription factor binding profiles. Nucleic Acids Res. 2014;42:D142–7. doi: 10.1093/nar/gkt997. [DOI] [PMC free article] [PubMed] [Google Scholar]
- 58.An integrated encyclopedia of DNA elements in the human genome. Nature. 2012;489:57–74. doi: 10.1038/nature11247. [DOI] [PMC free article] [PubMed] [Google Scholar]
- 59.Thurman RE, et al. The accessible chromatin landscape of the human genome. Nature. 2012;489:75–82. doi: 10.1038/nature11232. [DOI] [PMC free article] [PubMed] [Google Scholar]
- 60.Reijns MA, et al. The structure of the human RNase H2 complex defines key interaction interfaces relevant to enzyme function and human disease. J Biol Chem. 2011;286:10530–9. doi: 10.1074/jbc.M110.177394. [DOI] [PMC free article] [PubMed] [Google Scholar]
- 61.Cherry JM, et al. Saccharomyces Genome Database: the genomics resource of budding yeast. Nucleic Acids Res. 2012;40:D700–5. doi: 10.1093/nar/gkr1029. [DOI] [PMC free article] [PubMed] [Google Scholar]
- 62.Gertz J, et al. Distinct properties of cell-type-specific and shared transcription factor binding sites. Mol Cell. 2013;52:25–36. doi: 10.1016/j.molcel.2013.08.037. [DOI] [PMC free article] [PubMed] [Google Scholar]
- 63.Trompouki E, et al. Lineage regulators direct BMP and Wnt pathways to cell-specific programs during differentiation and regeneration. Cell. 2011;147:577–89. doi: 10.1016/j.cell.2011.09.044. [DOI] [PMC free article] [PubMed] [Google Scholar]
- 64.Tan SK, et al. AP-2gamma regulates oestrogen receptor-mediated long-range chromatin interaction and gene transcription. EMBO J. 2011;30:2569–81. doi: 10.1038/emboj.2011.151. [DOI] [PMC free article] [PubMed] [Google Scholar]
- 65.Sahu B, et al. Dual role of FoxA1 in androgen receptor binding to chromatin, androgen signalling and prostate cancer. EMBO J. 2011;30:3962–76. doi: 10.1038/emboj.2011.328. [DOI] [PMC free article] [PubMed] [Google Scholar]
- 66.Tan PY, et al. Integration of regulatory networks by NKX3-1 promotes androgen-dependent prostate cancer survival. Mol Cell Biol. 2012;32:399–414. doi: 10.1128/MCB.05958-11. [DOI] [PMC free article] [PubMed] [Google Scholar]
- 67.Eijkelenboom A, et al. Genome-wide analysis of FOXO3 mediated transcription regulation through RNA polymerase II profiling. Mol Syst Biol. 2013;9:638. doi: 10.1038/msb.2012.74. [DOI] [PMC free article] [PubMed] [Google Scholar]
- 68.Kasowski M, et al. Variation in transcription factor binding among humans. Science. 2010;328:232–5. doi: 10.1126/science.1183621. [DOI] [PMC free article] [PubMed] [Google Scholar]
- 69.Costessi A, et al. The tumour antigen PRAME is a subunit of a Cul2 ubiquitin ligase and associates with active NFY promoters. EMBO J. 2011;30:3786–98. doi: 10.1038/emboj.2011.262. [DOI] [PMC free article] [PubMed] [Google Scholar]
- 70.Ram O, et al. Combinatorial patterning of chromatin regulators uncovered by genome-wide location analysis in human cells. Cell. 2011;147:1628–39. doi: 10.1016/j.cell.2011.09.057. [DOI] [PMC free article] [PubMed] [Google Scholar]
- 71.Schoofs T, et al. DNA methylation changes are a late event in acute promyelocytic leukemia and coincide with loss of transcription factor binding. Blood. 2013;121:178–87. doi: 10.1182/blood-2012-08-448860. [DOI] [PubMed] [Google Scholar]
Associated Data
This section collects any data citations, data availability statements, or supplementary materials included in this article.


