

Abstract
Background
Chronic Kidney Disease (CKD) is associated with alterations in phosphorus excretion, and increases in fibroblast growth factor (FGF23) and parathyroid hormone (PTH). Plant protein based phytate bound phosphorus, is less bioavailable than that from animal sources. Our prior one week study showed that a nearly 100% plant protein based diet benefits mineral metabolism in CKD; however this diet may not be acceptable to patients. Here we hypothesize that a diet containing 70% protein from plants has similar efficacy and is tolerated by CKD patients.
Methods
Thirteen subjects with CKD 3-4 received an omnivore diet containing 70% protein from plants for 4 weeks. The primary outcome was change in 24 hour urine phosphorus. Secondary outcomes were changes in serum phosphorus, FGF23, PTH, urine sodium excretion, grip strength and fat free mass. Repeated measures analysis of variance (ANOVA) was used to test differences in parameters over the 4 weeks.
Results
Mean age of subjects was 54.8 years. Median eGFR was 26 (IQR 14.7) ml/min/1.73m2. Over the 4 week period, urine phosphorus significantly decreased by 215±232 mg/day (p<0.001). No significant changes in serum FGF23, phosphorus or PTH were noted. Urine sodium and titratable acid decreased significantly on the diet. Hand grip strength and fat-free mass did not change. There were two hyperkalemia events both 5.8 meq/l, corrected by food substitutions. No other adverse events were observed.
Conclusions
A 70% plant protein diet is safe, tolerated, and efficacious in lowering urine phosphorus excretion and may be an alternative to phosphate binders.
Keywords: plant-based protein, mineral, phosphorus, phytate
Introduction
Disturbances in urinary excretion of phosphorus, reflective of its intestinal absorption, occurs early in CKD and changes in FGF23 and PTH in CKD are likely compensatory responses to this decrease [1]. In the general population, increased dietary phosphorus intake is associated with left ventricular hypertrophy [2], a nine fold increased risk of fractures [3] and increased mortality [4]. In CKD, hyperphosphatemia is associated with increased cardiovascular disease [5, 6] and fractures [7, 8] resulting in decreased quality of life and survival in CKD.
In the western diet, phosphorus is ingested primarily from animal and dairy foods and as preservatives or additives in processed foods. Since foods high in phosphorus are high in protein, guidelines suggest adherence to foods with a phosphate/protein ratio of 10-12 mg/g, which can be difficult for patients given the lack of phosphorus information on food labels [9]. Our group found that a grain, compared to meat/casein diet reduced phosphorus and PTH in a rodent model of CKD-MBD [10]. We hypothesized that this was due to binding of phosphorus to phytate in the grains, reducing bioavailability. We then examined the efficacy of one week of a nearly 100% plant protein based diet versus a diet with 80% animal protein in patients with advanced CKD (mean eGFR of 32 ml/min/1.73m2) in a crossover trial, demonstrating lower fasting serum phosphorus and FGF23, and decreased urinary phosphorus excretion on the plant-based diet [11].
However, adherence to a 100% protein from plants diet is difficult in those who are not self-declared vegans [12], and thus a diet that allows 30% animal protein in patients with advanced CKD may be better tolerated. We therefore tested the hypothesis that a diet consisting of 70% protein from plants and 30% protein from animals (meat, dairy, eggs) would lower urinary phosphorus excretion and FGF23 and whether this effect would be sustained over a 4 week period. We assessed whether there were adverse effects on potassium and blood sugars and monitored for unintentional weight loss. There are reports of correlations of skeletal muscle mass with animal protein content in diets [13, 14] and therefore we monitored fat free mass and hand-grip strength.
Subjects and Methods
The study was 6 weeks long, with a pre-study phase of 1-2 weeks and study diet phase of 4 weeks. Subjects were recruited from clinics managed by Indiana University Nephrology. Inclusion criteria were 1) Age > 18 years, 2) eGFR 15-60 ml/min/1.73m2 and determined to be chronic in etiology per primary nephrologist, 3) medically stable, 4) able to give informed consent and 5) able to read and comprehend diet instructions. Exclusion criteria were 1) uncontrolled high blood pressure defined by primary nephrologist, 2) acute kidney injury, 3) anticipated dialysis within the next 6 months, 4) proteinuria greater than 10 g or with an increase by 50% in the past year, 5) prescribed phosphate binders, 6) prescribed calcitriol or its analogs in the previous 30 days, 7) unable to tolerate planned diets, or 8) cirrhosis. All study procedures were conducted in accordance with the Declaration of Helsinki and documents were approved by the Indiana University School of Medicine Institutional Review Board.
Figure 1 shows the study design. The pre-study phase was two weeks during which the subjects were asked to consume their usual diet and collect two 24 hour urines and undergo blood tests, which were averaged to yield baseline values for urine and blood, respectively. The baseline dietary intake was based on 5 days of food records that included at least one weekend day and one weekday. Baseline dietary protein source intake was calculated using Minnesota Nutrition Data System for Research (NDSR, version 2011: http://www.ncc.umn.edu/products/ndsr.html) by study dietitian. The dietary records were reviewed with study personnel and a food recall performed as needed for clarification. During the pre-study phase, subjects also discussed food preferences, dislikes, allergies and intolerances with the study dietitian to optimize the standardized prepared study diets for the intervention period. The study diet period was 4 weeks in duration, with 7 study visits to pick up prepared food, determine compliance, assess adverse events and provide education. End point assessments were done at 2 and 4 weeks of the study period (Figure 1). All foods and beverages (except water) were provided and prepared by the Indiana Clinical Research Institute (ICRC) kitchen. Subjects were counseled by study dietitian to consume provided foods and beverages. Subject compliance was assessed with the use of “menu checklists” where subjects marked all food items consumed on a list of provided food items.
Figure 1.
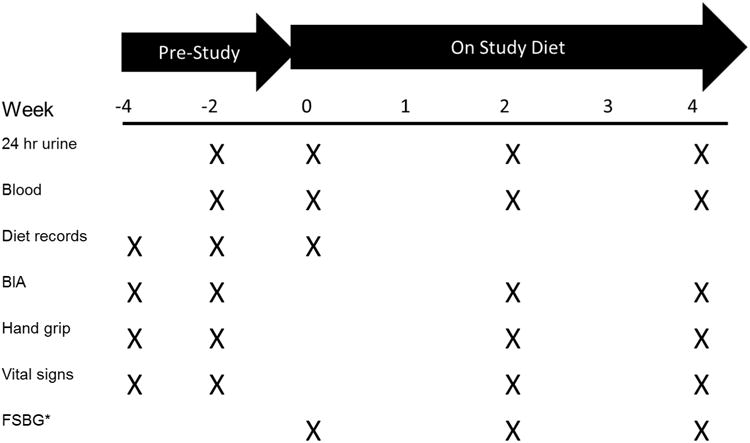
Overview of Study, with key study procedures on the right, and their timing represented by an X. There were a total of 7 visits in the 0 to 4 week “study diet” period for pick-up of prepared foods, including the 3 visits with end point assessments.
All 24 hour urine collections were analyzed for phosphorus, sodium, potassium, creatinine, urea nitrogen, sulfates, pH, citrate, ammonium and calcium by commercially available assays (http://www.litholink.com). Blood draws were performed on the day of return of all 24hr urine collections and analyzed for basic metabolic profile, calcium, phosphorus and albumin using the hospital laboratory. Blood was collected, stored at -80°C and batch analyzed for C-terminal FGF23 (Immunotopics, San Clemente, CA) and intact PTH (ALPCO, Salem, NH).
Subjects underwent bioelectrical impedance (BIA) testing using a body analyzer (Tanita Scale UM-061) and hand grip strength measurements (Northern Coast Medical Precision Instruments, Gilroy, CA). Each reading for both measures was performed in duplicates and the average measure used. Diabetic subjects were asked to maintain blood glucose and insulin logs and bring these to study visits to adjust as needed.
Study diets were designed to deliver 0.8-.9 mg/kg protein (0.84/kg protein mean), 0.8-1.3g of P, ∼700-1000 mg of calcium, 2-4 g sodium (2.2g mean), and 2-3 g potassium as recommended for CKD patients [9]. The protein source was 70% from plant sources and the diets repeated every 4 days. Nutrient and phytate content of foods used in study were obtained from the University of Minnesota Nutrition Data System for Research and food labels. Diets were ashed to confirm composition and only minor adjustments to the menu were required. Food was purchased from local grocery stores using predominately preservative free food if available to maximize accuracy of the nutrient database assessment. Table 1 shows a sample menu of study diet for 4 days. Subject's energy requirements were estimated using self-reported physical activity levels and the sex-specific equation published by the Institute of Medicine [15]. Table 2 indicates the final diet composition. . During the 4 weeks additional dietary modifications were done only for safety reasons, i.e.a serum potassium≥5.8 meq/l. (hyperkalemia).
Table 1. Sample Week Menu for 4 week Study Diet.
| Day 1 | Day 2 | Day 3 | Day 4 |
|---|---|---|---|
|
Breakfast Mixed Fruit Pancakes with Syrup & Margarine Orange Juice Coffee* |
Breakfast Banana Fresh Egg Soft Bagel with Margarine & Jam Grape Juice Coffee* |
Breakfast Fresh Grapes Kashi Go Lean Crunch with 2% Milk Cinnamon Bread with Margarine Pineapple Orange Juice Coffee* |
Breakfast Fresh Mandarin Orange Cheese Omelet Hashbrown Potatoes Whole Wheat Toast with Margarine & Jam Apple Juice Coffee* |
|
Lunch Peanut Butter & Jelly on Whole Wheat Bread Unsalted Pretzels Fresh Baby Carrots & Celery Sticks Cucumber Dill Dip Diced Pears |
Lunch Caesar Salad with Croutons Flatbread Turkey Sausage Pizza Supreme Fresh Apple 7-Up |
Lunch Nachos Supreme (Vegetarian Taco Meat, Black Beans, Cheese, Salsa, Sour Cream & Guacamole) Mandarin Oranges in Orange Gelatin |
Lunch Cheeseburger Slider Ketchup & Mustard Potato Chips Watermelon Brownie Bites 7-Up |
|
Snack Lorna Doone Cookies 2% Milk |
Snack Granola Bar Crystal Light |
Snack Pita Chips 7-Up |
Snack Snack Mix Crystal Light |
|
Dinner Garden Salad (Carrots/Red Cabbage/Tomatoes) with Italian Dressing Spaghetti & Turkey Meatsauce Fresh Broccoli w/Margarine French Roll Angel Food Cake with Strawberries Water or Iced Tea* |
Dinner Meatless Salisbury Steak with Mushroom Gravy Oven Potato Wedges Green Beans w/Margarine French Roll w/Margarine Soy Pudding Water or Iced Tea* |
Dinner BBQ Pulled Pork Coleslaw Corn w/Margarine Dinner Roll w/Margarine Peaches Water or Iced Tea* |
Dinner Asian Vegetarian Stirfry with Edamame White Rice Pineapple Tidbits Water or Iced Tea* |
|
Snack Cheese & Crackers 7-Up |
Snack Oreo Cookies 2% Milk |
Snack Popcorn Crystal Light |
Snack Peanut Butter Crackers Crystal Light |
Animal sources of protein are in bold
Table 2.
Composition of Prescribed 4 week Study Diet by Study Subject:
| ID | kcal | Pro gm/kg | Pro gm | Pro % Kcal | Pro Veg % | Pro Animal % | Cho % Kcal * | Fat % Kcal | P | Ca | Na | K |
|---|---|---|---|---|---|---|---|---|---|---|---|---|
| 1 | 2209 | 0.90 | 76.6 | 13.3 | 69.1 | 30.9 | 52.9 | 30.4 | 1072 | 709 | 2632 | 2442 |
| 2 | 2171 | 0.80 | 81.8 | 14.4 | 70.0 | 30.0 | 58.4 | 27.3 | 1119 | 906 | 2963 | 3025 |
| 3 | 2021 | 0.80 | 87.8 | 16.6 | 68.9 | 31.1 | 51.0 | 32.3 | 1259 | 674 | 2874 | 2340 |
| 4 | 2692 | 0.80 | 93.7 | 13.3 | 70.0 | 30.0 | 57.2 | 29.5 | 1311 | 925 | 3069 | 3000 |
| 5 | 2269 | 0.80 | 82.1 | 13.8 | 68.9 | 31.1 | 55.1 | 31.2 | 1160 | 790 | 2805 | 2734 |
| 6 | 3290 | 0.90 | 98.9 | 11.5 | 70.4 | 29.6 | 60.3 | 28.2 | 1380 | 1031 | 3955 | 3689 |
| 7 | 2101 | 0.80 | 80.2 | 14.6 | 69.8 | 30.2 | 58.6 | 26.9 | 1096 | 883 | 2881 | 2921 |
| 8 | 2038 | 0.80 | 72.7 | 13.6 | 69.8 | 30.2 | 58.8 | 27.7 | 1021 | 811 | 2746 | 2756 |
| 9 | 2020 | 0.80 | 82.3 | 15.5 | 70.1 | 29.9 | 53.9 | 30.7 | 1175 | 770 | 2795 | 2532 |
| 10 | 1756 | 0.90 | 57.1 | 12.4 | 69.0 | 31.0 | 61.3 | 26.3 | 842 | 634 | 2258 | 2333 |
| 11 | 2705 | 0.80 | 91.1 | 12.9 | 70.1 | 29.9 | 56.8 | 30.2 | 1277 | 843 | 3159 | 2922 |
| 12 | 2262 | 0.90 | 75.8 | 12.7 | 69.1 | 30.9 | 58.6 | 28.9 | 1104 | 757 | 2956 | 2855 |
| 13 | 2255 | 0.91 | 70.3 | 11.9 | 69.3 | 30.7 | 60.4 | 27.7 | 1025 | 741 | 2900 | 2750 |
Pro=protein; Cho=carbohydrate; Ca=Calcium; Na=Sodium; K= Potassium
Subjects 1, 3, 5, 9 with relatively lower percentage of energy requirements met through carbohydrate due to their diabetic diet carbohydrate restriction.
Statistical analyses
We determined that a sample size of 5 subjects would have given us 80% power using paired t test and an alpha of 0.05 to detect a difference of 0.36± 0.21 g/24hrs in urine phosphorus excretion, the achieved difference in urine phosphorus excretion in the nearly 100% protein from plants diet in a one week trial[11]. However, given we did not have prior data for the effect of a 70% protein from plants diet on urine phosphorus excretion, we targeted a final n=12, the number of suggested subjects for a pilot trial [16], recruiting 16 to allow for drop outs.
Paired t-tests or signed rank tests were used to calculate comparisons between baseline study measures (average of 2 pre-study blood and urine collections) and the average of values at week 2 and 4. Repeated measures ANOVA and ANOVA on ranks were also performed to compare the changes in each study parameter in blood and urine over time, using data from the 2 and 4 week collections Results are expressed as mean ± SD, or as median (25th, 75th percentile) if non-normally distributed. A significance level of α = 0.05 was used for statistical tests. Analyses were performed using Sigmaplot (SigmaPlot, Chicago, IL).
Results
Thirteen subjects, 6 males and 7 females, aged 54.8 +/- 13 years completed the study. Of these subjects 7 were Caucasian and 4 were diabetic. Sixteen subjects consented, but two dropped out due to transportation issues and one subject because of food dislikes. Table 3 shows the characteristics for the 13 participants who completed the study. Based on the nutrient analysis of 5 days of food records in the pre-study period, subjects had a mean intake of 35±0.1 % of plant based protein on their “usual” or pre-study diet. This compares to 70±0.5% plant based protein in the study period (p <0.001). The change in phytate was also significant from a mean of 532±416 mg per day in the pre-study period to 1333±215 mg of phytate per day on the study diet (p<0.001). There was an overall median 95% compliance with the prescribed diets, with a median compliance of 94% in the first 2 weeks and 97% in the later 2 weeks, though 3 subjects had a drop in compliance between these time points (Table 3).
Table 3.
Subject Characteristics and Compliance with Study Diet:
| Subject | Age | Sex | eGFR | Ethnicity | CKD cause | DM | BMI | Diet Compliance median% (2 weeks) | Diet Compliance median% (4 weeks) |
|---|---|---|---|---|---|---|---|---|---|
| 1 | 68 | M | 17 | C | HTN | yes | 34.1 | 94 | 91 |
| 2 | 59 | F | 28 | C | HTN | no | 41.9 | 92 | 97 |
| 3 | 70 | M | 48 | AA | DM, HTN | yes | 35.6 | 100 | 100 |
| 4 | 67 | M | 28 | C | HTN | no | 36.5 | 100 | 100 |
| 5 | 44 | F | 20 | AA | GN | yes | 40.6 | 91 | 91 |
| 6 | 25 | M | 23 | C | VUR | no | 33.1 | 100 | 100 |
| 7 | 62 | F | 26 | C | HTN | no | 40.9 | 79 | 67 |
| 8 | 54 | F | 38 | AA | HTN | no | 35.5 | 86 | 92 |
| 9 | 56 | M | 19 | AA | DM | yes | 38.6 | 100 | 100 |
| 10 | 56 | F | 15 | C | PKD | no | 23.9 | 91 | 98 |
| 11 | 69 | M | 28 | AA | PKD | no | 31.1 | 90 | 94 |
| 12 | 43 | F | 18 | C | PKD | no | 29.5 | 97 | 100 |
| 13 | 39 | F | 50 | AA | PKD | no | 28.4 | 96 | 91 |
HTN: hypertension, DM: Diabetes Mellitus, VUR: Vesicourethral reflux, N: Glomerulonephritis, PKD: Polycystic Kidney Disease
BMI: body mass index
AA: African American; C: Caucasian
The primary end point for the study was urinary phosphorus excretion which decreased from 830 ± 244 mg/day (range 0.4 to 1.2 g/day) by 28% to an average of 597 ± 233 mg/day(p<0.001) by paired t-tests. Figure 2 shows the change in urine phosphorus excretion by subject. There was no significant difference in % diet compliance between the 6 subjects who had an increase in urine phosphorus between the 2 week and 4 week visit and the others (95 versus 98%, p=0.5). Urine phosphorus decreased significantly over time (by 30% at 2 weeks and 26% at 4 weeks from baseline), with no significant difference between the 2 and 4 week measure. (See Table 4 for repeated measures analysis and values for urine parameters). Mean urine creatinine excretion dropped significantly during the study period (p=0.038), however this did not alter creatinine clearance. Normalizing the urinary phosphorus excretion to the urine creatinine excretion did not alter the results. The titratable acid and urinary ammonium excretion decreased significantly (p=0.003 and 0.002 respectively), although changes in urine pH were not significant (p=0.2). Urine sodium excretion significantly decreased.
Figure 2.

Twenty-four hour Urine P excretion for each of the 13 subjects. There are 3 bars per subject, depicting the pre-study urine P excretion, on 2 weeks of study diet and on 4 weeks of study diet.
Table 4. Effect of a 70% Plant Protein based Diet on Urine Parameters.
| Baseline* | 2 weeks on Study Diet | 4 weeks on Study Diet | p | |
|---|---|---|---|---|
| Mean±SD or Median (25th, 75th percentile) | ||||
| Urine P (mg/24hrs) | 830±244 | 580±215a | 615±273a,b | 0.001 |
| Urine P/Cr | 0.48±0.1 | 0.37±0.1a | 0.39±0.1a,b | <0.001 |
| Urine Creatinine (mg/24hrs) | 1748±463 | 1613±508 | 1543±395a | 0.038 |
| 24h Creatinine Clearance (ml/min) | 51±17 | 46±13 | 48±15 | 0.26 |
| Urine urea nitrogen (g/24 hrs) | 10.5±4.23 | 9.08±2.74 | 9.15±4.04 | 0.26 |
| 24h Urea clearance (ml/min) | 22 ± 8 | 19±5 | 20±9 | 0.31 |
| Urine Calcium (mg/24 hours) | 19 (10,26) | 31 (26,53)a | 27 (15,33) | 0.007 |
| Urine Citrate (mg/24 hrs) | 279±147 | 353±168 | 317±79 | 0.107 |
| Urine Sodium (mmol/24 hrs) | 200±81 | 142±44a | 132±51a | 0.002 |
| Urine Sulfate (meq/24 hrs) | 42 ±17 | 36±12 | 36±15 | 0.162 |
| Urine pH | 6.0 ± 0.5 | 6.2±0.6 | 6.2±0.5 | 0.2 |
| Urine Ammonium excretion (mmol/24 hrs) | 18±10 | 10±6a | 12±8a | 0.002 |
| Titratable acid (meq/24hrs) | 17.9±8.5 | 10.8±5.6a | 12.6±9.5a | 0.003 |
= average of 2 baseline collections done during pre-study period.
= significant when compared to baseline p<0.05.
=significant when compared to 2 week value p<0.05.
Repeated measures testing were used by one way ANOVA and Holm-Sidak method for pairwise comparisons for normally distributed data. For non normal data, repeated measures testing was done using ANOVA on ranks, with Tukey testing for pairwise comparisons.
The results of the blood parameters are shown in Table 5. There was no significant decrease in blood measures over the 4 week period, except a drop in serum creatinine of 0.15 ± 0.21 mg/dl (a 5.8% decrease) over the 4 weeks (p=0.04). FGF23 level decreased by an average of 12% in the study period but this was not statistically significant. When either the outlier (Figure 3), or the patient who was non-compliant (Subject 7) were excluded, the drop was 30% but this still failed to reach significance. There were a total of 2 incidences of potassium of 5.8 meq/L, both of these measures were in the same subject, with a known type IV RTA, which required modifying the plant protein source from raw edamame (482mg of potassium/100g) the highest potassium content among all plant sources (National Database for Standard Reference (USDA Release 26) to fried tofu. To minimize the effect of diurnal variation, care was taken to draw blood at a similar time of day (mean within patient variability for blood draws was 91 ± 146 minutes).
Table 5. Effect of a 70% Plant Protein based Diet on Serum and Musculoskeletal Parameters.
| Baseline* | 2 weeks on Study Diet | 4 weeks on Study Diet | p | |
|---|---|---|---|---|
| Mean±SD or Median (25th, 75th percentile) | ||||
| Serum measures | ||||
| Serum P (mg/dl) | 3.7±0.6 | 3.5±0.5 | 3.6±0.5 | 0.29 |
| Serum PTH pg/ml | 131±74 | 119±73 | 130±86 | 0.49 |
| Serum Ca (mg/dl) | 9.2±0.4 | 9.2±0.4 | 9.3±0.3 | 0.92 |
| Serum FGF23 (RU/ml) | 131 (95,224) | 146 (99,189) | 114 (103,175) | 0.19 |
| Serum creatinine (mg/dl) | 2.57±0.78 | 2.5±0.72 | 2.41±0.74a | 0.04 |
| GFR(ml/min/1.73m2) | 26 (18,33) | 25 (20,36) | 25 (20,39) | 0.1 |
| Serum bicarbonate (meq/L) | 24 (23, 25) | 24 (23, 27) | 24 (23, 27) | 0.39 |
| Serum Potassium (meq/L) | 4.8± 0.5 | 4.5±0.6 | 4.5±0.4 | 0.79 |
| Musculoskeletal measures | ||||
| Hand grip strength (kg) | 33.3±13.3 | 32.8±13.5 | 32.9 ±12.5 | 0.93 |
| Fat free mass in kg (%) | 61.9(10.6) | 59.9(15.3) | 62.2(14.4) | 0.06 |
| Weight (kg) | 96.4±15.7 | 95.6±15.8 | 94.3±15.8a,b | 0.025 |
= average of 2 baseline collections done during pre-study period.
= significant when compared to baseline p<0.05.
=significant when compared to 2 week value p<0.05.
Repeated measures testing were used by one way ANOVA and Holm-Sidak method for pairwise comparisons for normally distributed data. For non-normal data, repeated measures testing was done using ANOVA on ranks, with Tukey testing for pairwise comparisons.
Figure 3.

Changes in FGF23 with diet in all subjects (A) and with outlier excluded (B). Each line represents one subject. The outlier excluded had a FGF23>500Ru/ml
Subjects experienced a weight loss of 0.8 ± 1.3 kg in the 4 weeks (Table 5, p = 0.025), although the free fat mass percentage or hand grip strength was not changed significantly. Blood pressure decreased in 8 subjects, though only 1 subject was able to reduce blood pressure medications. Mean diastolic blood pressures dropped from 78±12 pre-study to 72±8.6 mm of Hg (p=0.08) on study diet, while mean systolic blood pressures remained stable at 135±17 mm of Hg pre-study to 135 ±13 mm of Hg (p=0.9) on study diet. Insulin doses were reduced in 3 out of 4 diabetic subjects.
Discussion
The present study demonstrated the efficacy of changing from a 65% animal protein diet to a 70% plant protein diet in lowering urine phosphorus in subjects with stage 3-4 CKD. We observed a significant 28% reduction in urinary phosphorus excretion which was sustained over a period of 4 weeks. This reduction is less than the 46% decrease in urine phosphorus excretion on a 100% plant diet consumed for one week [11] however, it was less restrictive for patients and we would hypothesize that it would be easier to maintain. In this study we did not compare the utility of a plant based diet with phosphate binders, however the effect of a 70% plant protein diet on urine phosphorus excretion appears equivalent to that of phosphorus binders. In a randomized controlled trial of 148 patients with mean eGFR of 32 ml/min and normophosphatemia, similar to subjects in the present study, the effect of 5.9 g/d calcium acetate (1.5 g elemental calcium), 2.7 g/d lanthanum carbonate, and 6.3 g/d sevelamer carbonate was a 22% decrease in urine phosphorus excretion [17]. This high pill burden with administration of phosphorus binders is not well tolerated by most patients, and can lead to poor quality of life [18]. The diet was well tolerated and subjects indicated the diet was highly palatable and food choices were more varied than expected. The present study suggests that a 70% plant protein diet, allowing one meal per day that contains meat, approximately one serving of dairy per day, and an egg every other day would effectively lower urinary phosphorus excretion to the same magnitude as high dose phosphorus binders. A future randomized trial comparing plant based diets versus binders would be informative to guide clinical care.
The goal of reducing intestinal phosphorus absorption and therefore urinary excretion is to reduce the stimulus for a rise in FGF23 and/or PTH. Balance studies at this stage of CKD have demonstrated neutral phosphorus balance [19], but that neutrality is believed due to the compensatory response of the phosphaturic hormones FGF23 and PTH. In the previous short term cross over study using a 100% plant based diet, there was a significant reduction in FGF23 but no effect on PTH [11]. In contrast, in the present study despite elevated levels of FGF23 at baseline, we were unable to detect a significant decrease in these phosphaturic hormones, although there was a 12% non-significant reduction in FGF23. Studies have not consistently reported decreases in FGF23 and PTH with decreased phosphorus absorption in response to diet or binders. In the Chronic Renal Insufficiency Cohort [20], higher plant protein intake was associated with lower FGF23 levels (p=0.05). However a higher percent plant diet was not associated with decreased urine phosphorus excretion when adjusted for protein intake [21]. A randomized 2×2 factorial trial of 16 normophosphtemic CKD patients assigned to high and low phosphorus diets with and without lanthanum, showed large reductions in urine phosphorus excretion but no significant changes in blood levels of FGF23, PTH or phosphorus [22]. In the study of binders in normophosphatemic patients by Block et al, despite the 22% drop in urine phosphorus, overall FGF23 levels did not decline when comparing active treatment versus placebo [17]. However, the response of FGF23 did vary by binder type: a decrease was observed with sevelamer but an increase with calcium acetate and no change with Lanthanum [17]. In a smaller study of 40 CKD subjects with normal phosphorus levels that were randomized to binders, FGF23 and serum phosphorus decreased only in the sevalemer arm, though urine phosphorus excretion decreased in both calcium and sevalemer arms [23]. These studies emphasize the complexity of FGF23 regulation. Importantly, hypercalcemia or elevated calcium load, calcitriol, and PTH all stimulate FGF23 secretion [10, 24]. The role of dietary phosphorus on FGF23 may, in fact be indirect, and mediated by these factors [25] [26]. Further, serum phosphorus has a diurnal variation, with a nadir between 8-12 AM [11], as does PTH [27] [28], which could explain why we and others failed to detect a relationship with phosphorus intake, although in general labs were drawn at the same time for each patient. These inconsistent data indicate that FGF23 needs to be studied more conclusively in future studies.
CKD patients are advised to eat a low protein diet although studies directly testing the hypothesis of a protective effect demonstrate conflicting results [29]. One reason for this may be because protein source is as important as protein quantity due to the inherent differences in the phosphorus content and bioavailability of phosphorus in protein. There is also concern of adverse effects of protein restriction as protein is a key regulator of muscle metabolism, with protein malnutrition leading to sarcopenia or loss of skeletal muscle in patients with kidney disease [30]. CKD patients have more sarcopenia and frailty compared to those in the age-matched general population, with decreased skeletal muscle strength and walking speed [31]. To confirm no adverse consequences of the change in protein source in the present study, we evaluated hand grip strength, a validated measure of sarcopenia [32] and did not observe any decrement in serial assessments. Similarly, fat mass and total body water did not change. This suggests safety of this dietary approach although longer studies are needed. For example, a prior study of fruits and vegetables in advanced CKD showed an improvement in lean mass evaluated after 1 year [33].
There was a decrease in urinary creatinine excretion with the 70% protein from plants diet in the present study and a lower serum creatinine, however, calculated creatinine clearance was unchanged. The lack of an objective loss in skeletal muscle strength or in fat free mass percentage is reassuring and argues against muscle degradation as a cause of the decrease in serum creatinine or 24hr creatinine excretion. Cooked meat meals have been shown to increase the serum creatinine [34] and thus may explain these observations.
Similar to the Dietary Approaches to Stop Hypertension (DASH) diet with increased fruits and vegetables, limiting the quantity of meat and dairy protein in this diet had beneficial effects on acidosis. Urine ammonium excretion and the titratable acid in the urine decreased significantly by 4 weeks. We did not detect a significant change in serum bicarbonate but the values were normal at baseline, and the study was likely too short in duration to show a marked improvement. Similar to the DASH diet, there was also a marked decrease in urine sodium excretion and the majority of patients had a drop in their blood pressure, an added benefit of avoidance of processed foods. We explicitly avoided using processed foods that contained phosphorus based additives (the majority of which are sodium phosphate) as this is an unmeasurable and inconsistent phosphorus source.
Our study has several strengths. We used rigorously controlled study diets, multiple markers of compliance and frequent visits. We were able to analyze the results of following a “prepared” diet instead of a “prescribed” diet since we administered all the food and beverages eaten. The menu was very comprehensive and provided the recommended renal diet. Menu samples were ashed at the start of the study to ensure there were was relative good agreement between diet designed using nutritional databases and the actual phosphorus content, as dependence on nutritional databases for study design may underestimate actual phosphorus in foods up to 350mg/day [35]. We found good agreement, and the errors in nutritional database likely reflect phosphorus containing additives, which we purposely avoided in these menus. The use of such processed or prepared foods would likely contain different amount of phosphorus, as would plant based diets prepared in different seasons with grains from different regions. Whether such differences would alter urine phosphorus excretion or serum levels of FGF23 and PTH is not known. Finally, our study is limited by the small sample size, although the population was diverse and thus the results are likely generalizable.
Conclusion
The study demonstrated that converting from a predominant meat based diet to a diet composed of 70% protein from plants is efficacious in decreasing dietary phosphorus excretion, is palatable for patients and safe. One of the advantages of our study diet of 70% protein from plants was increased adherence by subjects who were predominant meat eaters at the start of the study. With administration of ready-to-eat food, there was near complete compliance. Longer studies are required to see if the benefits on mineral metabolism, blood pressure and acid excretion results in benefits in cardiovascular and musculoskeletal health and quality of life in CKD patients.
Acknowledgments
Dr.Moorthi was supported by the Norman Coplon grant from the Satellite Health Care Foundation for this project. Dr. Armstrong was supported by the Indiana Clinical and Translational Sciences Institute, funded in part by NIH RR02576. Dr. Moe is also supported by NIH AR058005 and a VA Merit Award. The authors thank Mary Chambers RN and Gail Douglas RN for helping with recruitment, Kalisha O'Neill for processing the blood samples, the ICRC nurses and staff, and the dedicated research subjects.
Footnotes
Conflicts of Interest: None of the authors declare any conflicts of interest.
References
- 1.Isakova T, Wahl P, Vargas GS, Gutierrez OM, Scialla J, Xie H, Appleby D, Nessel L, Bellovich K, Chen J, Hamm L, Gadegbeku C, Horwitz E, Townsend RR, Anderson CA, Lash JP, Hsu CY, Leonard MB, Wolf M. Fibroblast growth factor 23 is elevated before parathyroid hormone and phosphate in chronic kidney disease. Kidney Int. 2011;79(12):1370–1378. doi: 10.1038/ki.2011.47. [DOI] [PMC free article] [PubMed] [Google Scholar]
- 2.Yamamoto KT, Robinson-Cohen C, de Oliveira MC, Kostina A, Nettleton JA, Ix JH, Nguyen H, Eng J, Lima JA, Siscovick DS, Weiss NS, Kestenbaum B. Dietary phosphorus is associated with greater left ventricular mass. Kidney Int. 2013;83(4):707–714. doi: 10.1038/ki.2012.303. [DOI] [PMC free article] [PubMed] [Google Scholar]
- 3.Pinheiro MM, Schuch NJ, Genaro PS, Ciconelli RM, Ferraz MB, Martini LA. Nutrient intakes related to osteoporotic fractures in men and women--the Brazilian Osteoporosis Study (BRAZOS) Nutr J. 2009;8:6. doi: 10.1186/1475-2891-8-6. [DOI] [PMC free article] [PubMed] [Google Scholar]
- 4.Chang AR, Lazo M, Appel LJ, Gutierrez OM, Grams ME. High dietary phosphorus intake is associated with all-cause mortality: results from NHANES III. Am J Clin Nutr. 2014;99(2):320–327. doi: 10.3945/ajcn.113.073148. [DOI] [PMC free article] [PubMed] [Google Scholar]
- 5.Manjunath G, Tighiouart H, Coresh J, Macleod B, Salem DN, Griffith JL, Levey AS, Sarnak MJ. Level of kidney function as a risk factor for cardiovascular outcomes in the elderly. Kidney Int. 2003;63(3):1121–1129. doi: 10.1046/j.1523-1755.2003.00838.x. [DOI] [PubMed] [Google Scholar]
- 6.Muntner P, He J, Hamm L, Loria C, Whelton PK. Renal insufficiency and subsequent death resulting from cardiovascular disease in the United States. J Am Soc Nephrol. 2002;13(3):745–753. doi: 10.1681/ASN.V133745. [DOI] [PubMed] [Google Scholar]
- 7.Ensrud KE, Lui LY, Taylor BC, Ishani A, Shlipak MG, Stone KL, Cauley JA, Jamal SA, Antoniucci DM, Cummings SR. Renal function and risk of hip and vertebral fractures in older women. Arch Intern Med. 2007;167(2):133–139. doi: 10.1001/archinte.167.2.133. [DOI] [PubMed] [Google Scholar]
- 8.Nickolas TL, McMahon DJ, Shane E. Relationship between moderate to severe kidney disease and hip fracture in the United States. J Am Soc Nephrol. 2006;17(11):3223–3232. doi: 10.1681/ASN.2005111194. [DOI] [PubMed] [Google Scholar]
- 9.K/DOQI clinical practice guidelines for bone metabolism and disease in chronic kidney disease. Am J Kidney Dis. 2003;42(4 Suppl 3):S1–201. [PubMed] [Google Scholar]
- 10.Moe SM, Radcliffe JS, White KE, Gattone VH, 2nd, Seifert MF, Chen X, Aldridge B, Chen NX. The pathophysiology of early-stage chronic kidney disease-mineral bone disorder (CKD-MBD) and response to phosphate binders in the rat. J Bone Miner Res. 2011;26(11):2672–2681. doi: 10.1002/jbmr.485. [DOI] [PubMed] [Google Scholar]
- 11.Moe SM, Zidehsarai MP, Chambers MA, Jackman LA, Radcliffe JS, Trevino LL, Donahue SE, Asplin JR. Vegetarian compared with meat dietary protein source and phosphorus homeostasis in chronic kidney disease. Clin J Am Soc Nephrol. 2011;6(2):257–264. doi: 10.2215/CJN.05040610. [DOI] [PMC free article] [PubMed] [Google Scholar]
- 12.Lea E, Worsley A. Benefits and barriers to the consumption of a vegetarian diet in Australia. Public Health Nutr. 2003;6(5):505–511. doi: 10.1079/PHN2002452. [DOI] [PubMed] [Google Scholar]
- 13.Aubertin-Leheudre M, Adlercreutz H. Relationship between animal protein intake and muscle mass index in healthy women. Br J Nutr. 2009;102(12):1803–1810. doi: 10.1017/S0007114509991310. [DOI] [PubMed] [Google Scholar]
- 14.Lord C, Chaput JP, Aubertin-Leheudre M, Labonte M, Dionne IJ. Dietary animal protein intake: association with muscle mass index in older women. J Nutr Health Aging. 2007;11(5):383–387. [PubMed] [Google Scholar]
- 15.Dietary Reference Intakes for Energy, Carbohydrate, Fiber, Fat, Fatty Acids, Cholesterol, Protein, and Amino Acids (Macronutrients) Washington DC: National Research Council; 2005. [DOI] [PubMed] [Google Scholar]
- 16.Julious SA. Sample size of 12 per group rule of thumb for a pilot study. Pharmaceutical Statistics. Pharmaceutical Statistics. 2005;4:287–291. [Google Scholar]
- 17.Block GA, Wheeler DC, Persky MS, Kestenbaum B, Ketteler M, Spiegel DM, Allison MA, Asplin J, Smits G, Hoofnagle AN, Kooienga L, Thadhani R, Mannstadt M, Wolf M, Chertow GM. Effects of phosphate binders in moderate CKD. J Am Soc Nephrol. 2012;23(8):1407–1415. doi: 10.1681/ASN.2012030223. [DOI] [PMC free article] [PubMed] [Google Scholar]
- 18.Chiu YW, Teitelbaum I, Misra M, de Leon EM, Adzize T, Mehrotra R. Pill burden, adherence, hyperphosphatemia, and quality of life in maintenance dialysis patients. Clin J Am Soc Nephrol. 2009;4(6):1089–1096. doi: 10.2215/CJN.00290109. [DOI] [PMC free article] [PubMed] [Google Scholar]
- 19.Hill KM, Martin BR, Wastney ME, McCabe GP, Moe SM, Weaver CM, Peacock M. Oral calcium carbonate affects calcium but not phosphorus balance in stage 3-4 chronic kidney disease. Kidney Int. 2012 doi: 10.1038/ki.2012.403. [DOI] [PMC free article] [PubMed] [Google Scholar]
- 20.Smith GL, Austin C, Crichton C, Wray S. A review of the actions and control of intracellular pH in vascular smooth muscle. Cardiovascular Research. 1998;38(2):316–331. doi: 10.1016/s0008-6363(98)00020-0. [DOI] [PubMed] [Google Scholar]
- 21.Scialla JJ, Lau WL, Reilly MP, Isakova T, Yang HY, Crouthamel MH, Chavkin NW, Rahman M, Wahl P, Amaral AP, Hamano T, Master SR, Nessel L, Chai B, Xie D, Kallem RR, Chen J, Lash JP, Kusek JW, Budoff MJ, Giachelli CM, Wolf M Chronic Renal Insufficiency Cohort Study I. Fibroblast growth factor 23 is not associated with and does not induce arterial calcification. Kidney Int. 2013;83(6):1159–1168. doi: 10.1038/ki.2013.3. [DOI] [PMC free article] [PubMed] [Google Scholar]
- 22.Isakova T, Gutierrez OM, Smith K, Epstein M, Keating LK, Juppner H, Wolf M. Pilot study of dietary phosphorus restriction and phosphorus binders to target fibroblast growth factor 23 in patients with chronic kidney disease. Nephrol Dial Transplant. 2011;26(2):584–591. doi: 10.1093/ndt/gfq419. [DOI] [PMC free article] [PubMed] [Google Scholar]
- 23.Oliveira RB, Cancela AL, Graciolli FG, Dos Reis LM, Draibe SA, Cuppari L, Carvalho AB, Jorgetti V, Canziani ME, Moyses RM. Early control of PTH and FGF23 in normophosphatemic CKD patients: a new target in CKD-MBD therapy? Clin J Am Soc Nephrol. 2010;5(2):286–291. doi: 10.2215/CJN.05420709. [DOI] [PMC free article] [PubMed] [Google Scholar]
- 24.Lopez I, Rodriguez-Ortiz ME, Almaden Y, Guerrero F, de Oca AM, Pineda C, Shalhoub V, Rodriguez M, Aguilera-Tejero E. Direct and indirect effects of parathyroid hormone on circulating levels of fibroblast growth factor 23 in vivo. Kidney Int. 2011;80(5):475–482. doi: 10.1038/ki.2011.107. [DOI] [PubMed] [Google Scholar]
- 25.Rodriguez-Ortiz ME, Lopez I, Munoz-Castaneda JR, Martinez-Moreno JM, Ramirez AP, Pineda C, Canalejo A, Jaeger P, Aguilera-Tejero E, Rodriguez M, Felsenfeld A, Almaden Y. Calcium deficiency reduces circulating levels of FGF23. J Am Soc Nephrol. 2012;23(7):1190–1197. doi: 10.1681/ASN.2011101006. [DOI] [PMC free article] [PubMed] [Google Scholar]
- 26.Hu MC, Kuro-o M, Moe OW. Renal and extrarenal actions of Klotho. Semin Nephrol. 2013;33(2):118–129. doi: 10.1016/j.semnephrol.2012.12.013. [DOI] [PMC free article] [PubMed] [Google Scholar]
- 27.Jubiz W, Canterbury JM, Reiss E, Tyler FH. Circadian rhythm in serum parathyroid hormone concentration in human subjects: correlation with serum calcium, phosphate, albumin, and growth hormone levels. J Clin Invest. 1972;51(8):2040–2046. doi: 10.1172/JCI107010. [DOI] [PMC free article] [PubMed] [Google Scholar]
- 28.el-Hajj Fuleihan G, Klerman EB, Brown EN, Choe Y, Brown EM, Czeisler CA. The parathyroid hormone circadian rhythm is truly endogenous--a general clinical research center study. J Clin Endocrinol Metab. 1997;82(1):281–286. doi: 10.1210/jcem.82.1.3683. [DOI] [PubMed] [Google Scholar]
- 29.Levey AS, Adler S, Caggiula AW, England BK, Greene T, Hunsicker LG, Kusek JW, Rogers NL, Teschan PE. Effects of dietary protein restriction on the progression of advanced renal disease in the Modification of Diet in Renal Disease Study. Am J Kidney Dis. 1996;27(5):652–663. doi: 10.1016/s0272-6386(96)90099-2. [DOI] [PubMed] [Google Scholar]
- 30.Wang XH, Mitch WE. Mechanisms of muscle wasting in chronic kidney disease. Nat Rev Nephrol. 2014 doi: 10.1038/nrneph.2014.112. [DOI] [PMC free article] [PubMed] [Google Scholar]
- 31.Roshanravan B, Khatri M, Robinson-Cohen C, Levin G, Patel KV, de Boer IH, Seliger S, Ruzinski J, Himmelfarb J, Kestenbaum B. A prospective study of frailty in nephrology-referred patients with CKD. Am J Kidney Dis. 2012;60(6):912–921. doi: 10.1053/j.ajkd.2012.05.017. [DOI] [PMC free article] [PubMed] [Google Scholar]
- 32.Cruz-Jentoft AJ, Baeyens JP, Bauer JM, Boirie Y, Cederholm T, Landi F, Martin FC, Michel JP, Rolland Y, Schneider SM, Topinkova E, Vandewoude M, Zamboni M European Working Group on Sarcopenia in Older P. Sarcopenia: European consensus on definition and diagnosis: Report of the European Working Group on Sarcopenia in Older People. Age Ageing. 2010;39(4):412–423. doi: 10.1093/ageing/afq034. [DOI] [PMC free article] [PubMed] [Google Scholar]
- 33.Goraya N, Simoni J, Jo CH, Wesson DE. A comparison of treating metabolic acidosis in CKD stage 4 hypertensive kidney disease with fruits and vegetables or sodium bicarbonate. Clin J Am Soc Nephrol. 2013;8(3):371–381. doi: 10.2215/CJN.02430312. [DOI] [PMC free article] [PubMed] [Google Scholar]
- 34.Preiss DJ, Godber IM, Lamb EJ, Dalton RN, Gunn IR. The influence of a cooked-meat meal on estimated glomerular filtration rate. Ann Clin Biochem. 2007;44(Pt 1):35–42. doi: 10.1258/000456307779595995. [DOI] [PubMed] [Google Scholar]
- 35.Oenning LL, Vogel J, Calvo MS. Accuracy of methods estimating calcium and phosphorus intake in daily diets. J Am Diet Assoc. 1988;88(9):1076–1080. [PubMed] [Google Scholar]