Abstract
The Alzheimer’s Disease Neuroimaging Initiative (ADNI) recently implemented accelerated T1-weighted structural imaging to reduce scan times. Faster scans may reduce study costs and patient attrition by accommodating people who cannot tolerate long scan sessions. However, little is known about how scan acceleration affects the power to detect longitudinal brain change. Using tensor-based morphometry (TBM), no significant difference was detected in numerical summaries of atrophy rates from accelerated and nonaccelerated scans in subgroups of patients with Alzheimer’s disease, early or late mild cognitive impairment, or healthy controls over a 6 and 12-month scan interval. Whole-brain, voxel-wise mapping analyses revealed some apparent regional differences in 6-month atrophy rates when comparing all subjects irrespective of diagnosis (n=345). No such whole brain difference was detected for the 12-month scan interval (n=156). Effect sizes for structural brain changes were not detectably different in accelerated versus nonaccelerated data. Scan acceleration may influence brain measures, but has minimal effects on TBM-derived atrophy measures, at least over the 6- and 12-month intervals examined here.
Keywords: Alzheimer’s disease, MRI, scan acceleration, longitudinal, tensor-based morphometry, neuroimaging, biomarker, drug trial enrichment
1. Introduction
The Alzheimer’s Disease Neuroimaging Initiative (ADNI) is a large multi-site longitudinal study that aims to develop and evaluate reliable biomarkers to track and predict the progression of Alzheimer’s disease (AD) (Weiner et al., 2010; Weiner et al., 2012). As AD pathology develops, the rate of brain tissue loss – also known as brain atrophy – accelerates. Structural magnetic resonance imaging (MRI) is widely used to estimate brain atrophy rates and is used in some clinical treatment trials to track therapeutic effects in AD and MCI (Jack et al., 2003). Advances in MRI scan acquisition, such as parallel imaging (Deshmane et al., 2012), can speed up scanning protocols (Bammer et al., 2005; Krueger et al., 2012). However, the effects of accelerated scans on MRI derived estimates of brain change have not been well studied. These accelerated sequences reduce scan time, which may lower study costs and allow researchers and clinicians to collect imaging data from individuals unable to tolerate longer scanning sessions. For example, greater effect sizes might be achievable if faster scans are less affected by patient motion. On the other hand, shorter scans may have a reduced signal to noise ratio (SNR), which might inflate the error in estimating brain change. Conversely, head motion may be greater in longer scans, so it cannot be assumed that a longer scan necessarily has greater SNR.
For subjects recruited as part of the ADNI-2 study (an ongoing project following the first phase of ADNI), both accelerated and nonaccelerated structural images were acquired back-to-back in the same session (http://adni.loni.usc.edu/methods/documents/mri-protocols/). With the significant benefits expected from faster scans, it is crucial to determine whether or not longitudinal brain change measures are adversely affected by accelerated acquisition. Here we examined the correlation between brain changes computed from accelerated and nonaccelerated T1-weighted images, using tensor-based morphometry (TBM). We evaluated differences in measured atrophy rates and effect sizes for brain changes over 6- and 12-month intervals computed from accelerated versus nonaccelerated data. Any difference in power to detect brain change between sequences may inform future large-scale imaging studies on which MRI sequence parameters can best track change. We tested a two-tailed hypothesis that effect sizes for brain change might differ in the accelerated scans, as we did not want to assume which scan type would give the better effect size. To produce images with visually acceptable noise levels using the standard 8- or 12-channel head coils used in ADNI-2, the loss of SNR was partially compensated in the protocol design by a small increase in pixel area (see Table 2). This, in turn, slightly reduces spatial resolution.
Table 2.
Details for all scan protocols, which vary slightly by vendor.
| Scanner Vendor |
TE (ms) |
TR: short/long (ms) |
TI (ms) |
Flip Angle (degrees) |
Acquired Pixel Size: nonaccelerated/accelerated (mm) |
Slice Thickness (mm) |
|---|---|---|---|---|---|---|
| GE | 2.8-3.0 | 6.9-7.3/ min. | 400 | 11 | 1.016 × 1.016/ 1.055 × 1.055 |
1.20 |
| Philips | 3.0-3.1 | 6.7/2500 | 900 | 9 | 1.000 × 1.000/ 1.055 × 1.055 |
1.20 |
| Siemens | 2.9 | 7.0-7.1/ 2300 | 900 | 9 | 1.000 × 1.000 1.055 × 1.055 |
1.20 |
At the outset, we were aware that our conclusions would apply specifically to TBM and the types of scans and coils chosen for ADNI. But given the interest in this question, especially by interventional trials now being planned, and the lack of published data, we present this preliminary but thorough study.
2. Methods
Data used in preparing this article were obtained from the Alzheimer's Disease Neuroimaging Initiative database. In 2011, ADNI-2 began to recruit an additional group of subjects with Alzheimer’s Disease (AD), early mild cognitive impairment (EMCI), late mild cognitive impairment (LMCI), and healthy controls (CN). These subjects, and others carried forward from ADNI-1, were scanned with an updated neuroimaging protocol. ADNI-2 has been acquiring both accelerated and nonaccelerated 3 Tesla structural MRI data, whereas ADNI-1 only acquired nonaccelerated scans. Both scans were acquired in ADNI-2 as there was a need to evaluate any advantages or disadvantages that might be associated with each scan protocol before either of them was advocated or abandoned. For up-to-date information on ADNI protocols, see www.adni-info.org.
2.1. Image acquisition
Data from all ADNI-2 subjects with both an accelerated and nonaccelerated 3T sagittal T1-weighted scan acquired in the same scan session were downloaded on January 19, 2013, from the Laboratory of Neuro Imaging Image Data Archive (LONI-IDA; http://adni.loni.usc.edu). All data available on the LONI-IDA is evaluated by quality control group at the Mayo Clinic. Only scans that meet quality control standards are available for download. Only subjects with baseline and follow-up scans at 6 and 12 months were included (6-month: n=345, Age: 73.4 ± 7.3, 192M/153F; 12-month: n=156, Age: 74.2 ±7.4, 87M/69F). All longitudinal data not acquired on a consistent scanner model/manufacturer was excluded, to avoid confounding effects of scanner change on longitudinal analysis.
Each subject received an accelerated T1-weighted scan immediately after a nonaccelerated scan and without leaving the scanner. By vendor, General Electric (GE) scanners use IR_FSPGR sequences and Philips and Siemens use MP-RAGE sequences. For details on scan vendor and sequence for the study sample, see Tables 1 and 2. Accelerated scan times are shorter than nonaccelerated scans by ~4 minutes, or roughly 43% (nonaccelerated scan times range from 9:06-9:26 minutes and accelerated scans from 5:12-5:34 minutes). Detailed scan protocols for accelerated and nonaccelerated T1-weighted sequences by vendor type are online (http://adni.loni.usc.edu/methods/documents/mri-protocols/). All subjects in the ADNI study are assessed clinically and cognitively at the time of scan acquisition. Written informed consent was obtained from all participants before experimental procedures were performed with detailed subject exclusion and inclusion criteria to be found online (http://adni.loni.usc.edu/). The full dataset included 345 subjects at 6 months and 156 subjects at 12 months with diagnostic and demographic information outlined in Table 3.
Table 1.
Number of scans at 6 and 12 months (equal for accelerated and nonaccelerated) broken down by vendor sequence (nonaccelerated/accelerated) and by diagnosis. AD denotes Alzheimer’s disease, EMCI and LMCI denote early and late mild cognitive impairment, and CN denotes healthy controls.
| 6 Months | Diagnosis | ||||
|
Scanner Vendor
(accel/nonaccel sequence) |
AD | EMCI | LMCI | CN | Total |
| GE (IR_FSPGR/ASSET) | 7 | 15 | 12 | 27 | 61 |
| Philips (MPRAGE/SENSE) | 6 | 15 | 23 | 29 | 73 |
| Siemens (MPRAGE/GRAPPA) | 16 | 64 | 57 | 74 | 211 |
| Total | 29 | 94 | 92 | 130 | 345 |
| 12 Months | |||||
|
Scanner Vendor
(accel/nonaccel sequence) |
AD | EMCI | LMCI | CN | Total |
| GE (IR_FSPGR/ASSET) | 2 | 6 | 4 | 8 | 20 |
| Philips (MPRAGE/SENSE) | 3 | 8 | 11 | 15 | 37 |
| Siemens (MPRAGE/GRAPPA) | 8 | 33 | 23 | 35 | 99 |
| Total | 13 | 47 | 38 | 58 | 156 |
Table 3.
Average age (in years at time of scan) and sex of subjects with 6- and 12-month follow-up scans, broken down by diagnosis (Dx). Numbers in parentheses are the standard deviations.
| 6 Months | AD | EMCI | LMCI | CN | All Dx |
| Ave. age (years) | 77.2 (±8.6) | 71.5 (±7.5) | 72.8 (±7.6) | 74.3 (±6.1) | 73.4 (±7.3) |
| Male/Female | 20/9 | 51/43 | 53/39 | 68/62 | 192/153 |
| 12 Months | AD | EMCI | LMCI | CN | All Dx |
| Ave. age (years) | 76.2 (±10.6) | 71.2 (±7) | 74 (±8.2) | 76.2 (±5.3) | 74.2 (±7.4) |
| Male/Female | 11/2 | 25/22 | 20/18 | 31/27 | 87/69 |
2.2. TBM image analysis
Follow-up scans were linearly registered to baseline (screening) scans with a 9 parameter (9P) transformation driven by a mutual information based cost function (Collins et al., 1994) in order to correct for linear differences in head position and size. To account for global differences in brain scale across the study population, both scans were then aligned to ICBM space (Mazziotta et al., 2001) using the same 9P registration, taking care to apply interpolation only once and to handle each scan identically. Brain masks excluding skull were generated for screening and follow-up scans independently using a parameter free robust brain extraction tool (ROBEX) (Iglesias et al., 2011) and a joint mask was created to skull-strip both scans (i.e., remove all non-brain regions). A minimal deformation target (MDT) image was created from 40 randomly selected healthy elderly controls from the ADNI database. The MDT served as an unbiased average template and has been described previously (Hua et al., 2011; Hua et al., 2008).
TBM automatically identifies regional structural differences in sets of MR images as well as brain change over time in individuals or groups of subjects scanned longitudinally. A non-linear inverse-consistent elastic intensity-based registration algorithm was used to estimate volumetric tissue differences (relative volume change over time) at a voxel-wise level, based on the determinant of the Jacobian matrix of the deformation field, mapping the initial scan to the later one (Leow et al., 2005; Leow et al., 2007). Individual Jacobian maps showing tissue loss and ventricular/CSF expansion were then spatially normalized across all subjects by nonlinear alignment to the MDT allowing for statistical comparison. TBM processing is detailed in the following reference (Hua et al., 2013). Voxel-wise group average Jacobian maps showing the degree of atrophy over 6 and 12 months were created for all diagnostic groups (AD, EMCI, LMCI, CN) as well as together irrespective of diagnosis (All Dx).
2.3. Numerical Summaries
Numerical summaries describing the degree of brain atrophy/expansion in each subject were calculated from 3D “Jacobian” maps. Cumulative atrophy over 6 and 12 months was estimated in both a statistically-defined region-of-interest (ROI) as well as in an anatomically-defined ROI. In the statistically-defined ROI (stat-ROI), numerical summaries were computed based on voxels with significant rates of atrophy (p<0.00001) within the temporal lobe as determined from a non-overlapping training sample of subjects with AD over a 12-month period (20 AD subjects; Age at baseline: 74.8 ± 6.3 years: 7 men, 13 women). In the anatomically defined ROI (temporal-ROI), numerical summaries were derived from a temporal lobe mask based on an atlas. Methods to derive these numerical summaries have been described previously (Hua et al., 2011; Hua et al., 2013).
2.4. Whole brain analysis
To test for regional differences across the whole brain, we performed a paired two-sample Student’s t-test at every voxel in the brain, comparing volumetric tissue change in the group of subjects with both accelerated and nonaccelerated scans at 6 and 12 months. To avoid basing inferences on differences that would arise by chance when assessing a large number of voxels, a standard false discovery rate (FDR) correction was applied at the conventionally accepted level of 5% (q=0.05) (Benjamini et al., 1995). For voxels that were significantly different between scan types, voxel-wise average Jacobian values were calculated for each of the groups separately. Mean difference maps were computed by subtracting the nonaccelerated mean map from the accelerated mean maps. The mean difference map was projected on to clusters of voxels that passed FDR correction allowing for visual identification of which group had higher or lower mean Jacobian values (i.e., apparently faster or slower atrophy) for a given significant cluster.
2.5. Statistics and sample size analysis
Correlation coefficients and p-values from paired two-sample t-tests were calculated for numerical summaries. Power analysis was conducted at 6 and 12 months for each of the 4 diagnostic groups (AD, EMCI, LMCI, and CN). The sample size was estimated that would be required to detect a 25% reduction in the mean annual rate of atrophy with 80% power using a two-sided test with a standard significance level (α=0.05) for a hypothetical two-arm study, as defined by the ADNI Biostatistics Core. These sample sizes are referred to as “n80’s”, and are computed from the formula below, where n is the minimum sample size for each arm, σD is the standard deviation and β is the mean estimated change (Rosner, 1990).
Confidence intervals (95%) for each n80 estimate were computed from 10,000 bootstrapped samples (Hua et al., 2011). The n80’s are a useful heuristic to understand effect sizes for change measures, but have several well-known limitations (see Discussion in Hua et al., 2013). Although it may not make sense to compare the n80’s for different brain measures, where a 25% slowing may have different functional consequences for the patient (or none at all), it does make sense to compare them for accelerated versus non accelerated scans. Sample size estimates adjusted for normal aging were calculated to detect a 25% reduction in the mean annual rate of atrophy after subtracting the mean atrophy rate of controls from the mean atrophy rate of the diagnostic group of interest at 6 and 12 months. Pairwise comparisons of accelerated and nonaccelerated n80’s (both standard and age-adjusted) were computed from 10,000 bootstrapped samples with replacement.
3. Results
There were no obvious visual differences between raw accelerated and nonaccelerated T1-weighted scans, consistent with prior qualitative visual inspections of accelerated and nonaccelerated data (Krueger et al., 2012). Maps of average cumulative brain atrophy, derived from accelerated and nonaccelerated T1-weighted scans over a 6- and 12-month interval, were visually very similar in each diagnostic group and in the combined group. Figure 1 shows this visual similarity at 6 months. The mild ventricular expansion and mild lobar atrophy, especially in temporal lobes, is consistent with prior reports and matches the now well-known profile of atrophy in AD and MCI (Leow et al., 2009).
Figure 1.
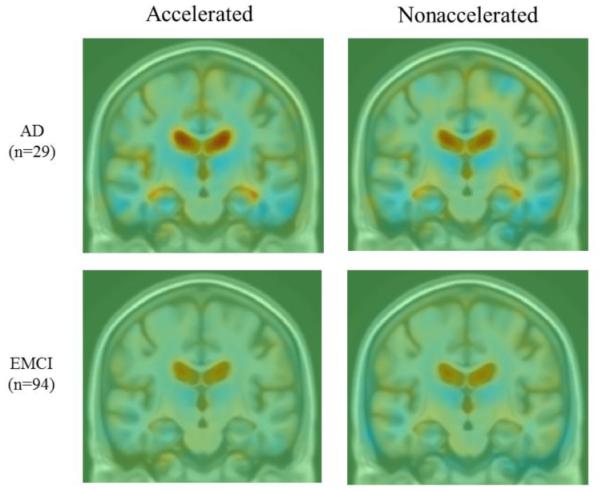
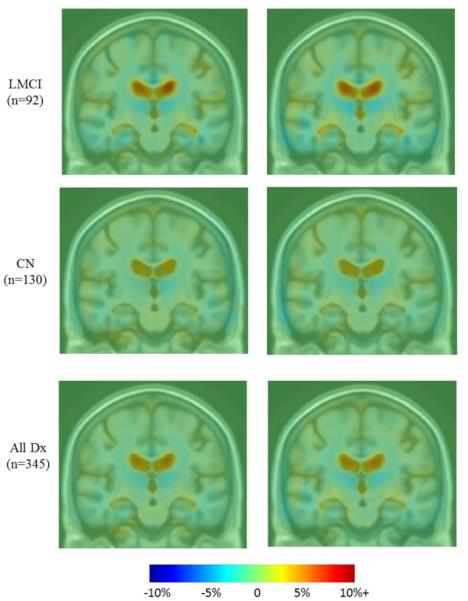
Average maps of cumulative brain atrophy over 6 months derived from all diagnostic groups separately (AD, EMCI, LMCI, CN) and together (all Dx) with both accelerated and nonaccelerated follow-up scans. Average patterns of brain atrophy computed from accelerated and nonaccelerated scans are highly similar. Color bar represents % tissue change at 6 months relative to baseline. Red indicates expansion (ventricles) and blue indicates contraction (temporal lobes).
Paired two-sample t-tests split by diagnosis and in the full sample detected no significant difference between numerical summaries derived with TBM from accelerated versus nonaccelerated scans (Table 4) at 6- and 12-month intervals, after correcting for multiple testing (Bonferroni corrected αlpha: 0.05/10=0.005).
Table 4.
Effects of MRI scan acceleration on changes detected at 6- and 12-month follow-up scan intervals: p-values from paired two-sample t-tests and correlation coefficients (r) comparing numerical summaries (% cumulative atrophy) from accelerated and nonaccelerated scans at each follow-up time-point. No difference was detected between scan types (all p>0.005), and, as expected, correlations (reported in the final column) were relatively high.
| All Dx Cumulative Atrophy |
t-test p-value 6-month/12-month |
Correlation r
6-month/12-month |
|---|---|---|
| Stat ROI | 0.2 / 0.02 | 0.71 / 0.81 |
| Temporal ROI | 0.78 / 0.11 | 0.65 / 0.71 |
| AD Cumulative Atrophy | ||
| Stat ROI | 0.32 / 0.57 | 0.72 / 0.89 |
| Temporal ROI | 0.54 / 0.5 | 0.46 / 0.69 |
| EMCI Cumulative Atrophy | ||
| Stat ROI | 0.49 / 0.08 | 0.68 / 0.84 |
| Temporal ROI | 0.38 / 0.43 | 0.68 / 0.78 |
| LMCI Cumulative Atrophy | ||
| Stat ROI | 0.75 / 0.32 | 0.71 / 0.81 |
| Temporal ROI | 0.81 / 0.77 | 0.63 / 0.76 |
| CN Cumulative Atrophy | ||
| Stat ROI | 0.19 / 0.08 | 0.63 / 0.62 |
| Temporal ROI | 0.7 / 0.08 | 0.69 / 0.58 |
Estimates of the mean tissue atrophy (as a percentage), its standard deviation, and n80 estimates for the two types of numerical summaries (stat-ROI and temporal-ROI) over 6 and 12 months are given in Tables 5 and 6. At the 6-month time interval, accelerated scans provided smaller n80’s for all numerical summaries except for the EMCI stat-ROI and the CN stat- and temporal-ROI. At 12 months, nonaccelerated scans provide smaller n80’s for all numerical summaries except for LMCI temporal-ROI. Even so, the percent tissue atrophy and n80 estimates did not differ significantly for accelerated versus nonaccelerated scans, as shown by the overlapping confidence intervals and direct comparison (see Table 8). As noted in prior work, the confidence interval on n80 tends to be wide, especially when the expected changes are small (e.g., over short scan interval or with normal diagnosis), even in a large sample.
Table 5.
6-month effect sizes for brain change. Mean % tissue atrophy over the interval, standard deviation (SD) of the atrophy (also in %), and n80 [with 95% confidence interval] for each of the two numerical summaries, and for both accelerated and nonaccelerated images across all 4 diagnostic groups (AD, EMCI, LMCI and CN). As expected, the change in the statistical ROI is higher than that detected in the overall temporal lobe ROI, as it focuses on voxels expected to change the most.
| AD |
Accel Stat ROI
p<0.00001 |
NonAccel Stat ROI
p<0.00001 |
Accel Temporal
ROI |
NonAccel Temporal
ROI |
| % Tissue Atrophy |
1.22 | 1.34 | 0.49 | 0.60 |
| SD | 0.79 | 0.94 | 0.58 | 0.85 |
| n80 [CI] | 104 [62, 214] | 123 [78, 209] | 355 [167, 1905] | 501 [219, 1994] |
| LMCI |
Accel Stat ROI
p<0.00001 |
NonAccel Stat ROI
p<0.00001 |
Accel Temporal
ROI |
NonAccel Temporal
ROI |
| % Tissue Atrophy |
0.86 | 0.84 | 0.32 | 0.30 |
| SD | 0.91 | 0.93 | 0.60 | 0.65 |
| n80 [CI] | 284 [178, 508] | 313 [192, 507] | 869 [472, 2294] | 1152 [546, 4159] |
| EMCI |
Accel Stat ROI
p<0.00001 |
NonAccel Stat ROI
p<0.00001 |
Accel Temporal
ROI |
NonAccel Temporal
ROI |
| % Tissue Atrophy |
0.39 | 0.43 | 0.20 | 0.11 |
| SD | 0.81 | 0.79 | 0.70 | 0.66 |
| n80 [CI] | 1123 [496, 6178] | 844 [466, 2188] | 3133 [1028, 51467] | 8717 [1700, 1364600] |
| CN |
Accel Stat ROI
p<0.00001 |
NonAccel Stat ROI
p<0.00001 |
Accel Temporal
ROI |
NonAccel Temporal
ROI |
| % Tissue Atrophy |
0.40 | 0.47 | 0.14 | 0.17 |
| SD | 0.76 | 0.78 | 0.61 | 0.68 |
| n80 [CI] | 915 [484, 2431] | 681 [379, 1549] | 4846 [1593, 76991] | 4138 [1440, 57015] |
Table 6.
12-month effect sizes for brain change. Mean % tissue atrophy over the interval, standard deviation (SD) of the atrophy (also in %), and n80 [with 95% confidence interval] for each of the two numerical summaries, and for both accelerated and nonaccelerated images across all 4 diagnostic groups (AD, EMCI, LMCI and CN). As expected, the change in the statistical ROI is higher than that detected in the overall temporal lobe ROI, as it focuses on voxels expected to change the most.
| AD |
Accel Stat ROI
p<0.00001 |
NonAccel Stat ROI
p<0.00001 |
Accel Temporal
ROI |
NonAccel Temporal
ROI |
| % Tissue Atrophy |
1.72 | 1.63 | 0.46 | 0.57 |
| SD | 1.20 | 0.99 | 0.78 | 0.65 |
| n80 [CI] | 123 [49, 445] | 92 [46, 216] | 710 [157, 40340] | 323 [107, 3117] |
| LMCI |
Accel Stat ROI
p<0.00001 |
NonAccel Stat ROI
p<0.00001 |
Accel Temporal
ROI |
NonAccel Temporal
ROI |
| % Tissue Atrophy |
1.29 | 1.41 | 0.45 | 0.43 |
| SD | 1.20 | 1.21 | 0.77 | 0.83 |
| n80 [CI] | 220 [119, 471] | 186 [104, 391] | 720 [305, 2896] | 951 [335, 11061] |
| EMCI |
Accel Stat ROI
p<0.00001 |
NonAccel Stat ROI
p<0.00001 |
Accel Temporal
ROI |
NonAccel Temporal
ROI |
| % Tissue Atrophy |
0.73 | 0.88 | 0.23 | 0.29 |
| SD | 0.94 | 1.06 | 0.72 | 0.81 |
| n80 [CI] | 420 [251, 892] | 366 [222, 715] | 2399 [630, 269830] | 1896 [543, 88109] |
| CN |
Accel Stat ROI
p<0.00001 |
NonAccel Stat ROI
p<0.00001 |
Accel Temporal
ROI |
NonAccel Temporal
ROI |
| % Tissue Atrophy |
0.59 | 0.74 | 0.09 | 0.22 |
| SD | 0.80 | 0.68 | 0.61 | 0.58 |
| n80 [CI] | 468 [223, 1542] | 217 [126, 576] | 11358 [1400, 6887100] | 1768 [614, 20580] |
Table 8.
P-values estimating differences between accelerated and nonacclerated n80 sample size requirements for both standard and age-adjusted estimates at 6 and 12-months. No difference was detected between scan types (all p>0.006).
| AD |
Accel vs. Nonaccel Stat
ROI |
Accel vs. Nonaccel
Temporal ROI |
| 6mo n80 standard/age-adjusted | 0.48 / 0.41 | 0.59 / 0.68 |
| 12mo n80 standard/age-adjusted | 0.46 / 0.78 | 0.1 / 0.7 |
| LMCI | Accel Stat ROI p<0.00001 | Accel Temporal ROI |
| 6mo n80 standard/age-adjusted | 0.71 / 0.19 | 0.43 / 0.23 |
| 12mo n80 standard/age-adjusted | 0.5 / 0.87 | 0.64 / 0.12 |
| EMCI | Accel Stat ROI p<0.00001 | Accel Temporal ROI |
| 6mo n80 standard/age-adjusted | 0.6 / 0.91 | 0.17 / 0.97 |
| 12mo n80 standard/age-adjusted | 0.61 / 0.89 | 0.72 / 0.5 |
| CN | Accel Stat ROI p<0.00001 | Accel Temporal ROI |
| 6mo n80 standard/age-adjusted | 0.35 / na | 0.78 / na |
| 12mo n80 standard/age-adjusted | 0.01 / na | 0.09 / na |
Sample size estimates adjusted for normal aging were computed that would be sufficient to detect a 25% reduction in the mean annual rate of atrophy after subtracting the mean atrophy rate in controls from the mean atrophy rate of the diagnostic group of interest. The subtraction of the control rate of atrophy leads to conservative (possibly overly conservative) sample size estimates, as it assumes that a treatment would have no effect on the rate of brain atrophy in controls. Depending on the treatment, this may or may not be a realistic assumption. Age-adjusted n80 sample size estimates are provided in Table 7. Age-adjusted n80’s are larger than the standard estimates, as expected. Accelerated scans provided smaller age-adjusted n80 estimates for all numerical summaries except at the 6-month EMCI statistical ROI and 12-month AD temporal ROI’s. However, the percent tissue atrophy and age-adjusted n80 estimates did not differ significantly for accelerated versus nonaccelerated scans, as shown by the overlapping confidence intervals (see Table 7) and direct comparison (see Table 8).
Table 7.
6- and 12-month accelerated and nonaccelerated n80 estimates [95% confidence interval] adjusted for normal aging (average CN atrophy) for statistical and temporal ROI numerical summaries across all 3 diagnostic groups (AD, EMCI, LMCI).
| AD | Accel Stat ROI p<0.00001 |
NonAccel Stat ROI
p<0.00001 |
Accel Temporal
ROI |
NonAccel Temporal
ROI |
| 6mo n80 [CI] | 229 [160, 568] | 293 [143, 366] | 692 [219, 2284] | 963 [398, 3881] |
| 12mo n80 [CI] | 282 [89, 697] | 306 [208, 489] | 1098 [263 32169] | 846 [229, 3369] |
| LMCI | Accel Stat ROI p<0.00001 |
NonAccel Stat ROI
p<0.00001 |
Accel Temporal ROI |
NonAccel Temporal
ROI |
| 6mo n80 [CI] | 983 [839, 2041] | 1669 [1147, 2026] | 2632 [1122, 8189] | 5912 [4866, 6006] |
| 12mo n80 [CI] | 745 [307, 1672] | 815 [356, 7263] | 1124 [473, 2958] | 3997 [836, 513617] |
| EMCI | Accel Stat ROI p<0.00001 |
NonAccel Stat ROI
p<0.00001 |
Accel Temporal
ROI |
NonAccel Temporal
ROI |
| 6mo n80 [CI] | 1076662 [76500, 1554330] | 81761 [3500, 1268210] | 33042 [2775, 2378708] | 33163 [11200, 2928600] |
| 12mo n80 [CI] | 11439 [2458, 63066] | 14417 [1450, 1992043] | 6433 [2338, 42350] | 29645 [910, 367920] |
Pairwise comparisons of accelerated/nonaccelerated n80 sample size estimates (standard and age-adjusted) detected no significant differences between accelerated and nonaccelerated n80 sample size estimates after correcting for multiple testing (Bonferroni corrected αlpha: 0.05/8=0.006) as shown in Table 8.
To better assess atrophy rates between the different scan types at 6 and 12 months, Figure 2 contains plots where for each subject the average of accelerated and nonaccelerated numerical summaries (representing average absolute tissue change, in %) is plotted versus the absolute difference between accelerated and nonaccelerated numerical summaries (%). All plots, except for the 6-month temporal-ROI, show a trend toward lower absolute difference between accelerated and nonaccelerated numerical summaries as absolute tissue change increases, though none was significant at p=0.05.
Figure 2.
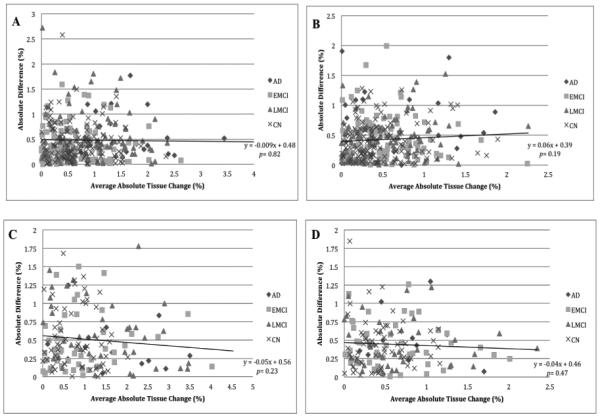
Plots of average absolute tissue change (%) vs. absolute difference (%) for accelerated and nonaccelerated numerical summaries. Each point represents a single subject where the average of the accelerated and nonaccelerated numerical summary (absolute tissue change %) is plotted along the x-axis, and the absolute difference between accelerated and nonaccelerated numerical summary (%) is plotted along the y-axis. The data are organized by diagnosis including linear trend lines with p-values for the entire sample. A: 6-month stat-ROI; B: 6-month temporal-ROI; C: 12-month stat-ROI; D: 12-month temporal-ROI.
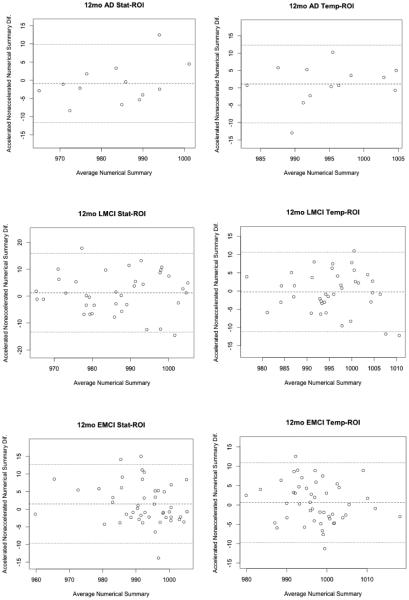
Bland-Altman plots (Altman and Bland, 1983) show agreement between numerical summaries derived from accelerated and nonaccelerated scans (Figure 3 and 4), and how they depend on the magnitude of the detected changes. There were a number of data points at 6 and 12 months with differences between accelerated and nonaccelerated numerical summaries lying outside ±1.96 standard deviations of the mean. Upon further analysis of these data with multiple linear regression, there were no significant factors (scanner vendor, head coil, study site, sex, age or diagnosis) that predicted the difference in accelerated and nonaccelerated numerical summaries.
Figure 3.
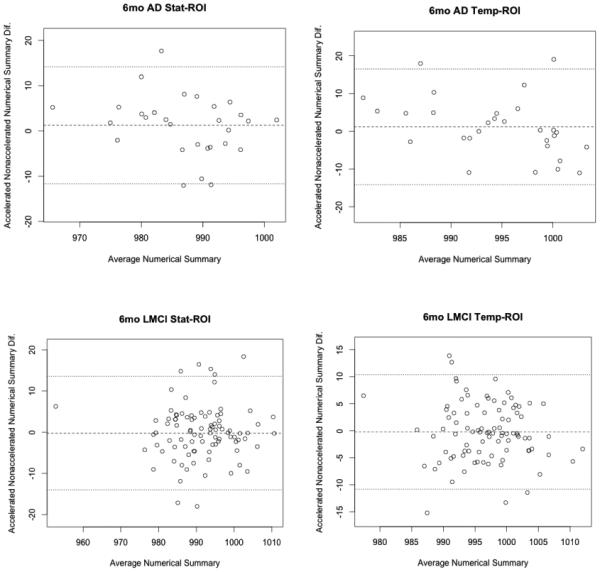
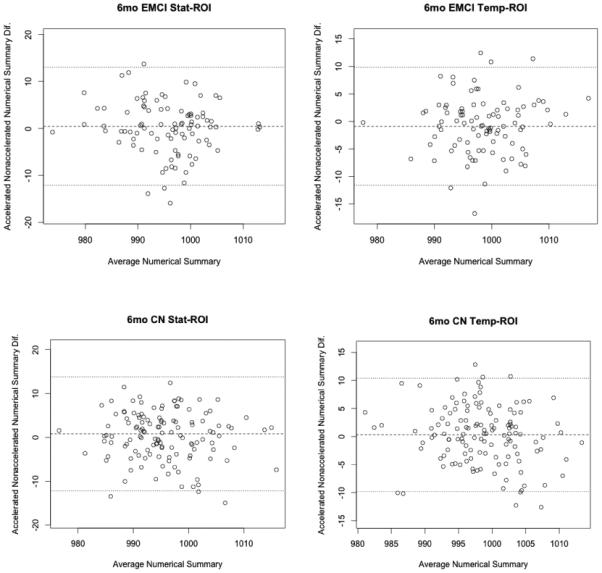
6-month Bland-Altman plots for both statistical and tempora -ROI numerical summary measures for each of the four diagnostic groups (AD, EMCI, LMCI, CN). Each point represents the mean of raw accelerated and nonaccelerated TBM-derived numerical summary value (x-axis) plotted against difference between those values. Mean of the accelerated-nonaccelerated numerical summary difference and ±1.96 standard deviation lines are provided. The scale is based on TBM-derived Jacobian values. These use arbitrary units where 1000 denotes no change and 990 denotes 1% loss of volume over the scan interval.
Figure 4.
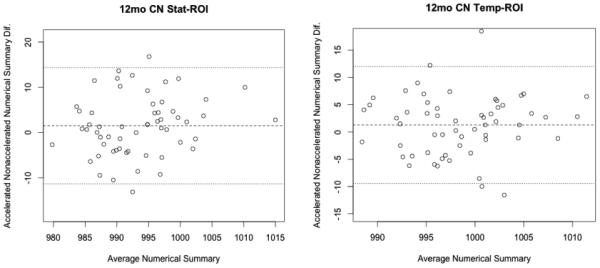
12-month Bland-Altman plots for both statistical and temporal ROI numerical summary measures for each of the four diagnostic groups (AD, EMCI, LMCI, CN). Each point represents the mean of raw accelerated and nonaccelerated TBM-derived numerical summary value (x-axis) plotted against difference between those values. Mean of the accelerated-nonaccelerated numerical summary difference and ±1.96 standard deviation lines are provided. The scale is based on TBM derived Jacobian values, which provide arbitrary units where 1000 denotes no change and 990 denotes 1% loss of volume over the scan interval.
To search for any differences across the entire brain, we performed a paired two-sample t-test at every voxel, comparing estimated rates of atrophy for the accelerated and nonaccelerated scans, using the 6- and 12-month TBM maps. There were no significant differences in regional brain atrophy measured between accelerated and nonaccelerated sequences at 6 months after applying an FDR correction at 5% (q=0.05) for any of the within-diagnosis comparisons. However, when combining all the diagnostic groups, some small differences were detected on a whole brain level that survived FDR correction. These differences are displayed in Figure 5. Some of the differences between accelerated and nonaccelerated scans were found in clusters of significant voxels in the thalamus as well as anterior limb of the interior and external capsule. These were driven by apparently greater tissue atrophy in the accelerated scans. Conversely, clusters of significant voxels including small portions of the putamen, lateral ventricles, cerebral peduncles and parietal lobe were driven by apparently greater tissue atrophy in the nonaccelerated scans.
Figure 5.
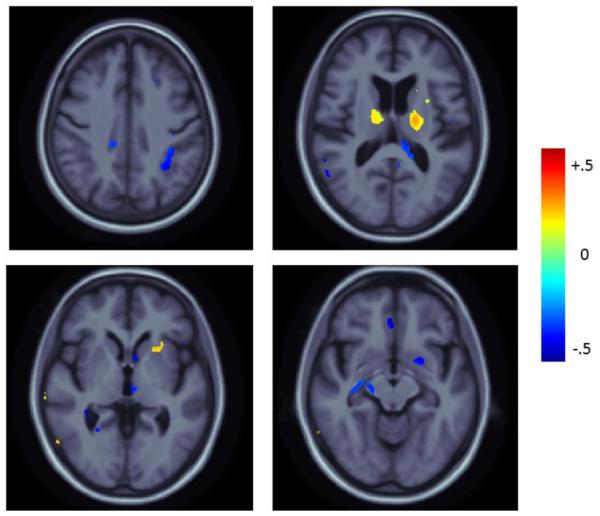
Mean difference maps displaying the percent difference in the mean atrophy rate of accelerated minus nonaccelerated scans for significant voxels (after FDR correction at 5%) in the full-group comparison over 6-month period relative to baseline. Positive values (blue) represent areas where the mean atrophy rate was higher in nonaccelerated scans. Negative values (red) represent areas where the mean atrophy rate was higher in accelerated scans.
There were no significant differences in regional brain atrophy measured between accelerated and nonaccelerated sequences at 12 months after applying an FDR correction at 5% (q=0.05) for any of the within diagnosis comparisons. Additionally, after combining all the diagnostic groups there were no significant differences detected between accelerated and nonaccelerated scans on a whole brain level at 12 months.
In addition to the whole brain test, and given the interest in temporal lobe change in AD, we wished to rule out any differences between accelerated and nonaccelerated TBM estimates of temporal lobe atrophy by conducting a comparison within a manually derived bilateral temporal lobe ROI. After applying a standard FDR correction at 5% (q=0.05), there were no significant differences between 6- or 12-month accelerated and nonaccelerated TBM estimates of brain change in the entire temporal lobe for any of the within diagnosis or combined diagnostic groups.
4. Discussion
Our study has three main findings. First, we detected no significant difference between numerical summaries of atrophy rates from accelerated and nonaccelerated scans within diagnosis at 6 and 12 months, using the TBM analysis method. Second, n80 measures (which arguably relate to sample size requirements for treatment trials) for all 6- and 12-month numerical summaries (standard and age-adjusted) were similar when derived from either accelerated or nonaccelerated images as shown by overlapping confidence intervals and direct pairwise comparison. Third, voxel-based comparisons found no differences between accelerated and nonaccelerated 6- or 12-month TBM estimates of brain change in the temporal lobes for any of the within diagnosis (AD, EMCI, LMCI or CN) or combined diagnosis groups. On a whole brain level, no significant differences were found within any diagnostic group for 6- or 12-month comparisons. The only difference on a whole brain level was found at 6 months when collapsing all the diagnostic groups into one cohort for comparison. The most plausible reason why the 6-month difference was not detected at 12 months is that the available sample size of scans at 12-month follow-up was smaller, making smaller differences hard to detect. Alternatively, there may be no consistently detectible differences, even in samples of over a hundred scans.
In the 6-month whole brain comparison, there were a number of cortical and subcortical regions with atrophy rates that were apparently different. Clusters of significant voxels in the thalamus, and the anterior limb of the interior and external capsule, were driven by apparently greater tissue atrophy in the accelerated scans. Conversely, clusters of significant voxels including small portions of the putamen, lateral ventricles, cerebral peduncles and parietal lobe were driven by apparently greater tissue atrophy in the nonaccelerated scans. There was no clearly evident systematic pattern indicative of bias in tracking brain change for either accelerated or nonaccelerated images. There was no uniform order in terms of significant clusters being associated with tissue atrophy in accelerated or nonaccelerated scans. The differences found at 6 months may be due to a combination of factors including the poorer signal to noise for accelerated scans and reduced TBM derived signal (brain atrophy/expansion estimates) to noise over very short scan intervals. As no whole brain differences were detected at 12 months, we conclude that there may not be consistent differences between scan types for detecting longitudinal brain change in this particular elderly population, at longer scan intervals, and using this method.
Overlapping confidence intervals as well as direct comparisons between accelerated and nonacclerated n80’s (standard and age-adjusted) detected no significant difference between TBM-derived accelerated and nonaccelerated sample size estimates. Correlation coefficients between accelerated and nonaccelerated numerical summaries ranged from 0.46-0.89. Unfortunately, due to the lack of test-retest data in this sample (i.e. people scanned twice at the same timepoints), we were not able to determine what an acceptable correlation might be for TBM derived numerical summaries in back-to-back sequences of the same kind. Figure 2 demonstrates that in general, the 6-month temporal-ROI withstanding, there was a trend toward lower absolute difference between accelerated and nonaccelerated numerical summaries as absolute tissue change increased. Bland-Altman plots for accelerated and nonaccelerated numerical summaries at 6 and 12 months and across all four diagnostic groups studied revealed a minority of subjects with differences between accelerated and nonaccelerated numerical summaries lying outside ±1.96 standard deviations of the mean. There were no significant factors (scanner vendor, head coil, study site, sex, age or diagnosis) that predicted this difference in accelerated and nonaccelerated numerical summaries.
Although we found no large difference in statistical power to detect brain change from accelerated and nonaccelerated scans at 6 and 12 months, we consider this to be a preliminary finding. Unfortunately, many studies lack the advantage of the larger sample sizes found in ADNI, so differences between accelerated and nonaccelerated derived brain change may not be found in smaller samples. To this point, our comparison of accelerated and nonaccelerated scans at the 12-month interval, while better powered to detect a structural change (as more brain change is expected over longer intervals), has less power to detect a protocol effect as fewer scans were available (6-month N=345 compared to 12-month N=156). The possibility remains that at a larger sample and/or a longer follow-up interval, we may be able to pick up a difference between scan types.
One limitation of the current analysis is that we were not able to further investigate how the type of head coil or the number and distribution of coils might affect the quality of the acceleration data. This may be important to consider within scanner vendor type, and with different vendors implementing different versions of acceleration. The ADNI database does not specifically record what type of head coil used in all of the scans. Even so, coils are given a code, which we used as a covariate in our multiple linear regressions, and it did not account for a significant proportion of the variation in the data.
Our study used only one MRI analysis technique, so these results may not generalize to other MRI analysis methods, which may be more sensitive to true or artifactual differences in scans, or may rely upon different aspects of the signal in the scan. Validation with other MRI analysis tools, such as methods used for cortical and subcortical segmentation, should be considered. Further study is needed before long-term changes are made to future MRI acquisition protocols, as some analysis techniques may be more sensitive to differences between accelerated and nonaccelerated sequences. Analyses are planned that use a larger reference dataset and multiple types of analyses at multiple sites. As such analyses take longer to complete, we are reporting this data now while cautioning that more comprehensive studies are needed. Of course even a study using more methods would never fully address whether acceleration affected analyses not included, or data from other kinds of scanners or coil types. When more scans become available in the ADNI database, similar analyses at even longer time intervals (beyond 1 year) will be useful in determining whether or not scan acceleration leads to apparent differences when the true change between scans is greater.
A preliminary (unpublished) report, presented at a past ADNI MRI Core Steering Committee Meeting (Jack et al., ADNI Steering Committee Meeting New Orleans, April 2012), found a difference between accelerated and nonaccelerated 3T MRI scans in a small sample of EMCI subjects from the ADNI cohort. A significant difference was found between cross sectional accelerated and nonaccelerated groups in whole brain volume, with around 1% lower brain volume measurements at baseline in accelerated scans. Using another popular imaging analysis technique called the brain boundary shift integral (Freeborough et al., 1997), a group of researchers found a “near significant” difference in longitudinal measures of whole brain atrophy in a small sample of subjects over a 12-month period with nonaccelerated scans generating more change (% of baseline) than accelerated scans (Jack et al., 2012).
A recent report described the use of a newer 32-channel head coil, which has higher SNR and obviates the need to sacrifice any spatial resolution to produce visually-acceptable accelerated image sets (Krueger et al., 2012). While differing in regard to the methods, specifically the use of 12- and 32-channel head coils as opposed to the 8- and 12-channel coils used in ADNI-2, as well the use of composite width and boundary shift integral as the primary quantitative measurement as opposed to our TBM method, Krueger et al. and our own findings support the claim that accelerated imaging provides high quality data to track structural brain change. Although our study is largely but not exclusively negative, it would be remiss not to report it, as there is so little information available on effects of scan acceleration for those designing MRI protocols. Interventional trials that are currently in later planning stages are in great need of large scale empirical information on scan acceleration, as we provide in this study. Decisions about scan acceleration are a serious concern for drug trial and epidemiological studies, as total scan time may affect subject attrition and determines the time available for other scans assessing functional connectivity, blood flow, and more.
Acknowledgments
Algorithm development and image analysis for this study was funded, in part, by grants to PT from the NIBIB (R01 EB008281, R01 EB008432) and by the NIA, NIBIB, NIMH, the National Library of Medicine, and the National Center for Research Resources (AG016570, AG040060, EB01651, MH097268, LM05639, RR019771 to PT). Data collection and sharing for this project was funded by ADNI (NIH Grant U01 AG024904). ADNI is funded by the National Institute on Aging, the National Institute of Biomedical Imaging and Bioengineering, and through contributions from the following: Abbott; Alzheimer's Association; Alzheimer's Drug Discovery Foundation; Amorfix Life Sciences Ltd.; AstraZeneca; Bayer HealthCare; BioClinica, Inc.; Biogen Idec Inc.; Bristol-Myers Squibb Company; Eisai Inc.; Elan Pharmaceuticals Inc.; Eli Lilly and Company; F. Hoffmann-La Roche Ltd and its affiliated company Genentech, Inc.; GE Healthcare; Innogenetics, N.V.; IXICO Ltd.; Janssen Alzheimer Immunotherapy Research & Development, LLC.; Johnson & Johnson Pharmaceutical Research & Development LLC.; Medpace, Inc.; Merck & Co., Inc.; Meso Scale Diagnostics, LLC.; Novartis Pharmaceuticals Corporation; Pfizer Inc.; Servier; Synarc Inc.; and Takeda Pharmaceutical Company. The Canadian Institutes of Health Research is providing funds to support ADNI clinical sites in Canada. Private sector contributions are facilitated by the Foundation for the National Institutes of Health. The grantee organization is the Northern California Institute for Research and Education, and the study is coordinated by the Alzheimer's Disease Cooperative Study at the University of California, San Diego. ADNI data are disseminated by the Laboratory for Neuro Imaging at the University of Southern California. This research was also supported by NIH grants P30 AG010129 and K01 AG030514 from the National Institute of General Medical Sciences. Investigators within ADNI contributed to the design and implementation of ADNI and/or provided data but many of them did not participate in analysis or writing of this report. For a complete listing of ADNI investigators, please see: http://adni.loni.usc.edu/wp-content/uploads/how_to_apply/ADNI_Acknowledgement_List.pdf CRKC was partially funded by The UCLA Neuroimaging Training Program Fellowship, National Institutes of Health, grant numbers R90 DA022768 and T90 DA023422 (UCLA, 2012).
Footnotes
Disclosure statement for authors:
One of the authors, Dr. Michael Weiner, has received private funding unrelated to the content of this paper.
All other authors have no potential financial or personal conflicts of interest including relationships with other people or organization within three years of beginning the work submitted that could inappropriately influence their work.
References
- Altman DG, Bland JM. Measurement in Medicine – The Analysis of Method Comarison Studies. Statistician. 1987;32(3):307–317. doi:10.2307/2987937. [Google Scholar]
- Bammer R, Skare S, Newbould R, Liu C, Thijs V, Ropele S, Clayton DB, Krueger G, Moseley ME, Glover GH. Foundations of advanced magnetic resonance imaging. NeuroRx. 2005;2(2):167–96. doi: 10.1602/neurorx.2.2.167. doi:10.1602/neurorx.2.2.167. [DOI] [PMC free article] [PubMed] [Google Scholar]
- Benjamini Y, Hochberg Y. Controlling the False Discovery Rate: a Practical and Powerful Approach to Multiple Testing. Journal of the Royal Statistical Society. 1995;57(1):289–300. [Google Scholar]
- Collins DL, Neelin P, Peters TM, Evans AC. Automatic 3D intersubject registration of MR volumetric data in standardized Talairach space. J Comput Assist Tomogr. 1994;18(2):192–205. [PubMed] [Google Scholar]
- Deshmane A, Gulani V, Griswold MA, Seiberlich N. Parallel MR imaging. J Magn Reson Imaging. 2012;36(1):55–72. doi: 10.1002/jmri.23639. doi:10.1002/jmri.23639. [DOI] [PMC free article] [PubMed] [Google Scholar]
- Freeborough PA, Fox NC. The boundary shift integral: an accurate and robust measure of cerebral volume changes from registered repeat MRI. IEEE Trans Med Imaging. 1997;16(5):623–9. doi: 10.1109/42.640753. doi:10.1109/42.640753. [DOI] [PubMed] [Google Scholar]
- The Alzheimer's Disease Neuroimaging Initiative. http://adni.loni.usc.edu/
- ADNI MRI Imaging Protocols. http://adni.loni.usc.edu/methods/documents/mri-protocols/
- Laboratory of Neuro Imaging Image Data Archive. https://ida.loni.usc.edu.
- Hua X, Gutman B, Boyle CP, Rajagopalan P, Leow AD, Yanovsky I, Kumar AR, Toga AW, Jack CR, Jr., Schuff N, Alexander GE, Chen K, Reiman EM, Weiner MW, Thompson PM. Accurate measurement of brain changes in longitudinal MRI scans using tensor-based morphometry. NeuroImage. 2011;57(1):5–14. doi: 10.1016/j.neuroimage.2011.01.079. doi:S1053-8119(11)00132-7 [pii] 10.1016/j.neuroimage.2011.01.079. [DOI] [PMC free article] [PubMed] [Google Scholar]
- Hua X, Hibar DP, Ching CR, Boyle CP, Rajagopalan P, Gutman BA, Leow AD, Toga AW, Jack CR, Jr., Harvey D, Weiner MW, Thompson PM. Unbiased tensor-based morphometry: improved robustness and sample size estimates for Alzheimer's disease clinical trials. NeuroImage. 2013;66:648–61. doi: 10.1016/j.neuroimage.2012.10.086. doi:10.1016/j.neuroimage.2012.10.086 S1053-8119(12)01090-7 [pii]. [DOI] [PMC free article] [PubMed] [Google Scholar]
- Hua X, Leow AD, Lee S, Klunder AD, Toga AW, Lepore N, Chou YY, Brun C, Chiang MC, Barysheva M, Jack CR, Jr., Bernstein MA, Britson PJ, Ward CP, Whitwell JL, Borowski B, Fleisher AS, Fox NC, Boyes RG, Barnes J, Harvey D, Kornak J, Schuff N, Boreta L, Alexander GE, Weiner MW, Thompson PM. 3D characterization of brain atrophy in Alzheimer's disease and mild cognitive impairment using tensor-based morphometry. NeuroImage. 2008;41(1):19–34. doi: 10.1016/j.neuroimage.2008.02.010. Alzheimer's Disease Neuroimaging, I. doi:S1053-8119(08)00137-7 [pii] 10.1016/j.neuroimage.2008.02.010. [DOI] [PMC free article] [PubMed] [Google Scholar]
- Iglesias JE, Liu CY, Thompson PM, Tu Z. Robust brain extraction across datasets and comparison with publicly available methods. IEEE Trans Med Imaging. 2011;30(9):1617–34. doi: 10.1109/TMI.2011.2138152. doi:10.1109/TMI.2011.2138152. [DOI] [PubMed] [Google Scholar]
- Jack C, Borowski B, Bernstein M, Gunter J, Jones D, Kantarci K, Reyes D, Senjem M, Vemuri P, Ward C, DeCarli C, Fox N, Schuff N, Thompson P. ADNI MRI Core Steering Committee Meeting; New Orleans. 2012. http://www.adni-info.org/scientists/Meetings/ADNISteeringCommitteeMeetings.aspx. [Google Scholar]
- Jack CR, Slomkowski M, Gracon S, Hoover TM, Felmlee JP, Stewart K, Xu Y, Shiung M, O'Brien PC, Cha R, Knopman D, Petersen RC. MRI as a biomarker of disease progression in a therapeutic trial of milameline for AD. Neurology. 2003;60(2):253–60. doi: 10.1212/01.wnl.0000042480.86872.03. [DOI] [PMC free article] [PubMed] [Google Scholar]
- Krueger G, Granziera C, Jack CR, Jr., Gunter JL, Littmann A, Mortamet B, Kannengiesser S, Sorensen AG, Ward CP, Reyes DA, Britson PJ, Fischer H, Bernstein MA. Effects of MRI scan acceleration on brain volume measurement consistency. J Magn Reson Imaging. 2012;36(5):1234–40. doi: 10.1002/jmri.23694. doi:10.1002/jmri.23694. [DOI] [PMC free article] [PubMed] [Google Scholar]
- Leow A, Huang SC, Geng A, Becker J, Davis S, Toga A, Thompson P. Inverse consistent mapping in 3D deformable image registration: its construction and statistical properties. Inf Process Med Imaging. 2005;19:493–503. doi: 10.1007/11505730_41. [DOI] [PubMed] [Google Scholar]
- Leow AD, Yanovsky I, Chiang MC, Lee AD, Klunder AD, Lu A, Becker JT, Davis SW, Toga AW, Thompson PM. Statistical properties of Jacobian maps and the realization of unbiased large-deformation nonlinear image registration. IEEE Trans Med Imaging. 2007;26(6):822–32. doi: 10.1109/TMI.2007.892646. doi:10.1109/TMI.2007.892646. [DOI] [PubMed] [Google Scholar]
- Leow AD, Yanovsky I, Parikshak N, Hua X, Lee S, Toga AW, Jack CR, Jr., Bernstein MA, Britson PJ, Gunter JL, Ward CP, Borowski B, Shaw LM, Trojanowski JQ, Fleisher AS, Harvey D, Kornak J, Schuff N, Alexander GE, Weiner MW, Thompson PM. Alzheimer's disease neuroimaging initiative: a one-year follow up study using tensor-based morphometry correlating degenerative rates, biomarkers and cognition. NeuroImage. 2009;45(3):645–55. doi: 10.1016/j.neuroimage.2009.01.004. [DOI] [PMC free article] [PubMed] [Google Scholar]
- Mazziotta J, Toga A, Evans A, Fox P, Lancaster J, Zilles K, Woods R, Paus T, Simpson G, Pike B, Holmes C, Collins L, Thompson P, MacDonald D, Iacoboni M, Schormann T, Amunts K, Palomero-Gallagher N, Geyer S, Parsons L, Narr K, Kabani N, Le Goualher G, Boomsma D, Cannon T, Kawashima R, Mazoyer B. A probabilistic atlas and reference system for the human brain: International Consortium for Brain Mapping (ICBM) Philos Trans R Soc Lond B Biol Sci. 2001;356(1412):1293–322. doi: 10.1098/rstb.2001.0915. doi:10.1098/rstb.2001.0915. [DOI] [PMC free article] [PubMed] [Google Scholar]
- Rosner B. Fundamentals of biostatistics. 3rd PWS-Kent Pub. Co.; Boston, Mass: 1990. [Google Scholar]
- Weiner MW, Aisen PS, Jack CR, Jr., Jagust WJ, Trojanowski JQ, Shaw L, Saykin AJ, Morris JC, Cairns N, Beckett LA, Toga A, Green R, Walter S, Soares H, Snyder P, Siemers E, Potter W, Cole PE, Schmidt M. The Alzheimer's disease neuroimaging initiative: progress report and future plans. Alzheimers Dement. 2010;6(3):202–11 e7. doi: 10.1016/j.jalz.2010.03.007. doi:10.1016/j.jalz.2010.03.007 S1552-5260(10)00067-1 [pii] [DOI] [PMC free article] [PubMed] [Google Scholar]
- Weiner MW, Veitch DP, Aisen PS, Beckett LA, Cairns NJ, Green RC, Harvey D, Jack CR, Jagust W, Liu E, Morris JC, Petersen RC, Saykin AJ, Schmidt ME, Shaw L, Siuciak JA, Soares H, Toga AW, Trojanowski JQ. The Alzheimer's Disease Neuroimaging Initiative: a review of papers published since its inception. Alzheimers Dement. 2012;8(1 Suppl):S1–68. doi: 10.1016/j.jalz.2011.09.172. doi:10.1016/j.jalz.2011.09.172 S1552-5260(11)02891-3 [pii]. [DOI] [PMC free article] [PubMed] [Google Scholar]


