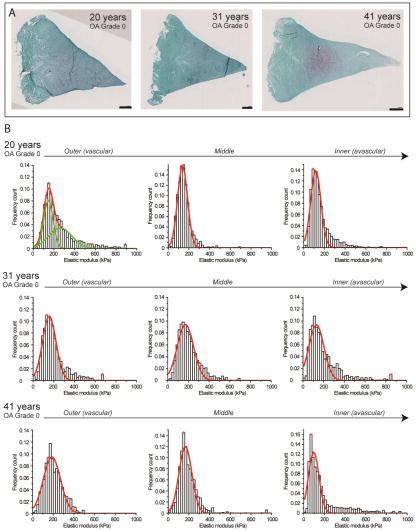
Figure 2.
Nanomechanical properties of ECM of healthy normal human meniscal tissue with OA grade 0–1. (A) Histological overview of the samples shows minimal Safranin-O staining (in purple) indicating young, normal meniscal tissue. Scale bar = 1 mm. (B) Corresponding stiffness distributions with a multi-peak Gaussian curve fit (in red and green) reveals sharp distinct peaks within each region, representing regional differences across the tissue: outer and middle (peak values from 130 to 150 kPa) and inner region (peak values from 70 to 90 kPa).

