

Abstract
Tourette syndrome (TS) is a neurodevelopmental disorder characterized by the occurrence of motor and vocal tics. TS has been linked to the impaired operation of cortical-striatal-thalamic-cortical circuits that give rise to hyper-excitability of cortical motor areas, which may be exacerbated by dysfunctional intra-cortical inhibitory mechanisms. That said, many individuals gain control over their tics during adolescence and it has been suggested that this increased control arises as a result of the development of mechanisms that operate to suppress corticospinal excitability (CSE) ahead of volitional movements. Here we used single-pulse transcranial magnetic stimulation (TMS) in conjunction with a manual Go/NoGo task to investigate alterations in CSE ahead of volitional movements in a group of adolescents with TS (N = 10). Our study demonstrated that CSE, as measured by TMS-induced motor-evoked potentials (MEPs), was significantly reduced in the TS group in the period immediately preceding a finger movement. More specifically, we show that individuals with TS, unlike their age-matched controls, do not exhibit the predicted increase in mean MEP amplitude and decrease in MEP variability that immediately precede the execution of volitional movements in typically developing young adults. Finally, we report that the magnitude of the rise in MEP amplitude across the movement preparation period in TS is significantly negatively correlated with clinical measures of motor tic severity, suggesting that individuals with severe motor tics are least able to modulate motor cortical excitability.
Tourette syndrome (TS) is a developmental neurological disorder that lies at the extreme of the tic disorder spectrum and is characterized by the presence of chronic vocal and motor tics (Leckman, 2002). Tics are involuntary, repetitive, stereotyped behaviours that occur with a limited duration. Tics occur in bouts, typically many times in a single day, and are the most common form of movement disorder in children.
The neurological basis for TS is currently unclear; however, it is generally accepted that the basal ganglia, including neural circuits that link the striatum and frontal lobes, are dysfunctional (Albin & Mink, 2006). More specifically it is argued that an impairment in the normal operation of basal ganglia-thalamic-cortical circuits gives rise to hyper-excitability of cortical motor areas in TS that may be exacerbated by dysfunctional intra-cortical inhibitory mechanisms (Gilbert, Sallee, Zhang, Lipps, & Wassermann, 2005; Gilbert et al., 2004; Heise et al., 2010; Moll et al., 1999, 2001; Orth, Munchau, & Rothwell, 2008; Ziemann, Paulus, & Rothenberger, 1997).
Individuals with TS perceive a relatively constant demand to suppress their tics in social situations and while the voluntary suppression of tics is possible in many cases, those with TS report that it can be uncomfortable to suppress tics and that the urge to tic becomes uncontrollable after a period of suppression. Despite evidence for increased cortical excitability in TS, it seems clear that many individuals with TS do in fact gain control over their tics by early adulthood. Thus, TS is often observed to follow a developmental time course in which there is increasing control over tics by late adolescence (Leckman, 2002). Furthermore, recent laboratory studies of cognitive control over motor outputs in situations with high response–conflict demand have shown that adolescents with ‘uncomplicated’ TS (i.e., those without co-morbid disorders such as attention deficit hyperactivity disorder [ADHD]) exhibit paradoxically enhanced volitional control over their motor behaviour relative to age-matched typically developing individuals (Jackson, Mueller, Hambleton, & Hollis, 2007; Jackson et al., 2011; Jung, Jackson, Parkinson, & Jackson, 2013; Mueller, Jackson, Dhalla, Datsopoulos, & Hollis, 2006), which appears to be accompanied by compensatory, neuroplastic, alterations in brain structure and function (Jackson et al., 2011; Jung et al., 2013; Plessen, Bansal, & Peterson, 2009). This finding is consistent with the proposal that the frequent need to actively suppress tics leads to a generalized enhancement in the efficacy of volitional control mechanisms in TS that extends to laboratory tasks of cognitive control of motor output (Jackson et al., 2007; Mueller et al., 2006) and leads to compensatory alterations in brain structure and function (Jackson et al., 2011; Jung et al., 2013).
Enhanced control over volitional motor outputs might arise as a result of altered long-range patterns of cortical connectivity in TS and it has been proposed that individuals with TS gain control over their tics through the development of compensatory self-regulation mechanisms: most likely implemented through changes in neural pathways linking the frontal cortex with primary and secondary motor regions (e.g., Jackson et al., 2011; Neuner et al., 2010; Plessen et al., 2004; Serrien, Orth, Evans, Lees, & Brown, 2005). It is also possible that altered patterns of volitional control are associated with altered patterns of localized activity within primary and secondary motor areas. For instance, increased control might result from localized alterations in neurochemistry that influence the excitatory–inhibitory balance within a region, or as a result of changes to the operation of local cortical circuits. This last proposal was examined in two recent transcranial magnetic stimulation (TMS) studies that investigated changes in corticospinal excitability (CSE) that immediately precede volitional movements in TS.
Heise et al. (2010) used TMS to investigate the modulation of motor cortex excitability during the preparation period that preceded voluntary movements in a group of adult patients with TS. This study reported that while resting motor thresholds (RMT) and active motor thresholds did not differ between individuals with TS and a group of matched control participants, the patients showed a reduction, relative to healthy controls, in the magnitude of the increase in motor-evoked potential (MEP) amplitude that accompanies the preparation of volitional movements. Importantly, this difference in MEP amplitude was not apparent until 60% of the movement preparation period had elapsed. Jackson and co-workers independently investigated the same issue in a group of children and adolescents with uncomplicated TS performing a manual choice-reaction-time task that induces high levels of inter-manual conflict and reported similar findings: specifically, performance on the behavioural response–conflict task did not differ between the adolescents with TS and the group of age-matched typically developing individuals; however, mean MEP amplitudes measured during the period immediately preceding finger movements were significantly reduced in the TS group (Jackson et al., 2012).
In each of the above studies, the reduction in MEP amplitude observed in the TS group immediately preceding volitional movements was interpreted as further evidence in support of the proposal that the cortical hyper-excitability that may give rise to tics in TS is actively suppressed by top-down cognitive control mechanisms, most likely involving higher motor areas and the prefrontal cortex (Heise et al., 2010; Jackson et al., 2011). However, more recent TMS studies investigating alterations in CSE in the period preceding volitional movements have demonstrated that in healthy adult participants there is a task-dependent reduction in CSE immediately preceding voluntary movements which is thought to reflect optimization of population level neural responses during movement preparation (Klein-Flügge, Nobbs, Pitcher, & Bestmann, 2013).
Clearly, the differences in mean MEP amplitude that are observed to precede volitional movements in individuals with TS, relative to controls, may be influenced by the variability in MEP amplitudes. For this reason, the current study was carried out to answer the following questions. First, do individuals with TS exhibit the increases in CSE that are observed to precede volitional movements in typically developing individuals? Second, if individuals with TS do exhibit alterations in CSE ahead of voluntary movement, is the time course of these alterations similar to that observed for typically developing individuals? Third, do individuals with TS exhibit similar levels of variability in MEP amplitude to controls? Fourth, do differences in CSE in the period immediately preceding voluntary movements predict differences in clinical measures of tic severity?
To answer these questions, a behavioural GO/NOGO task was conducted in which children and adolescents with TS and a group of age- and gender-matched typically developing individuals executed or withheld speeded motor responses using the index finger of their right hand while MEPs were recorded from the right hand first dorsal interosseous (FDI) muscle. To measure alterations in CSE that precede volitional movements, a single TMS pulse (110% of RMT) was delivered on all trials at 25%, 50%, or 75% of each individual's continuously tracked median reaction time. Note, however, that TMS data are analysed relative to the recorded movement onset for each trial. Between-group and within-group comparisons are reported for MEP amplitude and alterations in the coefficient of variation (CV) of MEP amplitude.
Method
Participants
Ten adolescents (one female, aged 11–20 years, mean age 15.3 ± 2.91 years) with a diagnosis of TS took part in this study. Patients were recruited from a specialist TS clinic. Ten age- and gender-matched typically developing adolescents (mean age 15.3 ± 3.09 years) were recruited as a control group. All participants gave informed consent before they began the experiment and were screened for any history of epilepsy, migraines or irremovable metal in their head. Appropriate local ethical committee approval was obtained for the procedures reported. Tic symptoms were measured on the day of testing using the Yale Global Tic Severity Scale (YGTSS; Leckman et al., 1989). Three subjects had a diagnosis of co-morbid obsessive–compulsive disorder (OCD) and one had a diagnosis of ADHD. Clinical details of TS subjects are presented in TableI.
Table I.
Clinical characteristics of Tourette syndrome participants
| ID | Age | Gender | YGTSS | Motor tic scores | Phonic tic scores | Co-morbidity | Medication |
|---|---|---|---|---|---|---|---|
| TS006 | 20 | M | 40 | 14 | 16 | None | Clonidine |
| TS018 | 17 | M | 22 | 12 | 0 | ADHD | Clonidine |
| TS028 | 17 | F | 41 | 10 | 11 | OCD | None |
| TS071 | 12 | M | 33 | 15 | 13 | OCD | None |
| TS013 | 17 | M | 47 | 11 | 6 | OCD | None |
| TS067 | 17 | M | 29 | 14 | 0 | None | Clonidine |
| TS069 | 11 | M | 24 | 14 | 5 | None | None |
| TS074 | 12 | M | 33 | 14 | 9 | None | None |
| TS034 | 14 | M | 25 | 7 | 8 | None | None |
| TS062 | 16 | M | 65 | 24 | 21 | None | Citalopram |
Note.
YGTSS = Yale Global Tic Severity Scale; ADHD = attention deficit hyperactivity disorder; OCD = obsessive–compulsive disorder.
Transcranial magnetic stimulation
A Magstim Rapid 200 TMS monophasic stimulator unit (The Magstim Company Limited, Carmarthenshire, UK) with a 70 mm figure-of-eight coil was used to deliver single pulse TMS to the hand area of the left hemisphere motor cortex. The coil was positioned over the motor hotspot for the FDI muscle of the right hand. The motor hotspot was found by a process of trial-and-error during which a single TMS pulse was delivered at various locations until an appropriate muscle twitch was consistently observed. Once the motor hotspot had been identified the coil was held securely in place by a mechanical arm, and the position continuously observed and any movement corrected for between trials by the experimenter. RMT was estimated using an adapted staircase procedure and was defined as the lowest intensity to produce a visually observable twitch in the FDI muscle while the hand was at rest. The estimated RMT was checked and accepted if it produced a muscle twitch in five out of 10 consecutive trials. TMS pulse intensity was set to 110% of RMT throughout the experiment.
Single-use ECG electrodes with a 5 mm diameter were positioned in a belly-tendon configuration, with the active electrode positioned on the centre of the FDI muscle and the reference 2 cm above it on the tendon of the right hand. A ground electrode was positioned on the right wrist.
Experimental procedure
Participants were seated with their head resting comfortably in a chin rest positioned 50 cm away from a 17 inch monitor that displayed the stimuli and completed a GO/NOGO motor task. On GO trials, subjects pressed a response button with their right index finger whenever a 4 cm diameter green filled circle, located centrally on a grey background, was presented to them. A red filled circle indicated a NOGO trial and subjects were instructed to withhold a response whenever the red circles appeared. Trials were presented in a pseudo-random order, with a NOGO trial appearing in a random position within each block of six consecutive trials. Each trial was terminated either by a response or else timed out automatically after 2 s. During the inter-stimulus interval a grey background was displayed for 5 s. The experiment was coded and run using the Cogent Graphics toolbox implemented within Matlab (The MathWorks, Inc., Natick, MA, USA).
Participants completed an initial block of 36 practice trials to familiarize themselves with the task. Practice trials were also used to obtain an initial estimate for each individual's median reaction time. During the 120 experimental trials this median reaction time was re-calculated every six trials to control for any change in average speed of responding. A single TMS pulse was delivered on all trials at 25%, 50%, or 75% of the individual's median reaction time relative to stimulus onset. Note, for analysis purposes the timing of TMS pulses was response-locked rather than stimulus-locked. Specifically, response-locked timing of the TMS pulse was calculated for each GO trial as the percentage of the response time (RT) for that trial, calculated as the interval separating stimulus onset time (0%) and RT (100%). Based upon previous findings (Heise et al., 2010), the data were separated for each participant into three categories: TMS delivered at 0–60%, 61–80%, and 81–100% of movement preparation time.
Delivery of TMS on NOGO trials was included as an important control condition insofar as MEPs obtained on correct NOGO trials provide an estimate of baseline MEP in the absence of a behavioural response. For this reason, the raw MEP data were manually inspected for all trials and where noise occurred in a NOGO trial, which might have been caused by the participant moving their hand, that trial was excluded from further analysis. This procedure avoided MEPs being recorded in NOGO trial that may have been followed by a volitional movement, whether it was associated with button press response or a spontaneous hand movement. TMS pulses were triggered automatically from a laptop running Matlab via a National Instruments Data Acquisition Device that also relayed inputs from the button box back to the computer. Electromyography (EMG) data were recorded on each trial for a period of 3 s following stimulus onset. EMG signals buffered and amplified using a g.USB Biosignal Amplifier (g.tec medical engineering GmbH, Guger Technologies OG, Schiedlberg, Austria) with a sampling frequency of 1200 Hz.
Statistical analyses
For each participant, the median RT was calculated for correct GO trials and the percentage of errors calculated for incorrect GO trials (i.e., time reached without a response being recorded) and incorrect NOGO trials (i.e., where a button press response was recorded). It should be noted that there were no incorrect GO trials and all errors were incorrect NOGO trials. Analyses of between-group differences in performance were carried out using a set of three independent sample t-tests that were specified a priori.
The EMG data for each participant and each trial were analysed separately using customized Matlab software developed in-house. MEPs for all trials were visually inspected and any trials in which the MEP was ambiguous were excluded. TMS-induced MEPs were identified as the signal occurring directly after the characteristic TMS artefact, and MEP amplitude was defined as the peak-to-peak difference in amplitude measured in mV. The response-locked timing for when TMS pulse was delivered during the pre-movement period was calculated for each GO trial and expressed as the percentage of the reaction time for that trial, calculated as the interval separating stimulus onset time (0%) and RT (100%). Based upon the findings reported by Heise et al. (2010), the data were separated for each participant into three categories: TMS delivered at 0–60%, 61–80%, and 81–100% of movement preparation time. Median MEP amplitudes were then calculated for each individual and for each bin for GO trials, and also for NOGO trials. Median MEP data were analysed using two-way mixed ANOVAs with a between-subject factor of group (TS group vs. CS [control subjects] group) and a within-subject factor of period (e.g., NOGO, 0–60%, 61–80%, 81–100%).
Results
Behavioural task performance
As noted above, analyses of between-group differences were carried out using a set of planned independent sample t-tests. These analyses revealed that there were no significant differences between the TS group and the age-matched controls for response accuracy (TS mean NOGO errors = 18% [SD = 15%]; CS mean NOGO errors = 22% [SD = 14%]; t(18) = 1.2, p > .1); mean RT (TS mean RT = 490 [SD = 180] ms; CS mean RT = 460 [SD = 110] ms; t(18) = 1.04, p > .1); or RMT measured as the percentage of maximum stimulator output (TS mean RMT = 67.2% [SD = 5.0]; CS mean RMT = 66.4% [SD = 8.0]; t(18) = .87, p > .1). Note, NOGO trials in which a response was made were identified and excluded from all further analyses.
MEP amplitude during the movement preparation period
Median MEP data were initially analysed using a two-way mixed ANOVA with a between-subject factor of group (TS group vs. CS group) and a within-subject factor of period (NOGO, 0–60%, 61–80%, 81–100%). This analysis revealed a statistically significant main effect of period, F(3,54) = 14.9, p < .0001, also and a significant Group × Period interaction, F(3,54) = 4.5, p < .01. Relevant means are presented in Figure1.
Figure 1.
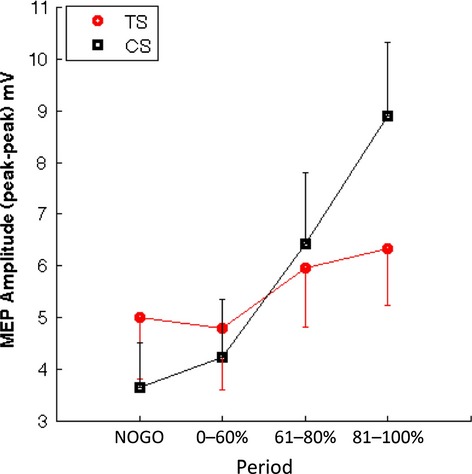
Mean motor-evoked potential (MEP) amplitudes for each group and each condition/period (i.e., NoGo trials, Go trials 0–60%, 61–80%, 81–100% of the movement preparation period). Error bars are SEM.
Importantly, an a priori planned contrast to compare mean MEP amplitudes between the groups for the no movement (correct NOGO) trials revealed that the TS and CS groups did not differ on NOGO trials, t(18) < 1, p > .1. To explore the nature of the Group × Period interaction, we investigated the simple effects of period for each group separately with comparisons based upon paired t-tests. All p-values were corrected for multiple comparisons using false discovery rate (FDR) correction. These analyses confirmed that there were no significant differences between any of the individual means (i.e., NOGO, 0–60%, 61–80%, 81–100%) for the TS group (maximum t(9) = −2.7, p = .06 [FDR-corrected]). By contrast, the analyses revealed statistically significant increases in MEP for the CS group between the NOGO and the 61–80% condition (mean NOGO = 3.6 mV, mean 61–80% = 6.4 mV; t(9) = −4.7, p = .002 FDR-corrected; effect size, Glass's delta [the standardized mean difference] = −1.01) and between the NOGO and the 81–100% condition (mean NOGO = 3.6 mV, mean 81–100% = 8.9 mV; t(9) = −5.6, p = .0003 FDR-corrected; Glass's delta = −1.89). MEPs early in the movement preparation period (0–60%) did not differ significantly from MEPs on no movement (NOGO) trials (mean NOGO = 3.6 mV, 0–60% = 4.2 mV; t(9) = −2.06, p > .05). These results confirm that while there was a statistically significant increase in mean MEP in the later stages of movement preparation for the CS group, this effect was not seen for the TS group.
To further examine any potential group increases in MEP during movement preparation, we corrected for individual differences in baseline MEP by calculating, for each participant, the ratio of MEPs on GO trials with respect to their median MEP on no movement (correct NOGO) trials. Relevant means are presented in Figure2. Inspection of this figure suggests that the CS group shows a larger increase in MEP amplitude in the later stages of the movement preparation period than the TS group. This was tested in a two-way mixed ANOVA with the factors group (TS group vs. CS group) and period (0–60%, 61–80%, 81–100%). ANOVA revealed significant main effects of group, F(1,18) = 6.2, p < .025, and period, F(2,36) = 16.1, p < .0001, and a marginal Group × Period interaction that approached statistical significance, F(2,36) = 2.75, p = .08. Importantly, a post-hoc independent sample t-test confirmed that the mean MEP amplitudes for the CS and TS groups during the early period of movement preparation did not differ significantly from one another (mean 0–60% period: CS = 1.15 mV, TS = 0.93 mV, t(18) = −2.03, p > .05). These results confirm that when individual levels of baseline MEP are taken into account, the TS group still exhibits significantly reduced MEP amplitudes, relative to controls, in the period immediately preceding movement onset but not in the early phase (i.e., 0–60%) of movement preparation.
Figure 2.
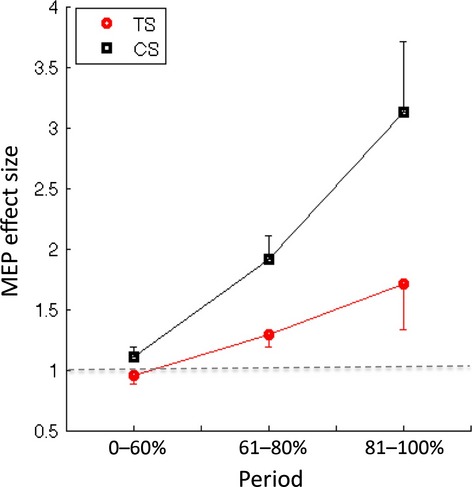
Mean motor-evoked potential (MEP) amplitudes for each group for period of movement preparation time (i.e., 0–60%, 61–80%, and 81–100%) expressed as a ratio of mean MEP amplitude on no movement (i.e., correct NoGo) trials. Note the broken horizontal line indicates a ratio of 1.
Differences in MEP amplitude variability during the pre-movement period
To examine variability in MEP amplitudes during movement preparation, the CV was calculated independently for each participant and for each period. The CV is a normalized measure of dispersion and is calculated by taking the ratio of the sample standard deviation to the sample mean. Mean CV values for each group are presented in TableII. These data indicate that the predicted decrease in variability in the MEP amplitude during movement preparation appears to be present for the control group but not for the TS group. This was tested statistically by conducting separate, a priori, within-group planned comparisons for each group. These analyses revealed that, as predicted, for the CS group the mean CV decreased significantly over the course of the movement preparation – CS group: mean 0–60% period = 0. 47 (0.17); 61–80% = 0.35 (0.18); t(9) = 2.7, p < .025; Glass's delta = 0.67; mean 61–80% = 0.35 (0.18); 81–100% = 0.24 (0.14; t(9) = 2.57, p = .03; Glass's delta = 0.65. By contrast, these same analyses confirmed that the mean CV did not change significantly during movement preparation for the TS group – TS group: mean 0–60% period = 0.40 (0.17); 61–80% = 0.40 (0.23); t(9) > 1.0, p = .94; mean 61–80% = 0.40 (0.23); 81–100% = 0.36 (0.34); t(9) < 1.0, p = .53.
Table 2.
Mean and SD for coefficients of variation for each group
| Period | CS group: coefficient of variation |
TS group: coefficient of variation |
||
|---|---|---|---|---|
| Mean | SD | Mean | SD | |
| 0–60% | 0.47 | 0.17 | 0.40 | 0.17 |
| 61–80% | 0.35 | 0.18 | 0.40 | 0.23 |
| 80–100% | 0.24 | 0.14 | 0.36 | 0.34 |
SD = standard deviation; CS = control subjects; TS = Tourette syndrome.
Relationship between pre-movement CSE and tic severity scores
To investigate the relationship between clinical measures of tic severity and individual variability in the change in CSE observed during the movement preparation period, we carried out the following procedures. First, for each TS group participant, we carried out a simple linear regression using the time when TMS was delivered, measured as the percentage (0–100%) of movement preparation time (RT), as a regressor to predict MEP amplitude. The R2 values obtained for these analyses ranged from 0.18 to 0.78 and the mean R2 value was 0.63. The slope value (β) obtained from these analyses is an estimate of individual levels of change in CSE as a function of movement preparation. Second, individual estimates of motor tic severity, based upon YGTSS scores obtained on the day of testing, were then correlated (Pearson's) with individual CSE slope estimates. These data are presented in Figure3. Despite the relatively small number of subjects, this analysis revealed a strong, statistically significant, negative correlation between motor tic severity scores and individual slope values reflecting the magnitude of increases in CSE during motor preparation (R = −0.75, p < .01). This finding suggests that individuals who exhibit the greatest increases in MEP amplitude during motor preparation report lower levels of tic severity and conversely that individuals with the greatest tic severity show little or no modulation in MEP amplitude during movement preparation.
Figure 3.
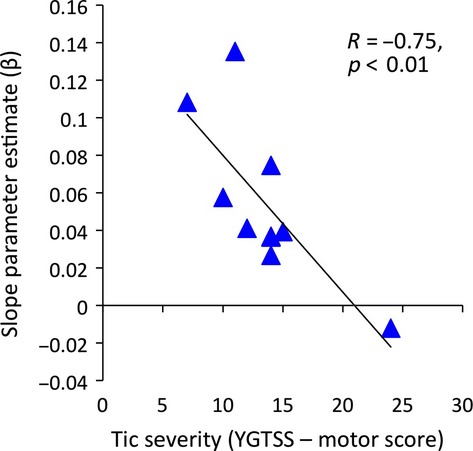
Relationship between motor tic severity, as assessed by the Yale Global Tic Severity Scale (YGTSS) motor tic sub-scale, and linear slope function calculated for each Tourette syndrome (TS) participant separately that describes the rise in motor-evoked potential (MEP) amplitude as a function of time through the movement preparation period.
Discussion
The key findings of this study can be summarized as follows. First, the group of adolescents with TS did not show the increase in mean MEP amplitude that was predicted to occur in the period immediately preceding the execution of a volitional movement. Second, this was not due to baseline differences in CSE between the groups as the mean MEPs for the TS and CS groups did not differ significantly on the no movement (NoGo) trials or during the initial period (0–60%) of movement preparation. Furthermore, the reduction in MEP amplitude in the TS group relative to controls remained even when baseline differences (estimated from the NoGo trials) were taken into account. Third, the TS group did not show the predicted reduction in MEP variability (CV) previously shown to occur in healthy young adults immediately prior to the execution of a volitional movement. Finally, individual differences in the rate of increase in MEP amplitude across the movement preparation period were negatively associated with individual clinical measurements of motor tic severity. Specifically, individuals who exhibited the smallest increases in MEP amplitude during the motor preparation period tended to have more severe motor tics that those individuals who presented with steeper increases in MEP amplitude during movement preparation. These findings are discussed in turn below.
Impairment in the normal operation of basal ganglia-thalamic-cortical circuits in TS is thought to give rise to hyper-excitability of cortical motor areas that may be exacerbated by dysfunctional intra-cortical inhibitory mechanisms (Orth et al., 2008; Ziemann et al., 1997). However, despite considerable evidence for increased cortical excitability in TS, it is clear that many individuals do in fact gain control over their tics during the course of their adolescence, most likely as a result of structural and functional alterations in neural circuits associated with volitional control of motor outputs (Jackson et al., 2011; Jung et al., 2013; Plessen et al., 2004; Serrien et al., 2005).
Previous studies have demonstrated that in neurologically healthy adults CSE within the contralateral motor cortex increases progressively during the preparation of volitional hand movements (e.g., Rossini, Zarola, Stalberg, & Caramia, 1988). In the current study, we found that unlike a matched group of typically developing individuals, adolescents with TS do not exhibit the predicted increase in mean MEP amplitude in the period immediately preceding the execution of a volitional movement. Furthermore, we found that the rise in CSE during motor preparation was significantly negatively correlated with tic severity; indicating that those individuals who exhibited the least modulation of their motor cortical excitability during motor preparation tended to also report more severe motor tics.
These results are consistent with the following proposals: first, that control over motor tics may come about through the active suppression of the hyper-excitable motor cortex (Heise et al., 2010; Jackson et al., 2007, 2011; Mueller et al., 2006; Serrien et al., 2005); second, that during the execution of volitional action by individuals with TS, increased inhibition of motor cortical excitability is needed to select an appropriate motor response, and simultaneously to control for the occurrence of tics (Heise et al., 2010; Mueller et al., 2006).
Our current findings confirm the results of two recent TMS studies that have independently reported that in individuals with TS, MEP amplitudes were significantly reduced in the period immediately preceding volitional movements (Heise et al., 2010; Jackson et al., 2012). They are also consistent with recent functional brain imaging studies of TS that have reported that during the execution of volitional manual response within a choice-RT task, the fMRI BOLD response in cortical motor areas is significantly reduced in adolescents with TS, relative to age-matched controls, despite performance on the behavioural task being equivalent across the groups (Jackson et al., 2011; Jung et al., 2013).
In addition to there being progressive, limb-specific, increases in CSE during motor preparation, recent studies have demonstrated that there are limb-specific decreases in the variability of CSE that occur shortly (∼230 ms) before movement onset, and are proposed to track the state of preparation for movement of the limb (Klein-Flügge et al., 2013). In the current study, we demonstrated that in contrast to a group of typically developing control participants, individuals with TS do not exhibit the predicted decrease in MEP variability previously reported to precede the execution of volitional movements in healthy young adults (Klein-Flügge et al., 2013). Importantly, this was shown to be the case even when MEPs were sampled only from within the inter-quartile range (to avoid saturation of MEP amplitudes) and when the mean MEP amplitude for the TS group was actually larger than that for controls (see Figure3).
The decrease in CSE variability that is observed in typically developing individuals most likely reflects increasingly consistent firing patterns within the population of motor cortical neurones recruited during movement preparation (e.g., Churchland, Yu, Ryu, Santhanam, & Shenoy, 2006). It is suggested that as a result of dysfunctional striatal-thalamo-cortical inputs, the motor cortex at rest in individuals with TS may have elevated levels of CSE, that must be suppressed in order to successfully execute volitional movements and suppress tics (Heise et al., 2010; Mueller et al., 2006). The absence of any significant alteration, at the group level, in MEP amplitude or MEP variability during motor preparation suggests that individuals with TS and severe motor tics may not readily develop a consistent firing pattern at the population level, and as a result motor tics may be triggered even during the preparation of volitional actions (Heise et al., 2010).
The coordination of firing patterns at the population level within the motor cortex is thought to depend critically upon the operation of populations of GABAergic interneurons (Di Cristo, 2007) that may be dysfunctional in TS (Gilbert et al., 2004, 2005; Heise et al., 2010; Moll et al., 1999, 2001; Orth et al., 2008; Ziemann et al., 1997). In particular, recent brain imaging evidence has demonstrated widespread cortical GABAergic abnormalities in TS (Lerner et al., 2012). However, it is important to note that the measure of CSE used in the current study (MEP amplitude) reflects the summation of a number of physiological signals and may reflect both the activity of local neural circuits within the motor cortex (likely including GABAergic interneurons) and the modulatory effects on the motor cortex excitability of cortical inputs from secondary motor areas. Distinguishing between these two sources of control over CSE will require additional investigation.
In summary, we used single-pulse TMS, together with a manual Go/NoGo task, to explore alterations in motor cortical excitability in the motor preparation period preceding a finger movement, in a group of adolescents with TS. The main findings of the study were that, unlike typically developing individuals, the adolescents with TS as a group did not alter their average levels of CSE during movement preparation ahead of a volitional movement. Specifically, they did not exhibit the increase in MEP amplitude and decrease in MEP variability predicted to immediately precede volitional movements in typically developing young adults. Importantly, the rate of increase in MEP amplitude (or lack thereof) was found to be strongly negatively associated with motor tic severity in TS.
Acknowledgments
We are particularly grateful to Mrs Jane Fowlie for her help with these studies. This work was funded by a grant from the James Tudor Foundation.
References
- Albin RL. Mink JW. Recent advances in Tourette syndrome research. Trends in Neurosciences. 2006;29:175–182. doi: 10.1016/j.tins.2006.01.001. [DOI] [PubMed] [Google Scholar]
- Churchland MM, Yu BM, Ryu SI, Santhanam G. Shenoy KV. Neural variability in premotor cortex provides a signature of motor preparation. Journal of Neuroscience. 2006;26:3697–3712. doi: 10.1523/JNEUROSCI.3762-05.2006. [DOI] [PMC free article] [PubMed] [Google Scholar]
- Di Cristo G. Development of cortical GABAergic circuits and its implications for neurodevelopmental disorders. Clinical Genetics. 2007;72:1–8. doi: 10.1111/j.1399-0004.2007.00822.x. [DOI] [PubMed] [Google Scholar]
- Gilbert DL, Bansal AS, Sethuraman G, Sallee FR, Zhang J, Lipps T. Wassermann EM. Association of cortical disinhibition with tic, attention deficit hyperactivity disorder, and obsessive compulsive disorder severity in Tourette syndrome. Movement Disorders. 2004;19:416–425. doi: 10.1002/mds.20044. …. [DOI] [PubMed] [Google Scholar]
- Gilbert DL, Sallee FR, Zhang J, Lipps TD. Wassermann EM. Transcranial magnetic stimulation-evoked cortical inhibition: A consistent marker of attention-deficit/hyperactivity disorder scores in Tourette syndrome. Biological Psychiatry. 2005;57:1597–1600. doi: 10.1016/j.biopsych.2005.02.022. [DOI] [PubMed] [Google Scholar]
- Heise KF, Steven B, Liuzzi G, Thomalla G, Jonas M, Müller-Vahl K. Hummel FC. Altered modulation of intracortical excitability during movement preparation in Gilles de la Tourette syndrome. Brain. 2010;133:580–590. doi: 10.1093/brain/awp299. …. [DOI] [PubMed] [Google Scholar]
- Jackson GM, Mueller SC, Hambleton K. Hollis CP. Enhanced cognitive control in Tourette syndrome during task uncertainty. Experimental Brain Research. 2007;182:357–364. doi: 10.1007/s00221-007-0999-8. [DOI] [PubMed] [Google Scholar]
- Jackson SR, Parkinson A, Jung J, Ryan SE, Morgan PS, Hollis C. Jackson GM. Compensatory neural reorganisation in Tourette syndrome. Current Biology. 2011;21:580–585. doi: 10.1016/j.cub.2011.02.047. [DOI] [PMC free article] [PubMed] [Google Scholar]
- Jackson SR, Parkinson A, Manfredi V, Millon G, Hollis CP. Jackson GM. Motor excitability is reduced prior to voluntary movements in children and adolescents with Tourette syndrome. Journal of Neuropsychology. 2012;7:29–44. doi: 10.1111/j.1748-6653.2012.02033.x. [DOI] [PMC free article] [PubMed] [Google Scholar]
- Jung JY, Jackson SR, Parkinson A. Jackson GM. Cognitive control over motor output in Tourette syndrome. Neuroscience & Biobehavioural Reviews. 2013;37:1016–1025. doi: 10.1016/j.neubiorev.2012.08.009. [DOI] [PubMed] [Google Scholar]
- Klein-Flügge MC, Nobbs D, Pitcher JB. Bestmann S. Variability of human corticospinal excitability tracks the state of action preparation. Journal of Neuroscience. 2013;33:5564–5572. doi: 10.1523/JNEUROSCI.2448-12.2013. [DOI] [PMC free article] [PubMed] [Google Scholar]
- Leckman JF. Tourette's syndrome. Lancet. 2002;360:1577–1586. doi: 10.1016/S0140-6736(02)11526-1. [DOI] [PubMed] [Google Scholar]
- Leckman JF, Riddle MA, Hardin MT, Ort SI, Swartz KL, Stevenson J. Cohen DJ. The Yale Global Tic Severity Scale: Initial testing of a clinician-rated scale of tic severity. Journal of the American Academy of Child and Adolescent Psychiatry. 1989;28:566–573. doi: 10.1097/00004583-198907000-00015. [DOI] [PubMed] [Google Scholar]
- Lerner A, Bagic A, Simmons JM, Mari Z, Bonne O, Xu B. Hallett M. Widespread abnormality of the γ-aminobutyric acid-ergic system in Tourette syndrome. Brain. 2012;135:1926–1936. doi: 10.1093/brain/aws104. …. [DOI] [PMC free article] [PubMed] [Google Scholar]
- Moll GH, Heinrich H, Trott GE, Wirth S, Bock N. Rothenberger A. Children with comorbid attention-deficit hyperactivity disorder and tic disorder: Evidence for additive inhibitory deficits within the motor system. Annals of Neurology. 2001;49:393–396. [PubMed] [Google Scholar]
- Moll GH, Wischer S, Heinrich H, Tergau F, Paulus W. Rothenberger A. Deficient motor control in children with tic disorder: Evidence from transcranial magnetic stimulation. Neuroscience Letters. 1999;272:37–40. doi: 10.1016/s0304-3940(99)00575-3. [DOI] [PubMed] [Google Scholar]
- Mueller SC, Jackson GM, Dhalla R, Datsopoulos S. Hollis CP. Enhanced cognitive control in young people with Tourette's syndrome. Current Biology. 2006;16:570–573. doi: 10.1016/j.cub.2006.01.064. [DOI] [PubMed] [Google Scholar]
- Neuner I, Kupriyanova Y, Stöcker T, Huang R, Posnansky O, Schneider F. Shah NJ. White-matter abnormalities in Tourette syndrome extend beyond motor pathways. Neuroimage. 2010;51:1184–1193. doi: 10.1016/j.neuroimage.2010.02.049. …. [DOI] [PubMed] [Google Scholar]
- Orth M, Munchau A. Rothwell JC. Corticospinal system excitability at rest is associated with tic severity in Tourette syndrome. Biological Psychiatry. 2008;64:248–251. doi: 10.1016/j.biopsych.2007.12.009. [DOI] [PubMed] [Google Scholar]
- Plessen KJ, Bansal R. Peterson BS. Imaging evidence for anatomical disturbances and neuroplastic compensation in persons with Tourette syndrome. Journal of Psychosomatic Research. 2009;67:559–573. doi: 10.1016/j.jpsychores.2009.07.005. [DOI] [PMC free article] [PubMed] [Google Scholar]
- Plessen KJ, Wentzel-Larsen T, Hugdahl K, Feineigle P, Klein J, Staib LH. Peterson BS. Altered interhemispheric connectivity in individuals with Tourette's disorder. American Journal of Psychiatry. 2004;161:2028–2037. doi: 10.1176/appi.ajp.161.11.2028. …. [DOI] [PubMed] [Google Scholar]
- Rossini PM, Zarola F, Stalberg E. Caramia M. Pre-movement facilitation of motor-evoked potentials in man during transcranial stimulation of the central motor pathways. Brain Research. 1988;458:20–30. doi: 10.1016/0006-8993(88)90491-x. [DOI] [PubMed] [Google Scholar]
- Serrien DJ, Orth M, Evans AH, Lees AJ. Brown P. Motor inhibition in patients with Gilles de la Tourette syndrome: Functional activation patterns as revealed by EEG coherence. Brain. 2005;128:116–125. doi: 10.1093/brain/awh318. [DOI] [PubMed] [Google Scholar]
- Ziemann U, Paulus W. Rothenberger A. Decreased motor inhibition in Tourette's disorder: Evidence from transcranial magnetic stimulation. American Journal of Psychiatry. 1997;154:1277–1284. doi: 10.1176/ajp.154.9.1277. [DOI] [PubMed] [Google Scholar]