Abstract
Cordyceps pruinosa (CP) is often used as Traditional Chinese Medicine, but the substance basis of its medicinal properties is unclear. In this study, two compounds were isolated from CP cultures by column chromatography, and identified as cordycepin and N6-(2-hydroxyethyl)-adenosine (HEA) by Nuclear Magnetic Resonance. In order to understand the efficacy of these two substances as potential therapeutic agents, it is necessary to explore their binding with proteins. The molecular mechanisms of interaction between cordycepin, HEA and human serum albumin (HSA) were studied using UV and fluorescence spectroscopy. The bingding constants between HSA and cordycepin were 4.227, 3.573 and 3.076 × 10³·at 17, 27 and 37°C respectively, and that of HSA and HEA were 27.102, 19.409 and 13.002 × 10³·at the three tempretures respectively. Both cordycepin and HEA can quench the intrinsic fluorescence of HSA via static quenching, and they can bind with HSA to form complexes with a single binding site. The interaction forces between cordycepin and HSA were determined as electrostatic and hydrophobic, and those of HEA and HSA were hydrogen bonding and van der Waals forces. Using Foster's equation, the distance between fluorophores of cordycepin and HSA, and HEA and HSA are estimated to be 5.31 nm and 4.98 nm, respectively. In this study, cordycepin was isolated for the first time from CP, and will provide a new source of cordycepin and expand the use of this taxon. The interaction mechanisms between cordycepin and HSA was studied for the first time, which will provide a useful guide for the clinical application of cordycepin. The pharmacological importance of this study is to understand the interaction of HSA with cordycepin and HEA, which will be essential for the future designing of drugs based on the two compounds.
Introduction
Cordyceps sensu lato is one of the most important fungal groups of invertebrate pathogens with about 530 species (Index Fungorum 2014) [1]. Searching for bioactive compounds from Cordyceps sensu lato is an important way to screen for new medicines. Cordyceps pruinosa Petch (CP) belongs to Cordyceps sensu stricto and has potential medicinal application [2–3]. Polysaccharides isolated from CP have been shown to improve cellular immune functioning [4]. Methanol extracts of CP inhibited inflammation [5–6] while the butanol fractions of it induced apoptosis in HeLa cells [7]. Although CP showed a series of bioactivities, these were only established via crude extracts but not pure compounds, thus the substance basis of these bioactivities remains unclear.
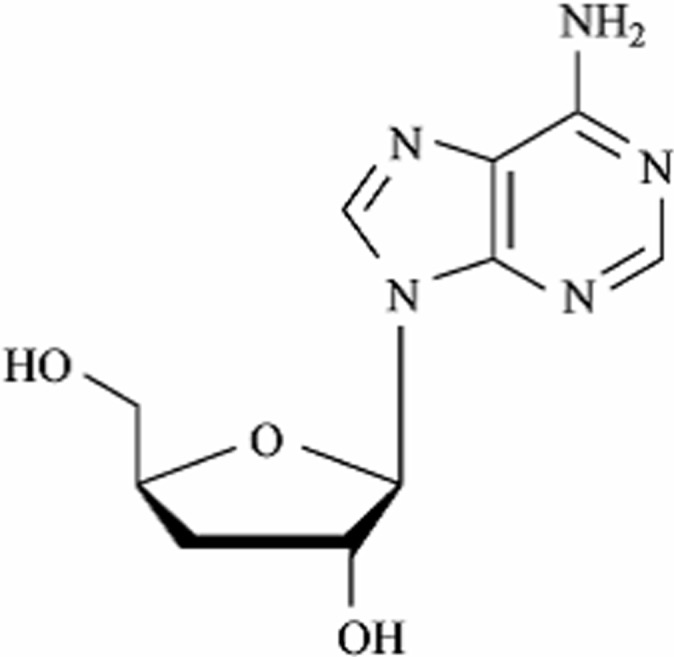
Cordycepin (3'-deoxyadenosine) is the major bioactive component from Cordyceps militaris that has been widely used as a Traditional Medicine and healthy food in oriental countries. Cordycepin is an adenosine derivative with the formula of C10H13N5O3, molecular weight 251 D and the chemical structural shown in Fig. 1. Since 1960s, broad pharmacological functions of cordycepin have been discovered, which include: anti-tumor [8], anti-bacterial [9], anti-virus [10], immunomodulatory [11], anti-inflammatory [12], hyperlipemia regulation [13], anti-aging [14], neuroprotective [15], promoting learning and memory [16], anti-oxidant activity [17], apoptosis [18] and has a positive effect on rheumatoid arthritis [19]. In the last decade, studies targeting cordycepin as a therapeutic agent have been in progress, especially application to leukemia (ClinicalTrials.gov, verified by OncoVista, Inc., 2009) [20–21]. In addition, preclinical assessment of cordycepin and deoxycoformycin in the treatment of African trypanosomiasis in second-stage has been tested [22].
Fig 1. Chemical structure of cordycepin.
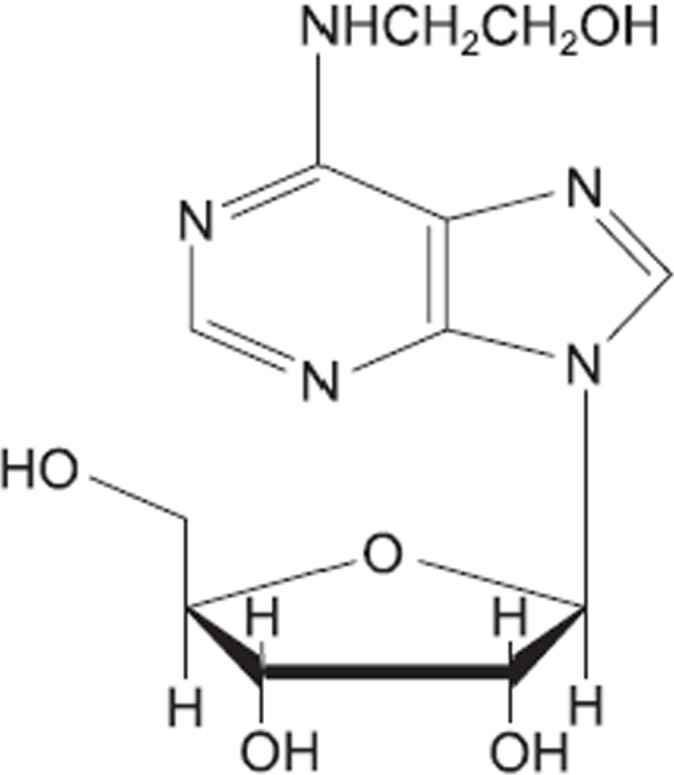
One of the main bioactive compounds produced by CP is N6-(2-hydroxyethyl)-adenosine (HEA) (C12H17N5O5, Fig. 2). The compound behaves as a Ca2+ antagonist, an inotropic agent, has radiation resistance [23], causes hypomobility in mice [24], is an analgesic [25], protects the brain [26] and has anti-tumor properties [27]. In addition, HEA can bind with human serum albumin (HSA) to form a complex by hydrophobic interaction [28].
Fig 2. Chemical structure of N6-(2-hydroxyethyl)-adenosine.
HSA is the most abundant protein in the plasma, which plays important role in transporting, distribution, storing and metabolism of many exogenous ligands, such as drugs, fatty acids, and amino acids. It is a globular protein composed of 585 amino acids, which can bind with different drug types and various small bioactive molecules, such as metal cations and fatty acids. As a consequence, studies on the interaction between HSA and drugs can offer information of drug action to understand the distribution and absorption of the drugs [29–33].
Although there are about 530 species in Cordyceps sensu lato, cordycepin had only been reported in 12 species [34]. So far there was no report on cordycepin isolation from CP as well as no report concerning the interaction of cordycepin with HSA. HEA was first found in CP and few reports concerning its interaction with HSA are available. In the present work, the two compounds of adenosine derivatives, cordycepin and HEA, were isolated from CP, and their interaction with HSA were studied systematically under simulated physiological conditions. The binding mechanism and the thermodynamic parameters were characterized by fluorescence approach and UV absorption spectroscopic assay.
Materials and Methods
Reagents and Buffers
All chemicals were of the reagent grade. All buffers were prepared using deionized water from a Milli-Q water purification system (Millipore Corp., USA) with a resistivity >18.2 MQ·cm. The pH values were measured with an ORION pH meter and a 0079 microelectrode (ORION, USA), respectively, at 25°C.
Strain and Fermentation
The CP strain (GZUCC 8552) used in this study is deposited in Guizhou University Culture Collection, Guizhou Province, China. The strain was activated on PDA and then transferred to the seed culture by punching out 10 mm of the agar disc with a sterilized self-designed cutter. The seed culture was placed in a 250 mL flask containing 100 mL of basic medium (sucrose 10 g/L, glucose 5 g/L, glycerol 10 g/L, soybean meal 5 g/L, yeast extract 1 g/L, KH2PO4·3H2O 1 g/L, MgSO4·7H2O 10 g/L, KCl 0.5 g/L, FeSO4·7H2O 0.01 g/L with 1000 mL distilled water), on a rotary shaking incubator at 26°C in darkness with 100 rev/min for 4 d. The liquid static medium was prepared by mixing 200 mL of basic medium (sucrose 10 g/L, glucose 10 g/L, peptone 10 g/L, MgSO4·7H2O 1 g/L, K2HPO4 1 g/L and KH2PO4·3H2O 0.5 g/L with 1000 mL distilled water) in a cylindrical glass bottle. The media were autoclaved for 30 min at 121°C and each bottle was inoculated with 5 mL liquid inoculum of the seed culture. All bottles were incubated at 26°C in darkness for 120 days via liquid static culture. All the mycelia were harvested and dried to a constant weight at 55°C.
Isolation of Cordycepin and HEA
The CP mycelia powder (1 kg) were extracted with 75% (v/v) ethanol (10 L × 3) for three times in 30 min at room temperature using an ultrasonic cleaner (Ningbo Scientz Boitechnology, China), and then the combined extracts were concentrated to 2 L under reduced pressure. The concentrated extracts was loaded on a macroporous resin AB-8 chromatography with a gradient elution of ethanol/water (0%, 10%, 30%) to yield three fractions. The 30% fraction was choosen for further isolation via HPLC (Agilent 1100 series, USA) analysis. HPLC was with an RP-C18 column (5 μm, 4.6 × 150 mm) (Upelco, Bellefonte, PA, USA). The mobile phase consisted of water and methanol (90:10, v/v). Elution was performed at a flow rate of 1 mL min–1 with the column temperature at 45°C, injection volume of 10 μL and the UV wavelength of 254 nm [35].
Preparative reversed-phase HPLC
The 30% fraction of CP was filtered through a 0.45 μm pore-size Millex-HV hydrophilic PVDF syringe filter (Millipore) for further experiment. Preparative reversed-phase HPLC separation of 30% fraction was performed on the Agilent 1100 series HPLC (Agilent Technologies, USA) equipped with an additional fraction collector. Separation took place on a ZORBAX SB-C18 (21.2 mm × 250 mm; 5 μm particle size; 110 Å pore size) column. The mobile phases of water and methanol (v:v, 90:10) were used. The flow rate and column temperature were maintained at 8 mL/min and 30°C respectively, and 100 μL injection repeatedly. The fractions were collected using automatic peak detection. Two compounds were isolated after the pooled fractions were rotary evaporated under vacuum and freeze-dried.
General experimental procedures
Melting point was measured with an XT-4 apparatus and uncorrected. The 1H and 13C NMR spectra were recorded on an INOVA-400 (Varian, San Francisco, USA) instrument using TMS as internal standard. ESI-MS was measured with a HP-5973 mass spectrometer. EIMS measurements were undertaken on a VG Autospec-3000 mass spectrometer (VG, Manchester, UK).
UV Absorption Spectra Assay
The UV absorption spectra of HSA were detected by UV spectrophotometry (UV-2450PC, Shimadzu). The spectra of 0.5 μM HSA (Sigma company) were analyzed with Tris-HCl buffer (pH 7.4) as the control. Different concentrations of cordycepin (0, 10, 20, 30, 40 and 50 μM) were added into the Tris-HCl buffer. The sample was incubated for 30 min before assaying. The spectra of cordycepin, HSA, and mixture of cordycepin and HSA were recorded, respectively. In the same way, different concentrations of HEA (0, 10, 20, 30, 40 and 50 μM) were added into the Tris-HCl buffer and the buffer containing 0.5 μM HSA. The spectra of HEA, HSA, and mixture of HEA and HSA were also recorded.
Fluorescence Spectra Assay
The fluorescence spectra were measured with a Cary Eclipse Fluorescence Spectrofluorometer (Agilent Technologies, USA) equipped with a single cell peltier accessory. The fluorescence spectra of HSA were detected in Tris-HCl buffer (pH 7.4) when the width of entrance and exit slit was 5 nm and the scanning speed was 750 nm•sec−1. One μM HSA was mixed with different concentrations of cordycepin (0, 10, 20, 30, 40 and 50 μM) in the Tris-HCl buffer (a total accumulated volume of 2000 μL, pH 7.4). The reactions were assayed at 17, 27 and 37°C. In the same way, 1 μM HSA was mixed with different concentrations of HEA (0, 10, 20, 30, 40 and 50 μM). The type of fluorescent quenching was determined following the Equation (1) as previously described [36].
| (1) |
Where F 0 is the fluorescence intensity in the absence of quencher, F is the fluorescence intensity in the presence of quencher concentration, K q τ 0 is the quenching rate constant of biomacromolecule, K sv is the quenching rate constant of dynamic quenching and [Q] is fluorescence lifetime of biomacromolecule without quencher. τ 0 is usually about 10–8 sec [36–37]. The maximal collisional quenching rate constant was 2×10¹⁰ L·mol−1·s−1 for all classes of the biomolecule [38].
The binding constant and the number of binding sites were detected following Equation (2) as previously described [39–40].
| (2) |
Where K is the binding constant and n is the number of binding sites.
The acting forces include hydrogen bonds, Van der Waals forces, electrostatic forces, and hydrophobic interaction forces between small molecule drugs and biomacromolecules. The reaction enthalpy change is regarded as a constant when the temperature hardly changes. Thus, the types of acting forces can be determined following Equations (3 and 4) as previously described [41].
| (3) |
| (4) |
Where K is the binding constant, T is the temperature, R is the gas molecule constant, ΔH is the binding enthalpy change, ΔS is the binding entropy change, ΔG is the Gibbs’ free energy change.
The acting force were hydrophobic interaction force, hydrogen bonds and Vander Waals force, and electrostatic force, respectively, when ΔH>0 and ΔS>0, ΔH<O and ΔS<0, and ΔH≈0 and ΔS>0 [37].
According to the Forster non-radioactive energy transfer theory (Equations (5)–(7)) [37–38], the energy-transfer effect is related not only to the distance between acceptor and donor (r), but also to the critical energy transfer distance (with a transfer efficiency of 50%, R 0).
| (5) |
| (6) |
| (7) |
Where K 2 is the spatial-orientation factor of dipole, N is the refractive index of medium, Φ is the fluorescence quantum yield of donor, E is the energy transfer effect, F is the fluorescence intensity when C(Drugs)/C(HSA) = 1:1. In this study, K 2 = 2/3, N = 1.336, and Φ = 0.118. J is the overlap integral of the fluorescence emission spectrum of donor and the absorption spectrum of acceptor when C(Drugs)/C(HSA) = 1:1 (Equation (8)).
| (8) |
Where I p (λ) is the fluorescence intensity of fluorescent donor at wavelength λ, and ε D (λ) is the molar absorbance of acceptor at wavelength λ.
Statistical Analysis
The data were analyzed by F-test and SPSS 13.0 (SPSS 13.0, 2005, SPSS Inc., Chicago, USA) according to the general linear model. P<0.05 was considered significant and P<0.01 was considered extremely significant. The data are expressed as mean ± SD. The graph were made by OriginLab OriginPro 8.5 (OriginLab Corporation, USA) and Excel 2010 (Microsoft Corporation, USA)
Results
Two compounds isolated from CP
Two compounds, compound 1 and compound 2, were isolated by column chromatography. The yield of compound 1 and compound 2 were 46 and 23.7 mg, respectively. Their physical and chemical characteristics were as follows.
Compound 1 white powder (MeOH)
mp 227 ~ 228°C. ESI-MS m/z 252 [M + H]+. 1H-NMR (DMSO-d 6, 600 MHz) δ: 8.13 (1H, s, H-2), 8.34 (1H, s, H-8), 5.84 (1H, d, J = 2.4 Hz, H-1′), 4.55 (1H, m, H-2′), 2.22 (1H, ddd, J = 13.3, 8.6, 5.9 Hz, Ha-3′), 1.90 (1H, ddd, J = 13.2, 6.5, 3.4 Hz, Hb-3′), 4.34 (1H, m, H-4′), 3.65 (1H, ddd, J = 12.0, 5.5, 3.3 Hz, Ha-5′), 3.51 (1H, ddd, J = 12.0, 5.5, 4.1 Hz, Hb-5′), 5.78 (1H, d, J = 4.3 Hz, 2′-OH), 5.29 (1H, t, J = 5.7 Hz, 5′-OH), 7.26 (2H, brs, N6H2). 13C-NMR (DMSO-d 6, 125 MHz) δ: 152.7 (C-2), 149.0 (C-4), 119.2 (C-5), 156.2 (C-6), 139.5 (C-8), 91.1 (C-1′), 74.9 (C-2′), 34.2 (C-3′), 81.0 (C-4′), 62.8 (C-5′). All these data were consistent with those of cordycepin [42].
Compound 2 white powder (MeOH)
mp 194 ~ 196°C. ESI-MS m/z 312 [M + H]+. 1H-NMR (DMSO-d 6, 400 MHz) δ: 8.19 (1H, s, H-2), 8.32 (1H, s, H-8), 5.85 (1H, d, J = 6.4 Hz, H-1′), 4.57 (1H, dd, J = 11.3, 6.0 Hz, H-2′), 4.12 (1H, m, H-3′), 3.96 (1H, dd, J = 6.5, 3.1 Hz, H-4′), 3.67 (1H, dt, J = 12.1, 3.8 Hz, H-5′), 3.56 (2H, m, H-1"), 3.56 (2H, m, H-2"), 5.44 (1H, d, J = 6.3 Hz, 2′-OH), 5.26 (1H, d, J = 4.65 Hz, 3′-OH), 5.42 (1H, dd, J = 7.1, 4.5 Hz, 5′-OH), 7.66 (1H, brs, N6H), 4.90 (1H, brs, 2"-OH). 13C-NMR (DMSO-d 6, 400 MHz) δ: 152.7 (C-2), 148.5 (C-4), 120.1 (C-5), 154.5 (C-6), 140.2 (C-8), 88.3 (C-1′), 73.9 (C-2′), 70.9 (C-3′), 86.3 (C-4′), 62.0 (C-5′), 42.8 (C-1"), 60.0 (C-2"). All these data were consistent with those of N6-(2-hydroxyethyl)-adenosine [27].
UV absorption spectra
UV–vis absorption measurement is usually used to explore the structural change and compound formation. The UV–vis absorption spectra at about 210 nm represents the α-helical structure of HSA [43]. The effect of cordycepin on UV absorption spectra of HSA is shown in Fig. 3, and that of HEA shown in Fig. 4. The absorbance (208 nm) intensity of HSA increased with the increasing concentration of cordycepin, with an apparent red shift from 208 to 211 nm. The absorbance (206 nm) intensity of HSA increased with the increasing concentration of HEA, with an apparent red shift from 206 to 209 nm.
Fig 3. Effects of cordycepin on HSA by UV spectra.
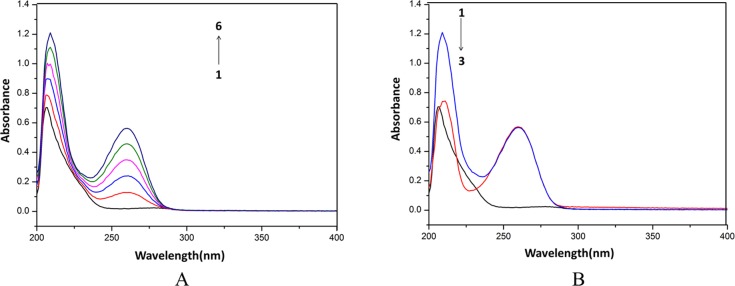
A: The concentration of HSA was 0.5 μM while the cordycepin concentration corresponding to 0, 10, 20, 30, 40 and 50 μM from (1 to 6). B: 1, 0.5 μM HSA + 50 μM cordycepin; 2, 50 μM cordycepin; 3, 0.5 μM HSA.
Fig 4. Effects of HEA on HSA by UV spectra.
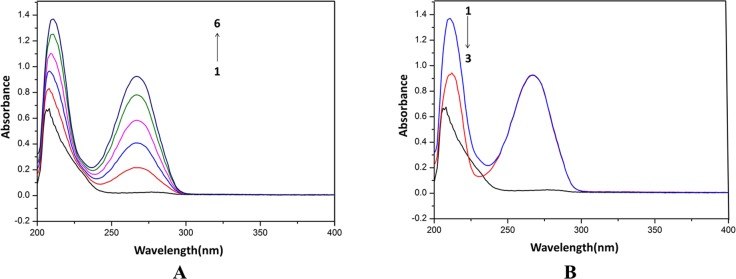
A: The concentration of HSA was 0.5 μM while the HEA concentration corresponded to 0, 10, 20, 30, 40 and 50 μM from (1 to 6). B: 1, 0.5 μM HSA + 50 μM HEA; 2, 50 μM HEA; 3, 0.5 μM HSA.
The shift at 268 nm was not-significant (P<0.05) at the tested concentrations of cordycepin. The increase and red shift of the absorption indicated that the bind of the chemical induced the loosening and unfolding of the protein skeleton and decreased the hydrophobicity of the micro-environment of the aromatic amino acid residue. The UV spectra of cordycepin, HSA and their mixture showed different maximum absorption peaks, suggesting that cordycepin form a HSA-cordycepin complex via reacting with HSA. However, the maximum absorption varied from 208 to 211 nm, demonstrating that cordycepin could affect the conformation of HSA.
The absorbance (206 nm) intensity of HSA increased with an increasing concentration of HEA, with an apparent red shift from 206 to 209 nm. The shift at 260 nm was not-significant (P<0.05) at the tested concentrations of HEA. The increase and red shift of the absorption indicated that the bind of HEA induced the loosening and unfolding of the HSA skeleton and decreased the hydrophobicity of the micro-environment of the aromatic amino acid residue. The UV spectra of HEA, HSA and their mixture showed different maximum absorption peaks, indicating that HEA form a HSA-HEA complex via reacting with HSA.
Fluorescence quenching of HSA by drugs
The effect of cordycepin on fluorescence spectra of HSA is shown in Fig. 5A, and that of HEA in Fig. 5B. The excitation and emission wavelengths were 280 nm and 330 nm, respectively. The results showed that the fluorescence intensity of HSA decreased with the increasing concentrations of cordycepin and HEA, respectively, indicating that both cordycepin and HEA can quench the intrinsic fluorescence of HSA.
Fig 5. Effect of drug on fluorescence spectra of HSA.
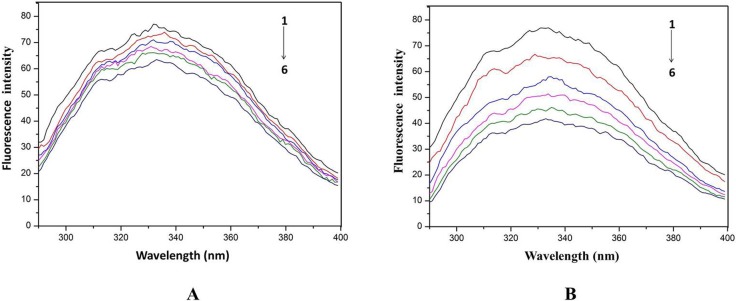
A: Effect of cordycepin on fluorescence spectra of HSA; the concentration of HSA was 1 μM while the cordycepin concentration corresponded to 0, 10, 20, 30, 40 and 50 μM (from 1 to 6). B: Effect of HEA on fluorescence spectra of HSA. The concentration of HSA was 1 μM while the HEA concentration corresponding to 0, 10, 20, 30, 40 and 50 μM (from 1 to 6).
The quenching rate constant of biomacromolecule K q was calculated using Equation 1. The K q values for cordycepin were 4.257×10¹¹, 3.094×10¹¹ and 1.903×10¹¹ L·mol−1·s−1 at 17, 27 and 37°C, respectively (Table 1 and Fig. 6A). The K q values for HEA at 17, 27 and 37°C were 1.695×10¹², 1.352×10¹² and 1.151×10¹² L·mol−1·s−1, respectively (Table 1 and Fig. 6B). The K q values of HSA-cordycepin and HSA-HEA decreased with increasing temperature, and these K q values of HSA-cordycepin and HSA-HEA were all far greater than the maximal collisional quenching rate constant (2×10¹⁰ L·mol−1·s−1) of all classes of the biomolecule, which suggested that both fluorescent quenchings between HSA and cordycepin, and HSA and HEA were caused by static quenching rather than by dynamic collisions.
Table 1. Stern-Volmer equations and quenching constants for fluorescence quenching of HSA by cordycepin and HEA at different temperatures.
| Quenching agent | T/K | F0/F~[Q] equation | K q (×1011 ·L·mol−1·s−1) | R 2 |
|---|---|---|---|---|
| cordycepin | 290 | y = 4.257×10³x +0.9992 | 4.257±0.070 | 0.9998 |
| 300 | y = 3.094×10³x +0.9978 | 3.094±0.076 | 0.9952 | |
| 310 | y = 1.903×10³x +0.9981 | 1.903±0.059 | 0.9980 | |
| 290 | y = 1.695×10⁴x +0.9912 | 16.95±0.277 | 0.9997 | |
| HEA | 300 | y = 1.352×10⁴x +0.9923 | 13.52±0.332 | 0.9984 |
| 310 | y = 1.151×10⁴x +0.9948 | 11.51±0.430 | 0.9974 |
The binding constant (K) and the number of binding sites (n) were calculated following Equation 2. The K values between HSA and cordycepin were 4.227 ×10³, 3.573×10³, 3.076×10³ at 17, 27 and 37°C, respectively (Table 2 and Fig. 7A), indicating that there was a strong binding force between HSA and cordycepin. The n values were 1.0012, 1.0181 and 1.0594 at 17, 27 and 37°C, respectively, suggesting that HSA and cordycepin formed a HSA-cordycepin complex at one binding site.
Fig 6. A: Stern–Volmer plot for cordycepin–HSA at different temperatures; B: Stern–Volmer plot for HEA–HSA at different temperatures.
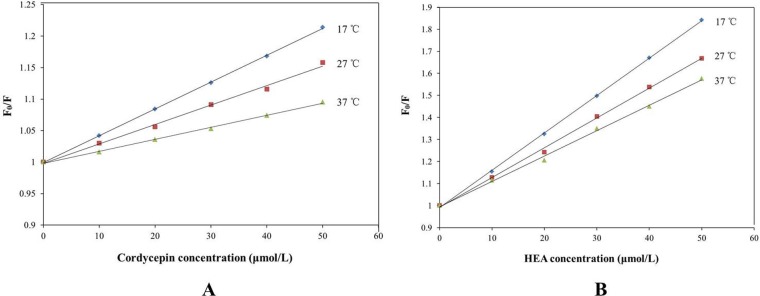
Fig 7. Plot of log [(F0-F)/F] vs log [Q] at different temperatures of cordycepin and has (A); Plot of log [(F0-F)/F] vs log [Q] at different temperatures of HEA and has (B).
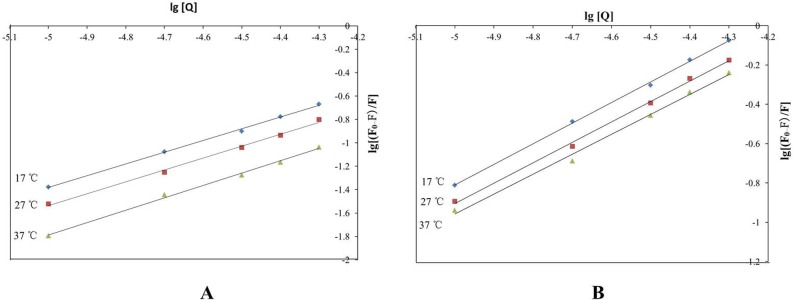
Table 2. K values of HSA at different temperatures.
| Quenching agent | T/K | lg((F0-F)/F)~ lg[Q] | K (×103) | n | R 2 |
|---|---|---|---|---|---|
| cordycepin | 290 | y = 1.0012x +3.626 | 4.227±0.083 | 1.0012 | 0.9982 |
| 300 | y = 1.0181x +3.553 | 3.573±0.193 | 1.0181 | 0.9957 | |
| 310 | y = 1.0549x +3.488 | 3.076±0.085 | 1.0549 | 0.9960 | |
| 290 | y = 1.0488x +4.433 | 27.102±0.272 | 1.0488 | 0.9988 | |
| HEA | 300 | y = 1.0386x +4.288 | 19.409±0.649 | 1.0386 | 0.9976 |
| 310 | y = 1.0144x+4.114 | 13.002±0.310 | 1.0144 | 0.9945 |
The K values between HSA and HEA were 27.102×10³, 19.409×10³, 13.002×10³ at 17, 27 and 37°C, respectively (Table 2 and Fig. 7B), the n values were 1.0488, 1.0386 and 1.0144 at 17, 27 and 37°C, respectively. All these data suggested that HSA and HEA formed a HSA-HEA complex at one binding site with a strong binding force.
Thermodynamic analysis and the nature of the binding forces
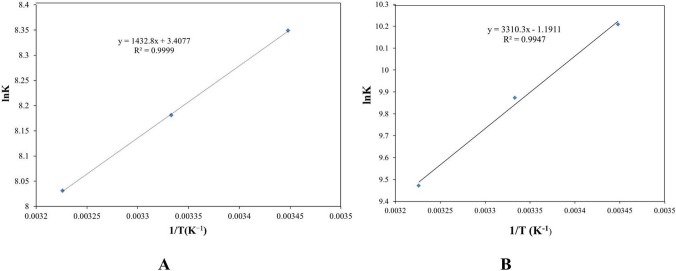
The ΔH, ΔG, and ΔS of the reaction between HSA and various drugs were calculated using Equation (2) and (4) (Table 3 and Fig. 8). The ΔG of HSA and cordycepin at 17, 27 and 37°C were −20.128, −20.412, −20.695 kJ·mol−1, respectively and all the figures were smaller than zero, indicating that the reaction between HSA and cordycepin occurs spontaneously. The ΔH = −11.912 kJ/mol and ΔS = 28.332 J/mol•k (ΔH<0, ΔS>0) suggested that the interacting forces were electrostatic and hydrophobic.
Table 3. ΔH, ΔG, and ΔS of the interaction between cordycepin and HSA, HEA and HSA at different temperatures.
| Quenching agent | T/K | K (×103) | ΔG (kJ·mol−1) | ΔH (kJ·mol−1) | ΔS (J·mol−1·K−1) |
|---|---|---|---|---|---|
| cordycepin | 290 | 4.227±0.083 | −20.128 | −11.912±0.086 | 28.332±0.570 |
| 300 | 3.573±0.193 | −20.412 | |||
| 310 | 3.076±0.085 | −20.695 | |||
| 290 | 27.102±0.272 | −24.650 | |||
| HEA | 300 | 19.409±0.649 | −24.551 | −27.522±0.410 | −9.903±0.639 |
| 310 | 13.002±0.310 | −24.452 |
The ΔG of HSA and HEA at 17, 27 and 37°C were −24.650, −24.551 and −24.452 kJ·mol−1 respectively, which indicated that the reaction between HSA and HEA occurs spontaneously. The ΔH = −27.552 kJ/mol and ΔS = −9.903 J/mol•k (ΔH<0, ΔS<0) demonstrated that the interaction forces are hydrogen bonding and van der Waals force.
Fig 8. ΔH, ΔG, and ΔS of the reaction between cordycepin and has (A).
ΔH, ΔG, and ΔS of the reaction between HEA and has (B).
Though HEA and cordycepin are structurally similar, there are some differences in their structure. HEA has a more hydroxy at the ribose than that of cordycepin, and has a more hydroxyethyl at purine than that of cordycepin, which make their spatial structures different. And the two groups have “O”, which provide HEA having more chances to establish hydrogen with HSA. And the different structure may make different binding site with HSA. So the binding affinity of HEA is greater than cordycepin.
Energy transfer from HSA to drugs
The overlap between the drug absorption spectrum and the HSA fluorescence emission spectrum is shown in Fig. 9. The overlap integral (J) could be assessed by integration with the Metlab program using Equation 8. According to the Forster non-radioactive energy transfer theory (Equations 5–7), the distance between acceptor and donor (r) and the critical energy transfer distance (with a transfer efficiency of 50%, R 0) were calculated.
Fig 9. Stern-Volmer equations and quenching constants for fluorescence quenching of HSA by cordycepin and HEA at different temperatures.
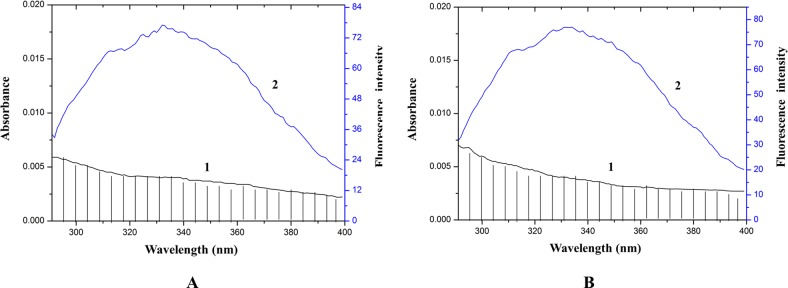
C(cordycepin) = C (HSA) = C (HEA) = 1 μM.
The J of HSA and cordycepin was 0.41213×10⁻¹³ mol−1·cm−1·nm4, E was 0.02594 at 17°C, R 0 and r were 2.90 nm and 5.31 nm respectively. The J of HSA and HEA was 0.42811×10⁻¹³ mol−1·cm−1·nm4, E was 0.03896 at 17°C, R 0 and r were 2.92 nm and 4.98 nm respectively. It was reported that non-radioactive energy transfer occurs between the donor and receptor when the distance between two molecules was smaller than 7 nm [29]. In the present study, the r was smaller than 7 nm at all reaction temperatures, suggesting that non-radioactive energy transfer quenched fluorescence.
Discussion
In this study, two nucleoside analogues compounds, cordycepin and HEA were isolated from CP by column chromatography and identified by NMR. The effect of cordycepin and HEA on biological activity and conformation of HSA were studied, and their interaction mechanisms were tested by fluorescence and UV spectroscopy. The results indicated that both cordycepin and HEA quenched the intrinsic fluorescence of HSA via static quenching, and they bound with HSA to form a complexe with one binding site. The interacting forces between cordycepin and HSA were determined as electrostatic and hydrophobic, however those of HEA and HSA were hydrogen bonding and van der Waals forces. The binding distance r between the drugs and HSA were calculated according to the Forster non-radiative energy transfer theory. In this study, cordycepin was isolated for the first time from CP, and the interaction mechanisms between cordycepin and HSA were also studied for the first time.
CP has been commonly used as a Traditional Chinese Medicine [44]. Cordycepin, a compound with broad significant pharmacological functions, is known to be produced by 12 Cordyceps species [34] and Aspergillus nidulans [45]. CP is a good new source of cordycepin after Cordyceps militaris. The isolation of cordycepin from CP will help in research and establishment of the multiple pharmalogical attributes of this Traditional Chinese Medicine.
HSA is a very important protein in the plasma, which can transport, distribute, store and metabolize many drugs. The studies on the interaction between HSA and drugs can offer information of drug action to understand its distribution and absorption [46–48]. Cordycepin was used in clinical research against leukemia (ClinicalTrials.gov, verified by OncoVista, Inc., 2009), but there was no information about the effect of cordycepin on the biological activity of HSA. In this study, we first studied the interaction mechanisms between cordycepin and HSA, that may provide a substantial theoretical basis for full elucidation of the molecular mechanism of cordycepin transport and help the clinical application of cordycepin.
Cui et al. [28] reported the interaction between HEA and HSA with synthesized HEA. The mechanism of quenching fluorescence was not studied. In our study, we used natural HEA from CP to study the interaction of HEA and HSA. In addition, we studied the mechanism of quenching fluorescence. Cui et al. suggested that the interacting forces between HEA and HSA were hydrophobic and hydrogen bonding, but in our study they were hydrogen bonding and van der Waals forces. One reason for this difference may be the different sources of HEA and HSA used. Another may be different concentration of HSA and HEA used in fluorescence experiment. In our study, 0.5 μM HSA and 10, 20, 30, 40, 50 μM HEA were used, and that of Cui et al. were 0.4 μM HSA and 4.5, 9, 13.5, 18, 22.5 μM HEA.
In this study, cordycepin was isolated for the first time from CP, which will provide a good new source of cordycepin after Cordyceps militaris and enhance the use of this taxon. The interaction mechanisms between cordycepin and HSA may provide a substantial theoretical basis for elucidation of the molecular mechanism of cordycepin transport and help the clinical application of cordycepin. The interaction mechanisms between HEA and HSA is a good supplement for previous studies and a useful supplement for the clinical use of HEA.
Acknowledgments
We want to thank Heng Luo for help on some experiments; Ying Huang, Hualin Wang, Fenhua Liu, Rongyu Li and Chentao Sun for some writing help. We would like to thank the Key Laboratory of Chemistry for Natural Products of Guizhou Province and Chinese Academy of Sciences for the use of the equipment employed in this study.
Data Availability
All relevant data are within the paper.
Funding Statement
This work was supported by the grants from the National Natural Science Foundation of China (NSFC Nos. 30660002 & 31200016), the international collaboration plan of Guizhou province (No. G [2012]7006), the innovation team construction for science and technology of Guizhou province (No. [2012]4007), the Agricultural Science and Technology Foundation of Guizhou province (No. [2011]3054) and the Modernization of Traditional Chinese Medicine Program of Guizhou Province (No. [2012]5008) from the Science and Technology Department of Guizhou province, China. The funders had no role in study design, data collection and analysis, decision to publish, or preparation of the manuscript.
References
- 1. Hywel-Jones NL, “The biological diversity of invertebrate pathogenic fungi”, In: Hyde K.D. (ed.) Biodiversity of tropical microfungi, Hong Kong University Press, Hong Kong, pp. 107–120, 2001. [Google Scholar]
- 2. Hong IP, Nam SH, Jung IY, Sung GB, Nam HW, Chang SJ, et al. (2003) Cultural Characteristics of Mycelial Growth by an Entomologenous Fungus, Cordyceps pruinosa Petch. Korean Journal of Sericultural Science 45. [Google Scholar]
- 3. Xu L, Li CR, Rong YW, Ji LL, Fan MZ (2008) Artificial culture of Cordyceps pruinosa with three kinds of plant hormones addition. Journal of Anhui Agricultural University 1: 020. (In Chinese) [Google Scholar]
- 4. Liu JL, Fei Y (2001) Enhancement of Cordyceps taii polysaccharide and Cordyceps pruinosa polysaccharide on cellular immune function in vitro. Immunol J 17: 189–191. (In Chinese) [Google Scholar]
- 5. Kim KM, Kwon YG, Chung HT, Yun YG, Pae HO, Han JA, et al. (2003) Methanol extract of Cordyceps pruinosa inhibits in vitro and in vivo inflammatory mediators by suppressing NF-κB activation. Toxicology and applied pharmacology 190: 1–8. [DOI] [PubMed] [Google Scholar]
- 6. Cui D (2009) Cordyceps pruinosa for the treatment of inflammatory bowel disease. Iranian Journal of Medical Hypotheses & Ideas 3: 23 10.5455/aim.2014.22.255-258 [DOI] [PubMed] [Google Scholar]
- 7. Kim HG, Song H, Yoon DH, Song BW, Park SM, Sun GH, et al. (2010) Cordyceps pruinosa extracts induce apoptosis of HeLa cells by a caspase dependent pathway. Journal of Ethnopharmacology 128: 342–351. 10.1016/j.jep.2010.01.049 [DOI] [PubMed] [Google Scholar]
- 8. Ju-Hyon L, Soon-Min H, Jun-Yong Y, Hoon M, Myung-Jin K (2011) Anti-cancer effects of cordycepin on oral squamous cell carcinoma proliferation and apoptosis in vitroJ. Journal of Cancer Therapy.2 Article ID:5486,11 pages 10.4236/jct.2011.22029 22468231 [DOI] [Google Scholar]
- 9. Ahn YJ, Park SJ, Lee SG, Shin SC, Choi DH (2000) Cordycepin: selective growth inhibitor derived from liquid culture of Cordyceps militaris against Clostridium spp. J Agric Food Chem. 48: 2744–2748. [DOI] [PubMed] [Google Scholar]
- 10. Lovinger GG, Klein RA, Gilden RV, Hatanaka M (1973) The effect of cordycepin on cell transformation by RNA tumor viruses. Virology 55: 524–526. [DOI] [PubMed] [Google Scholar]
- 11. Zhou X, Luo L, Dressel W, Shadier G, Krumbiegel D, Schmidtke P, et al. (2008) Cordycepin is an immunoregulatory active ingredient of Cordyceps sinensi . The American Journal of Chinese Medicine 36: 967–980. [DOI] [PubMed] [Google Scholar]
- 12. Ren Z, Cui J, Huo Z, Xue J, Cui H, Luo B, et al. (2012) Cordycepin suppresses TNF-α-induced NF-κB activation by reducing p65 transcriptional activity, inhibiting IκBα phosphorylation, and blocking IKKγ ubiquitination. International Immunopharmacology 14:698–703. 10.1016/j.intimp.2012.10.008 [DOI] [PubMed] [Google Scholar]
- 13. Sohn SH, Lee SC, Hwang SY, Kim SW, Kim IW, Ye MB, et al. (2012) Effect of long-term administration of cordycepin from Cordyceps militaris on testicular function in middle-aged rats. Planta Med 78: 1620–1625. 10.1055/s-0032-1315212 [DOI] [PubMed] [Google Scholar]
- 14. Ramesh T, Yoo SK, Kim SW, Hwang SY, Sohn SH, Kim IIW, et al. (2012) Cordycepin (3′-deoxyadenosine) attenuates age-related oxidative stress and ameliorates antioxidant capacity in rats. Experimental Gerontology 47: 979–987. 10.1016/j.exger.2012.09.003 [DOI] [PubMed] [Google Scholar]
- 15. Jin ML, Park SY, Kim YH, Oh J, Lee SJ, Park G (2014) The neuroprotective effects of cordycepin inhibit glutamate-induced oxidative and ER stress-associated apoptosis in hippocampal HT22 cells. Neurotoxicology 41: 102–111. 10.1016/j.neuro.2014.01.005 [DOI] [PubMed] [Google Scholar]
- 16. Cai ZL, Wang CY, Jiang ZJ, Li HH, Liu WX, Gong LW, et al. (2013) Effects of cordycepin on Y-maze learning task in mice. European Journal of Pharmacology 714: 249–253. 10.1016/j.ejphar.2013.05.049 [DOI] [PubMed] [Google Scholar]
- 17. He YT, Zhang XL, Xie YM, Xu YX, Li JR (2013) Extraction and antioxidant property in vitro of cordycepin in artificially cultivated Cordyceps militaris . Advanced Materials Research 750: 1593–1596. [Google Scholar]
- 18. Choi S, Lim MH, Kim KM, Jeon BH, Song WO, Kim TW (2011) Cordycepin-induced apoptosis and autophagy in breast cancer cells are independent of the estrogen receptor. Toxicology and Applied Pharmacology 257: 165–173. 10.1016/j.taap.2011.08.030 [DOI] [PubMed] [Google Scholar]
- 19. Noh EM, Kim JS, Hur H, Park BH, Song EK, Han MK, et al. (2009) Cordycepin inhibits IL-1β-induced MMP-1 and MMP-3 expression in rheumatoid arthritis synovial fibroblasts. Rheumatology 48: 45–48. 10.1093/rheumatology/ken417 [DOI] [PubMed] [Google Scholar]
- 20. Kodama EN, McCaffrey RP, Yusa K, Mitsuya H (2000) Antileukemic activity and mechanism of action of cordycepin against terminal deoxynucleotidyl transferase-positive (TdT+) leukemic cells. Biochemical Pharmacology 59: 273–281. [DOI] [PubMed] [Google Scholar]
- 21. Jeong JW, Jin CY, Park C, Hong SH, Kim GY, Jeong YK, et al. (2011) Induction of apoptosis by cordycepin via reactive oxygen species generation in human leukemia cells. Toxicology in Vitro 25: 817–824. 10.1016/j.tiv.2011.02.001 [DOI] [PubMed] [Google Scholar]
- 22. Vodnala SK, Ferella M, Lunden-Miguel H, Betha E, Reet N, Amin DN, et al. (2009) Preclinical assessment of the treatment of second-stage African trypanosomiasis with cordycepin and deoxycoformycin. PLoS Negl.Trop. Dis. 3: 1–13. [DOI] [PMC free article] [PubMed] [Google Scholar]
- 23. Furuya T, Hirotani MY (1983) N6-(2-hydroxyethyl) adenosine, a biologically active compound from cultured mycelia of Cordyceps and Isaria species. Phytochemistry 22: 2509–2512. [Google Scholar]
- 24. Durcan MJ, Morgan PF (1989) Evidence for adenosine A2 receptor involvement in the hypomobility effects of adenosine analogues in mice. European journal of pharmacology 168: 285–290. [DOI] [PubMed] [Google Scholar]
- 25.Chai YQ, Wei ZM, Chen ZA, Li XL, Liu YG, Wang GE (2006) N6-(2-hydroxyethyl)-adenosine’ application in the preparation of analgesic drugs. China patent No.: ZL200410094511.0. (In Chinese)
- 26. Wang DM, Liu XH, Guo H, Huang JH, Wang L (2013) Design, synthesis and biological activity evaluation of adenosine analogues. Acta Pharmaceutica Sinica 48: 881–886. (In Chinese) [PubMed] [Google Scholar]
- 27. Zhu LN, Xue JJ, Liu YF, Zhou S, Zhang JS, Tang QJ (2013) Isolation, purification and anti-tumor activity of N6-(2-hydroxyethyl)-adenosine from the fruiting body Cordyceps militaris cultured. Acta Edulis Fungi 20: 62–65. (In Chinese) [Google Scholar]
- 28. Cui F, Wang J, Cui Y, Yao X, Qu G, Lu Y (2007) Investigation of interaction between human serum albumin and N6‐(2‐hydroxyethyl)‐adenosine by fluorescence spectroscopy and molecular modelling. Luminescence 22: 546–553. [DOI] [PubMed] [Google Scholar]
- 29. He XM, Carter DC (1992) Atomic structure and chemistry of human serum albumin. Nature 358: 209–215. [DOI] [PubMed] [Google Scholar]
- 30. Ding F, Li N, Han B, Liu F, Zhang L, Sun Y (2009) The binding of C.I. Acid Red 2 to human serum albumin: determination of binding mechanism and binding site using fluorescence spectroscopy. Dyes Pigm 83: 249–257. [Google Scholar]
- 31. Kratz F, Elsadek B (2012) Clinical impact of serum proteins on drug delivery. J Control Release 161: 429–445. 10.1016/j.jconrel.2011.11.028 [DOI] [PubMed] [Google Scholar]
- 32. Bijari N, Shokoohinia Y, Ashrafi-Kooshk MR, Ranjbar S, Parvaneh S, Moieni-Arya M, et al. (2013) Spectroscopic study of interaction between osthole and human serum albumin: Identification of possible binding site of the compound. Journal of Luminescence 143: 328–336. [Google Scholar]
- 33. Hebia C, Bekale L, Chanphai P, Agbebavi J, Tajmir-Riahi HA (2014) Trypsin inhibitor complexes with human and bovine serum albumins: TEM and spectroscopic analysis. J Photoch Photobio B 130: 254–259. [DOI] [PubMed] [Google Scholar]
- 34. Yang T, Dong CH (2011) Cordycepin research and exploitation: progress and problems. Mycosystema 30: 180–190. [Google Scholar]
- 35. Meng ZB, Wen TC, Kang JC, Lei BX, Hyde KD (2014) Cordyceps pruinosa produces cordycepin and N6-(2-hydroxyethyl)-adenosine in culture. Archives of Biological Sciences 66(4): 1411–1421. [Google Scholar]
- 36. Yan ZY, Shao XF, Jiang XM, Hu YZ (2006) Studies on the Reaction of Balofloxacin with Bovine Serum Albumin. Spectroscopy and Spectral Analysis 26: 1494–1498 [PubMed] [Google Scholar]
- 37. Hu YJ, Liu Y, Xiao XH (2009) Investigation of the Interaction between Berberine and Human Serum Albumin. Biomacromolecules 10: 517–521. 10.1021/bm801120k [DOI] [PubMed] [Google Scholar]
- 38. Ross PD, Subramanian S (1981) Thermodynamics of Protein Association Reactions: Forces Contributing to Stability? Biochemistry J. 20: 3096–3102. [DOI] [PubMed] [Google Scholar]
- 39. Zhang GW, Chen XX, Guo JB, Wang JJ (2009) Study on the Interaction of Hesperidin or Icariin with Lysozyme by Fluorescence Spectroscopy. Spectroscopy and Spectral Analysis 29: 184–187 [PubMed] [Google Scholar]
- 40. Agudelo D, Bourassa P, Bruneau J, Bérubé G, Asselin É, Tajmir-Riahi HA (2012) Probing the binding sites of antibiotic drugs doxorubicin and N-(trifluoroacetyl) doxorubicin with human and bovine serum albumins. PloS one 7(8): e43814 10.1371/journal.pone.0043814 [DOI] [PMC free article] [PubMed] [Google Scholar]
- 41. Wang J, Li S, Peng X, Yu Y, Bian H, Huang F, et al. (2013) Multi-spectroscopic studies on the interaction of human serum albumin with astilbin: Binding characteristics and structur alanalysis. Journal of Luminescence 136: 422–429 [Google Scholar]
- 42. Lv ZM, Jiang YT, Wu LJ, Liu K (2008) Chemical constituents of the fruiting body Cordyceps Militaris cultured. China Journal of Chinese Materia Medica 33: 2914–2917. (In Chinese) [PubMed] [Google Scholar]
- 43. He W, Li Y, Xue C, Hu Z, Chen X, Sheng F (2005) Effect of Chinese medicine alpinetin on the structure of human serum albumin. Bioorganic & medicinal chemistry 13: 1837–1845. [DOI] [PubMed] [Google Scholar]
- 44. Liang ZQ, Liu AY, Liu ZY (2007) Fungi in China. Beijing: science press. [Google Scholar]
- 45. Kaczka EA, Trenner NR, Arison B, Walker RW, Folkers K (1964) Identification of cordycepin, a metabolite of Cordyceps militaris, as 3′-deoxyadenosine. Biochemical and Biophysical Research Communications 14: 456–457. [DOI] [PubMed] [Google Scholar]
- 46. Belatik A, Hotchandani S, Bariyanga J, Tajmir-Riahi HA (2012) Binding sites of retinol and retinoic acid with serum albumins. Eur J Med Chem 48: 114–123. 10.1016/j.ejmech.2011.12.002 [DOI] [PubMed] [Google Scholar]
- 47. Sattar Z, Saberi M R, Chamani J (2014) Determination of LMF binding site on a HSA-PPIX complex in the presence of human holo transferrin from the viewpoint of drug loading on proteins. PloS one 9(1): e84045 10.1371/journal.pone.0084045 [DOI] [PMC free article] [PubMed] [Google Scholar]
- 48. Gökoğlu E, Kıpçak K, Seferoğlu Z (2014) Studies on the interactions of 3, 6-diaminoacridine derivatives with human serum albumin by fluorescence spectroscopy. Luminescence 29(7):872–877. 10.1002/bio.2635 [DOI] [PubMed] [Google Scholar]
Associated Data
This section collects any data citations, data availability statements, or supplementary materials included in this article.
Data Availability Statement
All relevant data are within the paper.


