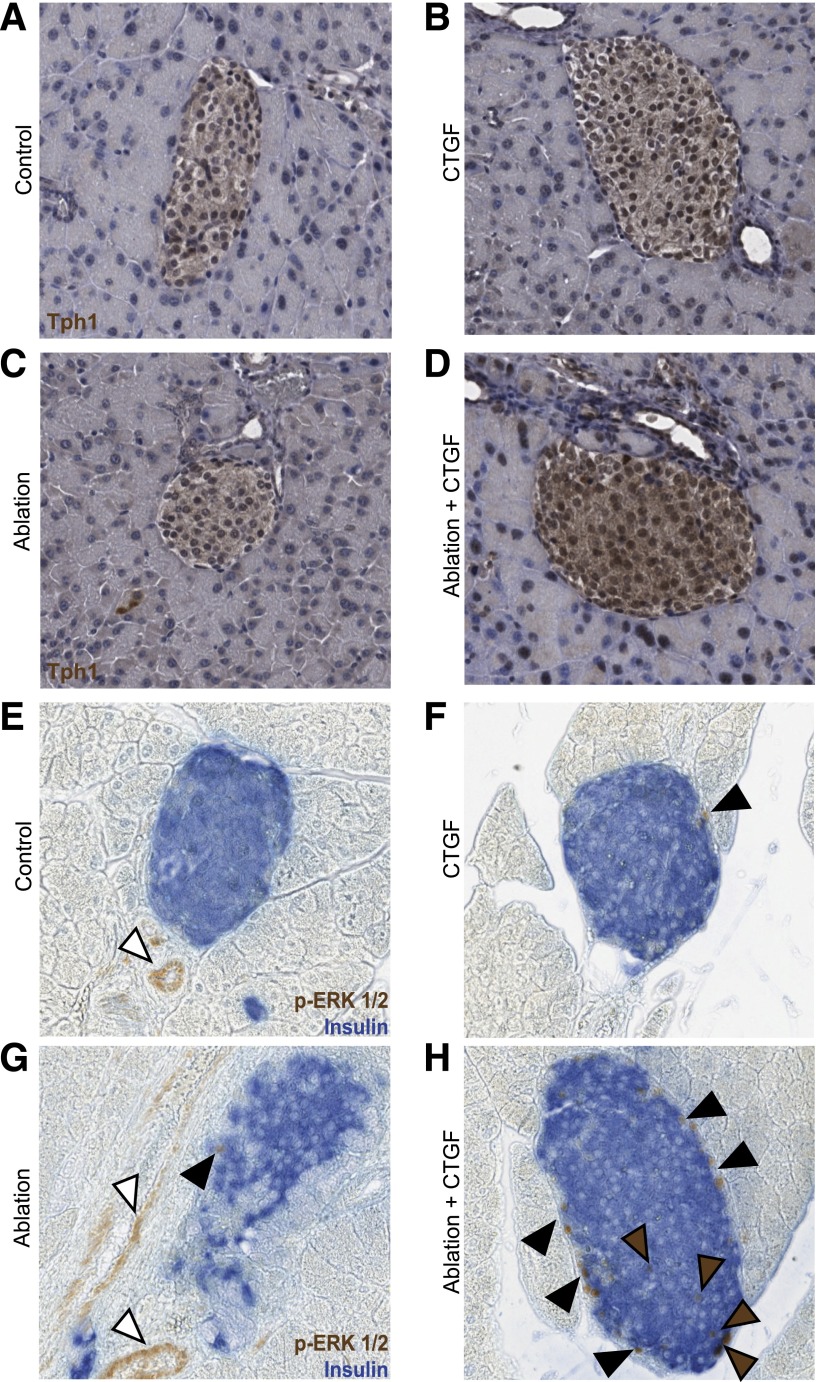
Figure 7.
Alterations in Tph1 expression and ERK1/2 signaling in response to CTGF and/or ablation. A–H: Representative images of islets at 2 days of CTGF.A and E: Control. B and F: CTGF. C and G: Ablation. D and H: Ablation+CTGF. Tph1: Primary antibodies were visualized via a DAB Peroxidase Substrate Kit (Vector Laboratories) and counterstained with hematoxylin. p-ERK1/2: Primary antibodies for p-ERK1/2 and insulin were visualized via a DAB Peroxidase Substrate Kit (Vector Laboratories) and an alkaline phosphatase Vector Blue Substrate Kit (Vector Laboratories), respectively. Brown and black arrowheads demark β-cells or other islet cells with activated ERK1/2 signaling, respectively. White arrowheads demark endothelial cells with activated ERK1/2 signaling. n = 4 for Tph1 and n = 3 for p-ERK1/2.

