Summary
Loss of photoreceptors during retinal degeneration leads to blindness, but information can be reintroduced into the visual system using electrical stimulation of the remaining retinal neurons. Subretinal photovoltaic arrays convert pulsed illumination into pulsed electric current to stimulate the inner retinal neurons. Since required irradiance exceeds the natural luminance levels, an invisible near-infrared (915nm) light is used to avoid photophobic effects. We characterized the thresholds and dynamic range of cortical responses to prosthetic stimulation with arrays of various pixel sizes and with different number of photodiodes. Stimulation thresholds for devices with 140µm pixels were approximately half those of 70µm pixels, and with both pixel sizes, thresholds were lower with 2 diodes than with 3 diodes per pixel. In all cases these thresholds were more than two orders of magnitude below the ocular safety limit. At high stimulation frequencies (>20Hz), the cortical response exhibited flicker fusion. Over one order of magnitude of dynamic range could be achieved by varying either pulse duration or irradiance. However, contrast sensitivity was very limited. Cortical responses could be detected even with only a few illuminated pixels. Finally, we demonstrate that recording of the corneal electric potential in response to patterned illumination of the subretinal arrays allows monitoring the current produced by each pixel, and thereby assessing the changes in the implant performance over time.
1. Introduction
Electrical stimulation of the retina enables introduction of information into the visual system of patients blinded by retinal degeneration, thereby restoring light sensitivity and, to a limited extent, some visually guided behavior [1–5]. However, systems currently approved for human use offer poor spatial resolution (typically below 20/1200) and include an extra-ocular power supply wired to the retinal implant, which requires very complex surgery with considerable risk of serious adverse events [2, 3].
We developed a completely wireless subretinal prosthesis powered by bright near-infrared (NIR) illumination, in which photovoltaic pixels convert pulses of light into pulsed electrical current and stimulate the nearby inner retinal neurons. In this strategy images are projected onto the implant with NIR light by means of a near-theeye display (video goggles) [6]. Using photovoltaic pixels producing cathodic-first pulses of current, this technology has been shown to provide efficient retinal stimulation at safe irradiance levels in healthy retinas and in rats blinded by retinal degeneration, both in-vitro and in-vivo [7, 8].
It was recently established that anodic-first pulses of current have lower thresholds and higher selectivity for stimulation of the inner retinal neurons, compared to cathodic-first pulses [9]. We therefore developed a new version of the implant with pixels producing anodic-first biphasic pulses. Here we describe such devices having pixels of 140µm and 70µm width, consisting of 2 or 3 photodiodes in series. These arrays were tested in normally-sighted rats (Long Evans, WT) and in rats with retinal degeneration (Royal College Surgeons, RCS). Stimulation thresholds, dynamic range, frequency dependence and contrast sensitivity of such prosthetic vision were assessed by recording visually evoked potentials in anesthetized animals.
Over time the implants can fail, electrodes may erode, and tissue may develop a fibrotic seal. Therefore, an ability to monitor performance of each pixel in the implant is of great benefit. Since our implants are completely wireless and do not have any active circuitry for reverse telemetry, it is not possible to directly measure impedance and capacitance of individual electrodes in order to monitor their performance over time. However, recording the waveforms of electrical stimulation on the cornea using conventional electro-retinogram (ERG) electrodes allows assessment of the pixels’ performance over time. To improve the signal-to-noise ratio and allow detection of individual pixels we developed and tested a technique similar to multifocal ERG.
2. Materials and Methods
2.1. Photovoltaic implants
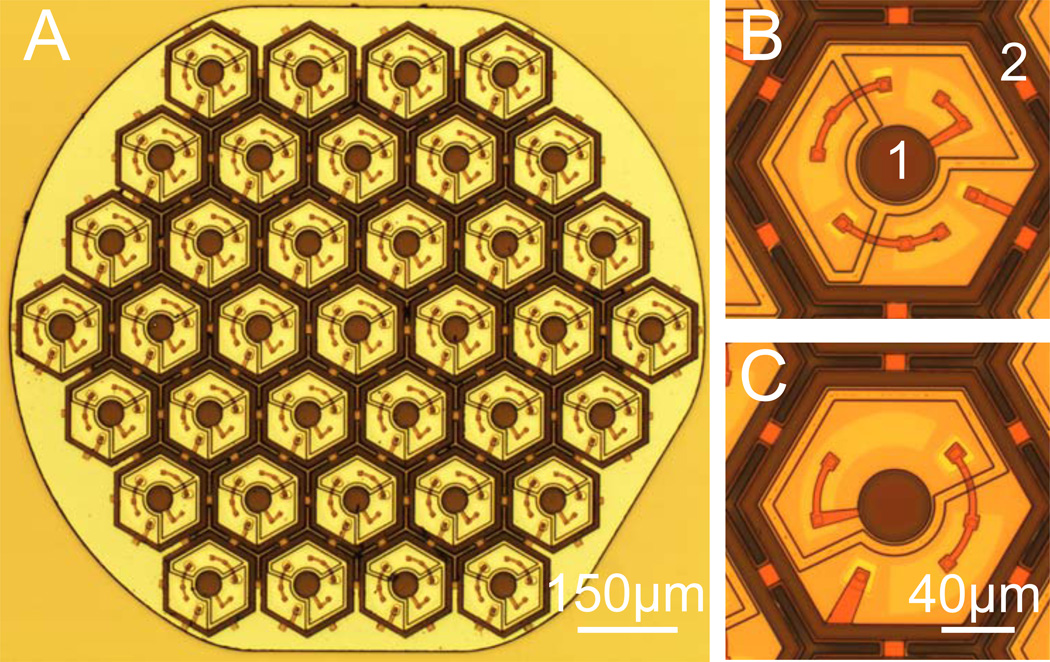
The photovoltaic implants in this study were 1mm in diameter and 30µm in thickness, composed of 70µm or 140µm-wide pixels, separated by 5µm-wide trenches (Fig. 1A). The fabrication process was similar to the one described by Wang et al. [10] for cathodic polarity, with the n-doped and p-doped regions reversed, in order to produce anodic-first pulses. In these pixels, 2 or 3 diodes are connected in series between the active disc electrode (20 and 40µm in diameter for 70 and 140µm pixels, respectively) and a circumferential ring return electrode of 5µm or 8µm in width, respectively (Fig. 1B), producing well-confined electric fields, with low cross-talk between neighboring pixels.
Fig. 1. Photovoltaic arrays.
A) Light micrograph of the implant with 140µm pixels (37 pixels total). The 1mm disk-shaped implant has 3 flat facets to help define its orientation (face up or down) during implantation. B) Three-diode pixel composed of the 40µm diameter active electrode (1) and the return electrode ring (2). The 3-diodes are connected in series between the electrodes. C) Two-diode pixel with the same design. The total photodiode area is larger than in the 3-diode device but provides 2/3 of the peak voltage [15].
Passive plastic (SU8) implants of similar dimensions were used for histological assessment of the effects of the subretinal implant on surrounding tissues.
2.2. Surgeries
All experimental procedures were conducted in accordance with the institutional guidelines and conformed to the Statement for the Use of Animals in Ophthalmic and Vision research of the Association for Research in Vision and Ophthalmology (ARVO) and in accordance with the Code of Ethics of the World Medical Association (Declaration of Helsinki). Wild type (WT) Long-Evans adult rats (n=18, P40) were purchased from Charles River Farm (Wilmington, MA, USA). All animals were housed in an environment with a 12-h light/12-h dark cycle with food and water ad libitum. Rats with retinal degeneration were obtained from a Royal College of Surgeons (RCS) colony maintained at the Stanford Animal facility (n=10, P45–60).
For surgeries, animals were anesthetized with Ketamine (75mg/kg) and Xylazine (5mg/kg) delivered by intramuscular injection. Subretinal implantations were performed as previously described [8]. Briefly, the sclera and choroid were incised to create a retinal detachment using saline solution, and the implant was inserted into the subretinal space. The incision was then sutured and treated with a local antibiotic (Bacitracin/Polymyxin B). In animals implanted with active devices (15WT and 7RCS) cortical screw electrodes were implanted over the visual cortex on both hemispheres 4mm lateral from midline, 6mm caudal to the bregma, as previously described [8] to measure visually evoked potentials (VEP).
2.3. In-vivo imaging
To control the success of the subretinal implantation and assess the health of the retina above the implant, we conducted optical coherence tomography (OCT) and fluorescence angiography (FA) one week after implantation (HRA2-Spectralis, Heidelberg Engineering, Heidelberg, Germany).
2.4. Histology
For histology, 6 of the 28 animals were used (3WT and 3RCS). One eye per animal was implanted with passive SU8 implants, enucleated after five weeks, and processed for light microscopy. Eyes were fixed in 1.25% glutaraldehyde, 1% paraformaldehyde fixative prepared in 0.1M sodium cacodylate buffer with 5mM calcium chloride and 5% sucrose for 24 hours at room temperature. Lenses were removed and eyes were trimmed to a block size and postfixed in 2% aqueous osmium tetroxide for two hours at room temperature. Tissue was then dehydrated in graded alcohol, infiltrated with propylene oxide and epoxy (Araldite/Embed EMS), embedded in pure epoxy and polymerized at 60°C for 24h. Thin sections (1µm) were taken (Ultracut E, Leica, Deerfield, IL), stained with 0.5% toluidine blue, and slides were examined under a light microscope.
2.5. Optical stimulation system
Implanted rats were stimulated with pulsed NIR light (915nm) projected onto the photovoltaic chip or with visible light (532nm) projected outside of the implanted area. The light was collimated and directed onto a digital micromirror display (DMD, LightCommander module, Texas Instruments) to create images that were focused on the implant. The optical system was mounted onto a slit lamp (Zeiss SL–120) to allow observation of the beam on the retina, and a NIR-sensitive charge-coupled-device (CCD) camera (Balser piA640–210gm) was used to visualize the beam position relative to the implant.
2.6. VEP and corneal voltage recordings
Recordings started 2 weeks after the subretinal implantation. Animals were lightly anesthetized (ketamine: 35mg/kg, xylazine: 2.5mg/kg) and placed in front of the optical system. The pupil was dilated, and refraction on the corneal surface was cancelled by applying a viscoelastic gel and a coverslip onto the surface of the eye. The electric potential produced on the cornea by photovoltaic stimulation was monitored using a corneal wire electrode. The ground and reference electrodes were inserted in the tail and nose, respectively. Cortical potentials were recorded between the two hemispheres. Signals were acquired at 1kHz and band-pass filtered between 1.25 and 500Hz with an Espion E2 system (Diagnosys Inc, Lowell, MA). Over the course of a recording session, half a dose of anesthetic was applied every 40min or as needed to maintain steady anesthesia. The body temperature was maintained at 37° with a heating pad and recording sessions were limited to 2 hours.
For the threshold measurements, 10ms pulses of light were applied at 2Hz repetition rate at the following irradiances [0.06, 0.13, 0.25, 0.5, 1, 2, 4 mW/mm2]. Stimulation thresholds were defined as the lowest intensity generating a VEP amplitude 6 times above noise. The latter was defined as the standard deviation of the signal during the 50ms preceding the stimulus.
Dependence of the VEP on pulse duration was measured using pulses of constant irradiance (2mW/mm2 and 4mW/mm2 for 140µm and 70µm pixels, respectively) and varying the duration from 1 to 20ms at 2Hz repetition rate.
Dependence of the VEP on the size of the illuminated zone was assessed on 70µm pixel devices using round spots with diameter varying between 60µm and 1mm. In these measurements the irradiance was kept at 4mW/mm2, pulse duration at 10ms, and repetition rate at 2Hz.
Frequency responses were obtained by varying pulse frequency from 2Hz to 64Hz with 4ms pulses using irradiance of 4mW/mm2 for NIR and 100nW/mm2 for visible light.
Contrast sensitivity was measured by varying irradiance in steps of 500ms in duration, with 4ms pulses applied at 40Hz carrier frequency. The peak irradiance levels transitioned between Imin and Imax to produce contrasts (Imax −Imin)/ (Imax +Imin) varying from 0% to 100% and keeping the mean peak irradiance (Imax +Imin)/2 at 2mW/mm2.
2.7. Multifocal analysis of the corneal signal
To measure contributions to the corneal signal coming from various parts of the implant, we stimulated it with 20ms pulses at 4mW/mm2 irradiance using a spatio-temporal random binary noise varying at 4Hz. The size of a single square in the pattern was 250µm. The signal corresponding to each stimulation square of the pattern was reconstructed using a conventional multifocal algorithm [11]. Briefly, for each pixel of the display, the signal was added when the pixel was white and subtracted when it was black. For the amplitude map reconstruction, the signal amplitude was measured peak-to-peak.
3. Results
3.1. Subretinal implantation creates local retinal degeneration
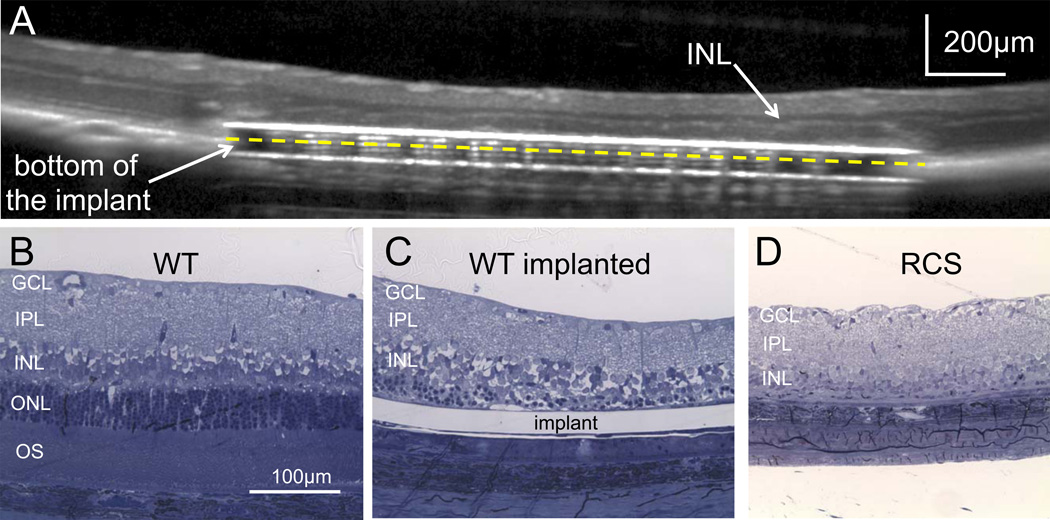
Photovoltaic arrays were implanted in the subretinal space of normally-sighted (WT) rats and in rats with retinal degeneration (RCS). One week after surgery, we observed with optical coherence tomography (OCT) a start of thinning of the outer nuclear layer above the implant in WT rats. Photoreceptors outside the implant remained intact (Fig. 2A).
Fig. 2. Subretinal implantation triggers local retinal degeneration in WT rats.
A) Optical coherence tomography (OCT) image of the implanted eye in a WT animal reveals the subretinal positioning of the prosthesis. The inner retinal layer (INL) is well preserved while the outer retinal layer degenerates above the implant, thus creating a model of local retinal degeneration. B) Histology of the WT retina next to the implanted area showing normal outer segments (OS), outer nuclear layer (ONL), inner nuclear layer (INL), inner plexiform layer (IPL) and ganglion cell layer (GCL). C) Representative histology of the same retina above the implant, showing a loss of photoreceptors five weeks after implantation. However, the inner nuclear layer and ganglion cell layer are preserved. This phenomenon was reproducible in all 3 animals implanted with passive devices. D) Retina of an RCS rat, 10 weeks post-natal, has no outer segments and photoreceptor nuclei, but the inner retina is preserved.
To better characterize this process, we implanted plastic (SU8) models of the arrays with the same dimensions (1mm wide and 30µm thick), and performed histology five weeks after implantation. Outside of the implanted area, the retina remained intact (Fig. 2B). Presence of an implant in subretinal space resulted in complete degeneration of the photoreceptor outer segments and only a few photoreceptor nuclei were still visible (Fig. 2C). Photoreceptor death is likely due to permanent separation of the retina from the pigment epithelium. This phenomenon creates a model of local retinal degeneration in wild type animals. Cells in the inner nuclear layer were found in close proximity to the implant, similarly to conditions in the RCS rat retina with natural degeneration (Fig. 2D). In RCS rats, retina above the implant appeared similar to the tissue outside the implanted area [12], indicating that presence of the implant does not affect the degenerate retina.
3.2. Implant diagnostics using corneal recording
The wireless nature of the photovoltaic pixels does not allow physical access to its electrodes, thus precluding direct measurements of the electrode impedance and capacitance. To circumvent this limitation we measured the electrical signal produced by the implant on the surface of the cornea, thereby indirectly monitoring the functional condition of the electrodes after implantation. Monitoring the changes in the shape and amplitude of this electrical signal after implantation can be used to assess the modifications in charge delivery by various pixels over time.
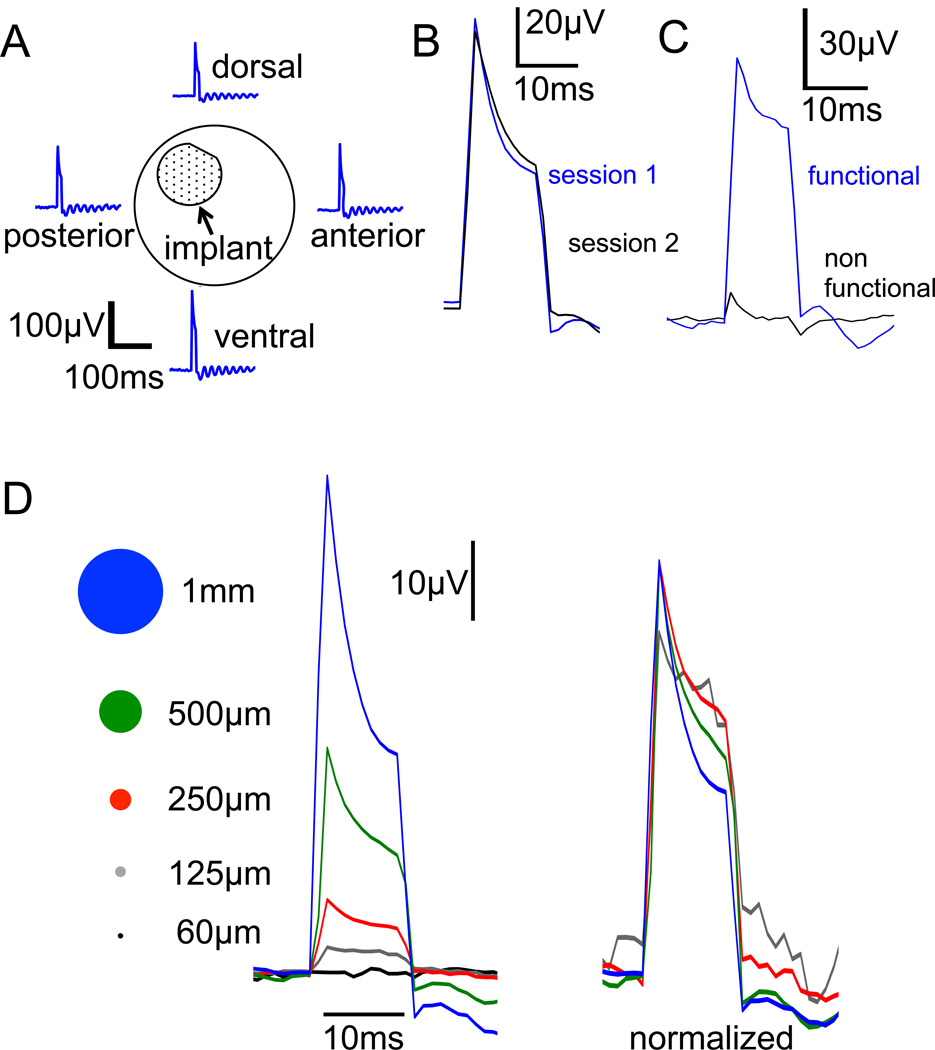
The signal did not change with position of the recording electrode on the cornea (Fig. 3A), and was reproducible across subsequent recording sessions (Fig. 3B). The mean peak amplitude for the full-implant stimulation was 143µV (±12µV SEM). Dysfunctional implants were rare, and they produced much shorter and weaker pulse of electric current – insufficient for retinal stimulation, as illustrated in Fig. 3C.
Fig. 3. Monitoring the subretinal stimuli via corneal electrodes.
A) Pulses of electric current (10ms) produced by the implant were recorded by an electrode placed on the cornea. Their amplitude and shape do not change with position of the recording electrode (dorsal, ventral, nasal and temporal recordings are shown here). B) Corneal potential measurements were reproducible in consecutive sessions: waveforms 1 and 2 were recorded one week apart. C) Example of the signal from a dysfunctional 2-diode 140µm pixel device (black line) compared to a normal pixel of the same configuration (blue). This device did not elicit any cortical activity. D) Corneal signal increases with increasing spot size on the retina. With 70µm pixels, the stimulation signal could be detected with a spot size as small as 125µm in diameter, which enables evaluation of a single (or at most two) pixels in the array.
The corneal signal decreased with decreasing size of the illuminated area (Fig. 3D). In arrays with 70 µm pixels, a corneal signal was detectable with a spot size 125µm in diameter, which corresponds to illumination of one or two pixels. This demonstrates that single (or at most 2) 70µm pixels could be evaluated in the implanted array - an important feature in the context of clinical trials follow-up.
3.3. Multifocal stimulation of the implant
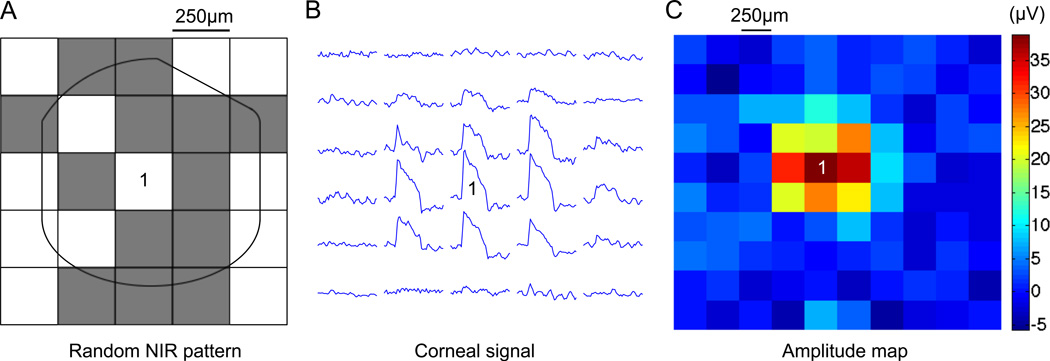
To speed-up diagnostics of large arrays, we used a semi-automated method similar to multifocal ERG [11, 13]. Contributions of individual regions on the implant were measured by correlating the corneal response to the random checkerboard patterns projected onto the implant (Fig. 4A and Methods). This method is commonly used in multifocal ERG to probe local retinal sensitivity to light. This paradigm allows extracting the waveforms generated locally by the implant (Fig. 4B) and reconstructing the stimulus amplitude map (Fig. 4C). The spatial spread of the signal could appear larger than the actual size of the implant due to eye motion. This technique allows mapping the entire implant in a few minutes, thereby monitoring its performance, as well as possible local changes in the tissue impedance over time.
Fig. 4. Multifocal analysis of the corneal signals.
A) Implant activated by a spatiotemporal binary noise pattern to extract signals from various regions of the chip. B) The correlation of the corneal signal with the luminance of each square of the checkerboard pattern allows mapping local contributions of the implant (see Methods). Checkerboard pixel number 1 in panel A generates the associated signal (1). C) Amplitude maps can be drawn to assess the status of the implant in-vivo over time. Here, 250µm checkerboard patterns represent the implant response in-vivo.
3.4. Modulation of cortical response
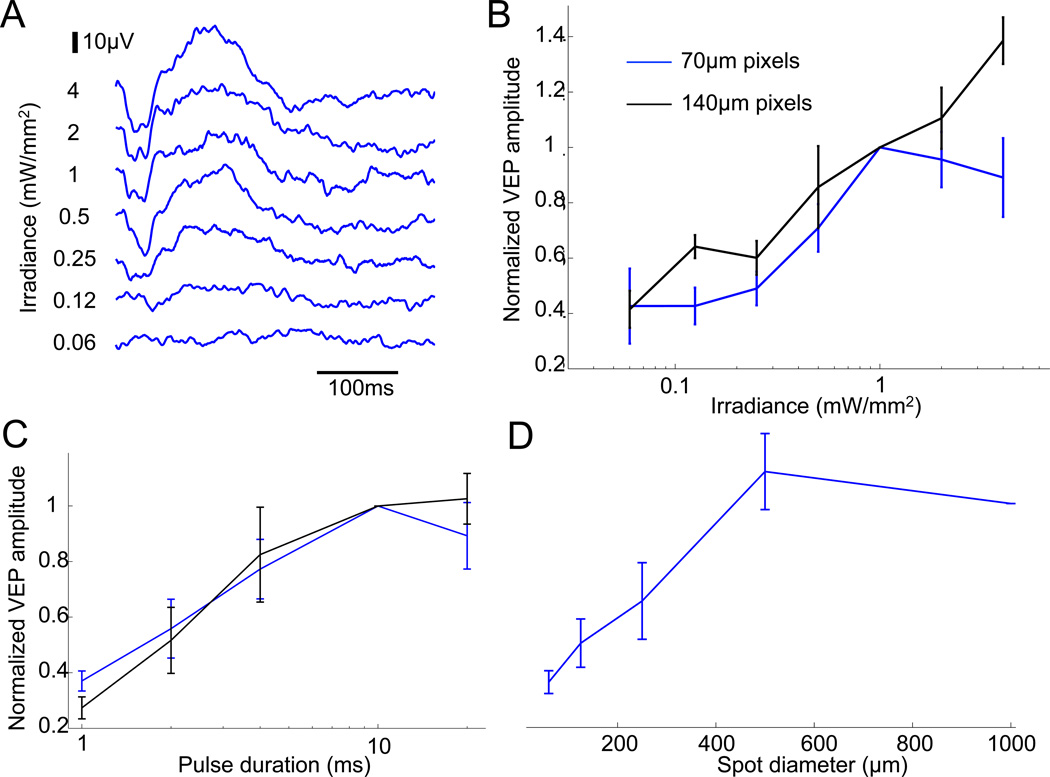
Stimulation thresholds were measured by recording the cortical responses to pulsed NIR light in rats implanted with arrays having 70µm and 140µm pixels composed of 2 or 3 photodiodes (see Methods). Irradiance varied from 0.06 to 4mW/mm2, while keeping constant pulse duration of 10ms and repetition rate of 2Hz (Fig. 5A). Stimulation threshold was about twice lower with 2-diode devices than with 3-diode devices for both pixel sizes. Out of these four types of pixels, the threshold was lowest for 140µm pixels with 2 diodes - 0.13mW/mm2, and the highest for 70µm pixels with 3 diodes - 0.78mW/mm2 (Table 1).
Fig. 5. Modulation of VEP responses by irradiance, duration and spot size.
A) Amplitude of the VEP signal is modulated by pulse irradiance from 0.06 to 4mW/mm2, keeping a constant pulse duration of 10ms. B) Devices with 70µm pixels (blue) elicit a VEP response at 0.25mW/mm2, which increases up to 1mW/mm2, and saturates beyond that level. The 140µm pixels (black) have lower thresholds and do not saturate at high irradiance. C) VEP amplitude increases with pulse duration between 1 and 10ms, and saturates with longer pulses (with 2 and 4mW/mm2 irradiance for 140µm and 70µm pixel devices, respectively). D) VEP amplitude increases with larger spot sizes on the implant, and saturates beyond 500µm. Response can be detected with a spot diameter as small as 125µm.
Table 1. Irradiance thresholds for cortical activation.
Thresholds were lower with larger pixels, and the 2-diode devices had a threshold half that of the 3-diode devices with both pixel sizes (70µm and 140µm).
| 70µm – 2 diodes | 70µm – 3 diodes | 140µm – 2 diodes | 140µm – 3 diodes |
|---|---|---|---|
| 0.33±0.05mW/mm2 (n=8, 4WT, 4 RCS) | 0.78±0.1mW/mm2 (n=8, 5 WT, 3 RCS) | 0.13mW/mm2 (n=2, WT) | 0.25±0.09mW/mm2 (n=4, WT) |
With 140µm pixels, the response increased with irradiance over the whole range of modulation, from 0.06 to 4mW/mm2 (Fig. 5B). However, with 70µm pixels, it saturated for irradiances exceeding 1mW/mm2.
In contrast, modulation of the cortical response by pulse duration (from 1 to 20ms) at constant irradiance was similar for both pixel sizes (Fig. 5C). The normalized VEP response increased over one order of magnitude from 1ms to 10ms, and saturated at longer pulse durations.
Amplitude of the cortical response increased linearly with the illumination spot diameter from 60µm to 500µm, but did not increase further with 1mm spots. Although only one to two pixels were stimulated with 125µm spots, it was sufficient to evoke reliable eVEP responses in 2 out of 6 animals.
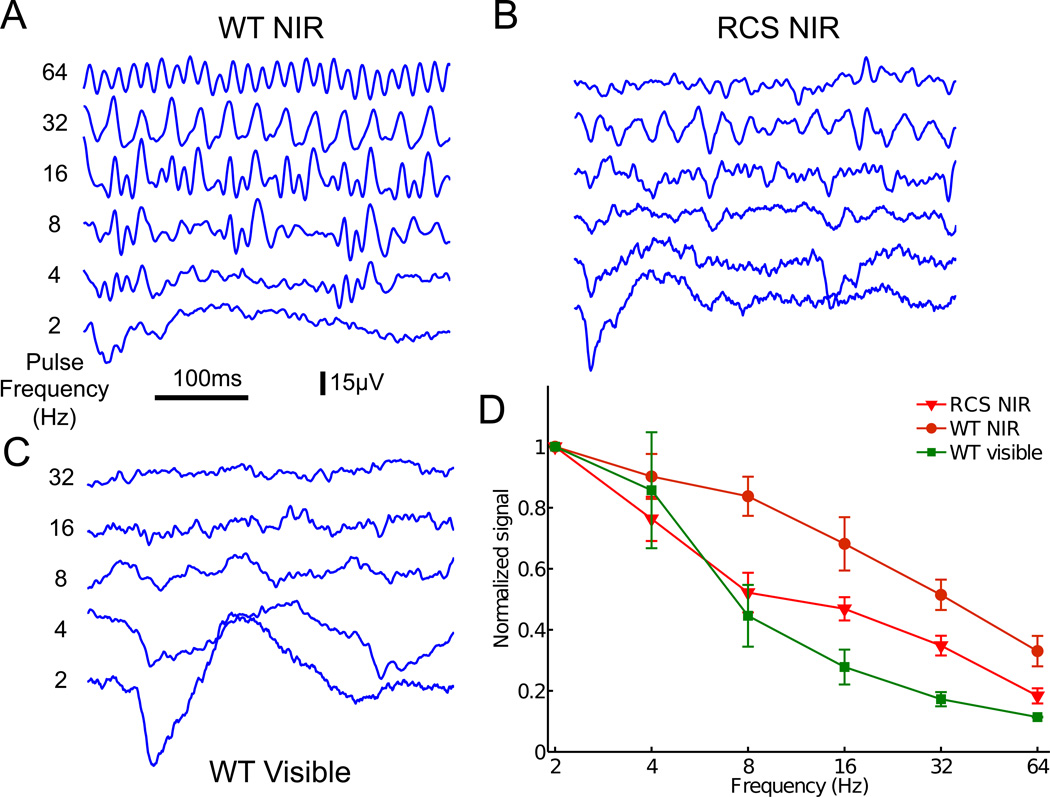
Additionally, eVEP responses decreased with increasing frequency of photovoltaic stimulation in both WT (Fig. 6A) and RCS rats (Fig. 6B), although not as fast as the visible light responses (Fig. 6C and D). Response to photovoltaic stimulation in RCS rats declined with increasing frequency faster than in the WT animals, as can be seen in Fig. 6D. Similarly to normal vision, reduced response to high frequency stimulation at constant amplitude represents flicker fusion and adaptation to constant irradiance.
Fig. 6. Frequency dependence.
A–B) Cortical responses to NIR stimulation at various frequencies in WT (A) and RCS (B) rats. C) Responses to a similar stimulation protocol by visible light in a WT animal. D) VEP amplitude decreases with increasing frequency of NIR stimulation in WT and RCS rats, similarly to the natural visible light response. However, in WT rats, the cortical activity elicited by the implant follows higher frequencies than in RCS rats.
3.5. Contrast sensitivity
To assess contrast sensitivity, we modulated the irradiance in steps of 500ms in duration, while keeping a constant pulse width of 4ms and repetition rate of 40Hz. The contrast varied between 0 and 100% with a mean peak value of 2mW/mm2 (Fig. 7A and Methods). A corneal electrode was used to measure the photocurrent generated by the implant.
Fig. 7. Contrast sensitivity with prosthetic stimulation.
A) Irradiance contrast was varied in steps every 500ms, with 4ms pulses applied at 40Hz. The corresponding waveforms were recorded on the cornea. B) VEP responses to various steps of contrast. C) VEP amplitude increases with increasing contrast, but only 100% contrast elicited responses statistically different from the noise level.
Amplitude of the VEP response increased with increasing contrast modulation, as shown in Fig. 7B. However, due to high noise, only 100% contrast triggered responses significantly above the noise level (p<0.05, paired t-test, Fig. 7C). Stronger cortical responses likely correspond to enhanced perception of the stimuli with higher contrast, but from these measurements it is not clear how many levels of gray will be resolvable perceptually by human patients.
4. Discussion
Our previous study described the characteristics of subretinal photovoltaic stimulation with implants producing cathodic-first pulses of current [8]. However, recent in-vitro measurements demonstrated that anodic-first pulses have lower stimulation thresholds and better selectivity for the network-mediated retinal response than cathodic-first pulses [14]. Here, we confirmed this effect in-vivo: for 140µm pixels with 3 diodes, the threshold for anodic (0.25±0.09mW/mm2) was 4 times lower than for cathodic implants (1.0±0.3mW/mm2). For 70 µm pixels with 3 diodes the threshold for anodic devices (0.78±0.1mW/mm2) was 2.7 times lower than for cathodic implants (2.05±0.23mW/mm2)[8]. Additional decrease in stimulation thresholds has been achieved with 2-diode pixels: their thresholds were about twice lower than with 3 diodes for both pixel sizes: 0.13 and 0.33mW/mm2 for 140 and 70µm pixel devices respectively, although the 0.13mW/mm2 value was only derived from 2 animals. Similarly to cathodic implants [8], thresholds were similar between WT and RCS implanted animals and the two groups were pooled together in the analysis.
These thresholds are more than two orders of magnitude below the ocular safety limits for NIR radiation [15]. Lower stimulation thresholds correspond to reduced brightness requirements from the video goggles, expanding the safe dynamic range of its operation and helps miniaturize the light source and the battery, but also offers the possibility to reduce further photodiodes and pixel sizes to offer higher spatial resolution. All of these are important benefits for practical implementation of this system. Decrease in stimulation threshold with increasing pixel size can be attributed to increasing size of the stimulating electrode (20µm vs. 40µm diameters) and increasing area of the photodiodes collecting the NIR light.
The dynamic range of modulation of the cortical response by irradiance or by pulse duration extended over one order of magnitude for implants with 70µm pixels. With 140µm pixels, cortical responses could be modulated over a wider range of irradiances (two orders of magnitude), possibly due to the higher charge injection capability of larger electrodes. Therefore, with larger pixels, reduced spatial resolution is traded for a wider dynamic range of stimulation, and therefore possibly a higher number of resolvable gray levels.
The network-mediated stimulation of degenerate retinas preserves some important features of normal vision such as flicker fusion at high frequencies, and adaptation to static images: at sufficiently high stimulation frequency (>20 Hz) and constant amplitude the cortical responses to individual pulses are greatly diminished, or even disappear completely. In this regime, however, cortical response can be elicited by slow variation of either the irradiance or pulse duration.
The wireless nature of photovoltaic implants greatly simplifies the implantation procedure and eliminates the risk of complications associated with trans-scleral cables used in other devices [1–3]. Although the lack of physical access to electrodes prevents the direct measurement of their properties, such as capacitance and impedance, electrical signals corresponding to injected current can be recorded on the cornea, even from a single or very few 70µm pixels (with 125µm NIR spots). These signals can be detected using regular ERG electrodes; they are not sensitive to variation in electrode position and are reproducible between experiments. Multifocal activation of pixels with patterned light enables simultaneous recording of contributions from various regions of the implant. This technique, similar to multifocal ERG, could be used in clinical trials for evaluation of the pixel properties to detect potential electrode failures or fibrotic encapsulation.
Finally, the fact that a 125µm diameter spots could evoke detectable cortical activity suggests that as few as one or two 70µm pixels might be able to create visual percepts in human patients.
5. Conclusions
Photovoltaic subretinal implants with anodic-first pulse polarity and 2 diodes per pixel can evoke cortical activity with stimulation thresholds of 0.13mW/mm2 for 140µm pixels, and 0.33mW/mm2 for 70µm pixels, using 10ms pulses. Pixels consisting of 3 photodiodes have thresholds twice higher than the 2-diode devices. These thresholds considerably improved compared to the 3-diode cathodic devices reported previously [8] (1.0 and 2.05mW/mm2 for 140µm and 70µm pixel devices, respectively).
Amplitude of the cortical response can be modulated by pulse duration or by irradiance over an order of magnitude. Devices with larger pixels have a wider dynamic range when modulated by irradiance, but not when modulated by pulse width. Similarly to normal vision, cortical response exhibits flicker fusion at high frequencies, and adapts to constant irradiance. With such stroboscopic illumination, visual information can be conveyed by slower modulation of the irradiance or pulse duration. Finally, the charge injection by the implants, down to the pixel level, can be monitored remotely in vivo, by recording the voltage waveforms on a corneal electrode.
Photovoltaic anodic subretinal implants can reliably evoke cortical activity in rats.
Stimulation thresholds are lowest for 2-diode devices and far below safety limits.
Cortical response amplitude can be modulated by pulse duration and intensity.
Flicker fusion occurs at stimulation rates above 20Hz similar to normal vision.
State of the electrodes after implantation can be monitored by corneal recordings
Acknowledgments
We would like to thank Drs. D. Boinagrov, M.F. Marmor and S. Picaud for stimulating discussions and encouragement, as well as Dr. J. Liao for sharing the VEP recording system. Funding was provided by the National Institutes of Health (grant R01-NEI-018608), the Air Force Office of Scientific Research (grant FA9550-04), NIH CTSA (award UL1 RR025744), and the Stanford Spectrum fund. K.M. was supported by an SU2P fellowship as part of an RCUK Science Bridges award. H.L. was supported by the Foundation Voir et Entendre (Paris).
Abbreviations
- VEP
Visually Evoked Potential
- RCS
Royal College Surgeon
- LE
Long Evans
- NIR
Near Infrared
- SEM
Standard error of the mean
Footnotes
Publisher's Disclaimer: This is a PDF file of an unedited manuscript that has been accepted for publication. As a service to our customers we are providing this early version of the manuscript. The manuscript will undergo copyediting, typesetting, and review of the resulting proof before it is published in its final citable form. Please note that during the production process errors may be discovered which could affect the content, and all legal disclaimers that apply to the journal pertain.
References
- 1.Humayun MS, et al. Preliminary 6 month results from the argus™ II epiretinal prosthesis feasibility study, in Engineering in Medicine and Biology Society, 2009; Annual International Conference of the IEEE; 2009. pp. 4566–4568. [DOI] [PMC free article] [PubMed] [Google Scholar]
- 2.Humayun MS, et al. Interim Results from the International Trial of Second Sight's Visual Prosthesis. Ophthalmology. 2012;119(4):779–788. doi: 10.1016/j.ophtha.2011.09.028. [DOI] [PMC free article] [PubMed] [Google Scholar]
- 3.Zrenner E, et al. Subretinal electronic chips allow blind patients to read letters and combine them to words. Proceedings of the Royal Society B: Biological Sciences. 2010 doi: 10.1098/rspb.2010.1747. [DOI] [PMC free article] [PubMed] [Google Scholar]
- 4.Zrenner E. Fighting Blindness with Microelectronics. Science Translational Medicine. 2013;5(210):210ps16. doi: 10.1126/scitranslmed.3007399. [DOI] [PubMed] [Google Scholar]
- 5.Wilke R, et al. Spatial Resolution and Perception of Patterns Mediated by a Subretinal 16-Electrode Array in Patients Blinded by Hereditary Retinal Dystrophies. Investigative Ophthalmology & Visual Science. 2011;52(8):5995–6003. doi: 10.1167/iovs.10-6946. [DOI] [PubMed] [Google Scholar]
- 6.Goetz GA, et al. Holographic display system for restoration of sight to the blind. Journal of Neural Engineering. 2013;10(5):056021. doi: 10.1088/1741-2560/10/5/056021. [DOI] [PMC free article] [PubMed] [Google Scholar]
- 7.Mathieson K, et al. Photovoltaic retinal prosthesis with high pixel density. Nature Photonics. 2012;6(6):391–397. doi: 10.1038/nphoton.2012.104. [DOI] [PMC free article] [PubMed] [Google Scholar]
- 8.Mandel Y, et al. Cortical responses elicited by photovoltaic subretinal prostheses exhibit similarities to visually evoked potentials. Nat Commun. 2013;4:1980. doi: 10.1038/ncomms2980. [DOI] [PMC free article] [PubMed] [Google Scholar]
- 9.Boinagrov D, et al. Selectivity of direct and network-mediated stimulation of the retinal ganglion cells with epi-, sub- and intraretinal electrodes. Journal of Neural Engineering. 2014;11(2):026008. doi: 10.1088/1741-2560/11/2/026008. [DOI] [PMC free article] [PubMed] [Google Scholar]
- 10.Wang L, et al. Photovoltaic retinal prosthesis: implant fabrication and performance. Journal of Neural Engineering. 2012;9(4):046014. doi: 10.1088/1741-2560/9/4/046014. [DOI] [PMC free article] [PubMed] [Google Scholar]
- 11.Sutter EE. Imaging visual function with the multifocal m-sequence technique. Vision Research. 2001;41(10–11):1241–1255. doi: 10.1016/s0042-6989(01)00078-5. [DOI] [PubMed] [Google Scholar]
- 12.Light JG, et al. Immunohistochemical and electrophysiological analysis of rat retinas after subretinal implantation of photovoltaic arrays. ARVO. 2013 [Google Scholar]
- 13.Hood D, et al. ISCEV standard for clinical multifocal electroretinography (mfERG) (2011 edition) Documenta Ophthalmologica. 2012;124(1):1–13. doi: 10.1007/s10633-011-9296-8. [DOI] [PMC free article] [PubMed] [Google Scholar]
- 14.Boinagrov D, et al. Selectivity of Direct and Network-mediated Stimulation of the Retinal Ganglion Cells with Epi-, Sub- and Intra-Retinal Electrodes. J Neural Eng. 2014 doi: 10.1088/1741-2560/11/2/026008. in press. [DOI] [PMC free article] [PubMed] [Google Scholar]
- 15.Loudin JD, et al. Photodiode Circuits for Retinal Prostheses. Biomedical Circuits and Systems, IEEE Transactions on. 2011;5(5):468–480. doi: 10.1109/TBCAS.2011.2144980. [DOI] [PMC free article] [PubMed] [Google Scholar]


