Abstract
The antioxidant components of cocoa powder, which is rich in polyphenols, were isolated using column chromatography and high performance liquid chromatography. Polyphenolic compounds were then characterized by high-performance liquid chromatography/Ultraviolet and electronspray ionization—tandem mass spectrometry (HPLC-UV-/ESI-MS-MS). As a result, five phenolic compounds were detected. In this study we also investigated scavenging or the total antioxidant capacity (%) of cocoa polyphenol (CP) fractionated from cocoa powder extract. 114.0 mg/g of gallic acid –equivalent phenolics and 94.3 mg/g catechin- equivalent flavonoids were quantified in this extract. Their free radical-scavenging activity was assessed by 1,1-diphenyl-2-picrylhydrazyl radical (DPPH) assay, β-carotene bleaching test, and xanthine oxidase inhibitory activity (OX). Total antioxidant capacity (TAC) was further assessed against the myoglobin-induced oxidation of 6-hydroxy-2, 5, 7, 8-tetramethylchroman-2-carboxylic acid (ABTS) and expressed as Trolox equivalent. A high correlation between TAC and phenolic contents indicated that phenolic compounds from cocoa were a major contributor of antioxidant activity (0.967 ≤ r ≤ 1.00). CP extract had significantly (P < 0.05) potential antioxidant activities with various concentrations. These results suggest that Polyphenols-rich cocoa extract possess prominent medical properties and can be exploited as natural drug to treat free radical associated diseases.
Keywords: Cocoa polyphenols, LC-UV, LC-MS/MS, Free radicals, Antioxidant activity
Introduction
During the seventh century, cocoa has been considered as potential medicines. As described in the European historical documents, chocolate was not drunk only as a pleasurable beverage or a dessert but it was eaten to treat different kind of diseases such as angina and heart pain (Keen 2001). Moreover, consuming chocolate has been reported to increase the total antioxidant capacity of human blood plasma in vivo (Serafini et al. 2003). Natural polyphenols i.e. flavonoids and phenolic acids are the secondary metabolites of plant derived from cacao plant called Theabroma cacao which means food of gods. Recently, massive research has been paid attention into cocoa polyphenols, especially the flavonoids, and its function as robust antioxidant in human health (Wollgast and Anklam 2000). Cocoa powder derived cacao plant are rich in polyphenols and so far more than 8000 phenolic structures have been classified (Guo et al. 2009). The first epidemiological evidence of beneficial effects of cocoa came from the study of Indigenous Kuna Indian population characterized by a low prevalence of atherosclerosis, type 2 diabetes and hypertension, owing to regular cocoa intake. Some scientists have even declared that it improves the health in a way similar to exercise (Guo et al. 2009; Tomaru et al. 2007). Recent study has revealed that cocoa contains more phenolic substances and a higher antioxidant capacity than tea and red wine (Lee et al. 2003). Furthermore, previous studies indicate that cocoa powder extract and polyphenols prolong the lag time of LDL oxidation (Vinson et al. 2006; Osakabe et al. 2002). Oxidative stress is often defined as an intracellular redox imbalance between pro-oxidants and antioxidants (Gulcin et al. 2002, 2003). Prevention of oxidative damage is important for health care, because oxidative stress is thought to be involved in the development of many of the above mentioned diseases (Lu and Foo 2000). Organisms have developed complex antioxidant systems to protect themselves from oxidative stress; however, excess ROS can overwhelm the systems and cause severe damage (Kambayashi et al. 1997). As a result of this, much attention has been focused on the use of exogenous antioxidants, especially natural antioxidants to inhibit the oxidation of cellular components, thereby protecting from damage due to free radicals.
A number of recent epidemiological studies have strengthened that diets rich in phenolic substances are associated with a longer life expectancy and have also been found to exhibit many health-related features because of their antioxidant activities (Hodgson and Croft 2006; Manach et al. 2005; Neuhouser 2004; Roginsky et al. 2005). Polyphenols have been choice of research interest for decades, mostly because of their natural antioxidant properties (Sanbongi et al. 1998; Netzel et al. 2003). Furthermore, cocoa beans (Theobroma cacao) and even cocoa products such as cocoa powder are a rich source of polyphenols, contributing about 10 % of the dry weight of the whole bean, and their products are considered one of the major contributors of antioxidants to the American diet along with fruits and vegetables (Rusconi and Conti 2010). Cocoa polyphenols either phenolics acids or flavonoids comprise mainly catechins, flavonol glycoside, anthocyanins and procynanidins (Hammerstone et al. 1999; Sanbongi et al. 1998). Importantly, the high polyphenols content of cocoa coupled with its biological activity render it of particular interest from the nutritional and pharmacological viewpoints (Visioli et al. 2009). However, different geographical areas and methods of preparation may influence the total antioxidant capacity (TAC) of cocoa or their products. Therefore, monitoring cocoa TAC periodically would be useful for the health care. TAC has been used for the evaluation of antioxidant status (Hay et al. 2006). Several methods were recently carried out for the measurement of TAC, the ferric reducing antioxidant power (FRAP), the total radical trapping antioxidant potential (TRAP) and the oxygen radical absorbance capacity (ORAC) (Cao et al. 1993; Benzie and Strain 1996; Ching et al. 2006). Most of the assays could not test many samples simultaneously. Furthermore, the accuracy of these assays remains relatively ambiguous. An efficient assay for the assessment of TAC was currently developed and validated using a 96-well microplate (Kambayashi et al. 2009; Erel 2004; Lussignoli et al. 1999). Overall, Cocoa and its derived products (cocoa powder, cocoa liquor and chocolates) contain varied polyphenol contents and possess different levels of antioxidant potentials. Therefore, the objectives of this study are focused on: (a) the quantity and content of polyphenols in extracts from Malaysian cocoa powder; (b) comparatively evaluated the antioxidant properties of polyphenolic-rich cocoa extracts compared with known synthetic antioxidants in vitro.
Materials and methods
Chemicals
All solvents and reagents used in these experiments such as ethanol and chloroform were of analytical grade and together with 2,2-diphenyl-2-picylhydrazyl hydrate (DPPH), 3,5-di-tert-butyl-4-hydroxytoluene (BHT), gallic acid (GA), catechin, epicatechin, β-carotene, linoleic acid, Allopurinol and Tween 40, XO assay kit and all standards of flavonoid and phenolic acids were purchased from Sigma-Aldrich, Chemicals, Co., USA. ABTS kit was purchased from Zen-Bio, Inc., USA.
Isolation of polyphenols from cocoa powder
Malaysian cocoa powder was purchased from (KL-Kepong Cocoa Products Sdn. Bhd., Port Klang, and Selangor, Malaysia). Cocoa polypehonols rich-extract was prepared according to (Ruzaidi et al. 2005). Briefly, crude cocoa extract was performed by extracting defatted cocoa powder (40 g) with 80 % (v/v) ethanol for 2 h. The ethanol was evacuated from the extract using a rotary evaporator (Buchi Rotavor R-200, Flawil, Switzerland) for 40 min at 55 °C. Then, the final product was kept at −80 °C and lyophilized using a freeze-dryer (The Virtis Company Inc., Gardiner, New York; −45 °C, 120 bar). The final extract was standardized according to (Osakabe et al. 1998).
To standardize the extract, 5 mL of cocoa extract was fractionated on a prepacked column (25 cm × 2.0 cm) with Sephadex LH 20 (Amersham Bioscience, Uppsala, Sweden). Stepwise increase in water—acetone ratio (85:15, 70:30, and 40:60) as elution medium and a flow rate of 2.0 mL/min was kept along the procedure. The resulting fractions were used for the identification of phenolic compounds.
Determination of phenols and flavonoid contents
The total amounts of phenols and flavonoid contents were measured following a method described by (Liu et al. 2009). Total phenol content was detected by a method of Folin—Ciocalteu’s phenol reagent using gallic acid as a standard and expressed as mg gallic acid equivalent (GAE)/100 mL extract. Total flavonoid was measured according to a method with 10 % AlCl3.3H2O solution using (+)-catechin as a standard and explained as mg catechin equivalent (CE)/100 ml extract.
High-performance liquid chromatography/electron spray ionization-tandem mass spectrometry (HPLC/ESI-MS-MS) analysis
Composition and level of phenolic compounds in the extracts were determined using high-performance liquid chromatography (HPLC) (Agilent 1100, Palo Alto, USA) based on (Natsume et al. 2000). The HPLC system is composed of quaternary pump, auto injector, degasser, and diode-array detection (DAD). A reversed-phase C18 column (Alltech, Licosphere, United States) (250 mm × 4 mm, 5 μm I.D) was used for the separation of bioactive compounds. The analyses were carried out using the mobile phase composed of two solvents: Solvent A containing (water—trifluoroacetic acid (99.9: 0.1, v/v) and solvent (B) (acetonitrile—trifluoroacetic acid (99.9: 0.1, v/v. The gradient elution was carried out as follows: 0–10 % (A) for 5 min, 10–25 % (A) for 25 min, and 25–100 % (A) for 5 min with a flow rate of 0.8 mL/min was applied to the analysis. The UV spectra of eluted compounds were recorded within 280–360 nm using PDA detector. On the basis of external standards (100–1,000 μg/ml), the amount of catechin, epicatechin, gallic acid, protocatechehuic acid and chlorogenic acid (mg/g fraction) were quantitatively assessed. The eluents then were analyzed well by ESI - MS - MS using an electron spray ionization tandem mass spectrometer (Finnigan LCQ Advantage MAX ion-trap mass spectrometer) operating in a negative mode. The extracts were filtered with 0.45 μ m Micropore. Aliquots of 20 μL of the filtrate were directly injected into the column using a Rheodyne (model 7725i) injection valve. The operating conditions contained the following: spray needle voltage, 3.5 kV; capillary voltage, 16 V; tube lens offset, 55 V; ion transfer capillary temperature, 320 °C; nitrogen sheath gas, 45 units; and auxiliary gas, 5 units (in arbitrary units). The single-ion-monitoring (SIM) mode was done to quantify the molecular ions of phenolic compounds. The SIM analysis was a close scan event monitored at the m/z value of the chosed ion in the range of 1.0Th, centered at the peak for the molecular ion. The SIM analysis, in this experiment, was investigated in the m/z range of 100–700 with a superior ion time injection of 200 ms and five microscans. In implementing MS—MS analysis, helium collision gas was inserted in accordance with the recommendations of the manufacturer. The MS-MS fragment spectra were produced by using normalized collision energy with an increment of 30 % and also with wideband activation (La-Torre et al. 2006).
Free radical scavenging activity and xanthine oxidase inhibitory assays
β-carotene bleaching assay
This assay was performed to evaluate the capability of CP in different concentration to reduce the oxidative loss of β-carotene in a β-carotene linoleic acid emulsion (Taga et al. 1984). After dissolving β-carotene in 10 ml of chloroform (CHCL3), a known fraction (0.2 ml) of this solution was added into a boiling flask having 20 mg of linoleic acid and 200 mg of Tween 40. Then, the chloroform was evacuated by using a rotary evaporator at 40 °C for 5 min. Distilled water (50 ml) was carefully added to the residue with vigorous incitement, forming an emulsion. The emulsion was transferred to a tube containing 0.2 ml of each CP extract concentration (5, 10, 20 mg/ml). The absorbance was spectrophotometrically measured at 470 nm and the test emulsion was incubated in a water bath at 50 °C for 120 min, after that the absorbance was measured again. An equal amount of ethanol and BHT were used as negative and positive control respectively. The antioxidative activity (%) of cocoa extract was calculated using the following formula:
where, At and Ct are the absorbance measured for CP extract in different concentration and control, respectively, after incubation for 120 min, and Co is the absorbance values for the control measured at zero time during the incubation.
DPPH assay
The method of (Liyana-Pathiranan and Shahidi 2005) was performed for the determination of scavenging activity of CP against DPPH free radical in different concentration. After preparing DPPH solution 0.135 mM with ethanol, 1 ml of each CP extract and Ascorbic acid concentration (5, 10, 20 mg/ml) were mixed with 1 ml of the previous solution. The reaction mixture was swirled thoroughly and left in the dark room at temperature for 30 min. The absorbance of the mixture assays were measured spectrophotometrically at 517 nm. The scavenging ability of CP toward DPPH radical was counted by the following equation:
Where, Abs control is the absorbance of DPPH radical + ethanol, Abs sample is the absorbance of DPPH radical + CP/standard.
Xanthine oxidase assay
The activity of xanthine oxidase (XO) with xanthine as the substrate was measured spectrophotometrically by using the procedure of (Marcocci et al. 1994). To prepare xanthine solution (150 mM), xanthine was dissolved in phosphate buffer solution (PBS) and adjusted the pH to 7.5. The XO solution was readied in cold (50 mM) phosphate buffer (pH 7.5) at concentration of 0.4 U/ml. The CP was diluted in series to obtain a concentration range of 5 to 20 mg/ml. The assay blend was prepared to be 1 ml of CP extract from each concentration, 2.9 ml of phosphate buffer solution (pH 7.5) and 2 ml of xanthine solution. This blend was pre-incubated at 25 °C for 15 min.
The reaction was started by adding 0.1 ml of XO solution and the sample was incubated at 25 °C for 30 min. The reaction was stopped by adding of 1 N hydrochloric acid (HCl) then, the absorbance was read at 295 nm using UV-spectrophotometer. The buffer solution and solution containing xanthine and xanthine oxidase were used as blind and control respectively. Allopurinol, a known inhibitor of xanthine oxidase, was used as a positive control. The inhibition percentage of xanthine oxidase activity was counted by using the following equation:
Where A; the activity of the enzyme without test extracts, B; control of A without test extract and enzyme, C and D; the activities of the test extract with and without XO respectively.
Total antioxidant capacity
ABTS assay
Myoglobin working solution was diluted with dilution buffer and kept on ice. Ten micro- liter of CP extract or Trolox standard and assay buffer as a negative control were added to 9 wells of 96-well microplate followed by adding 20 μl of Myoglobin working solution. Reaction was started by adding 100 μl of ABTS solution for 5 min (25 °C). To stop the reaction, 50 μl of stop solution was added and the absorbance was read at 405 nm.
Statistical analysis
Values were presented as means of three replicate determinations ± standard deviation (SD). All data were subjected to a one-way analysis of variance (ANOVA) to test whether there is significant differences in antioxidant activity of natural and synthetic antioxidants, and the significance of the difference between means was determined by Duncan’s multiple-range test (P < 0.05) using SPSS for windows version 18.0. Pearson Correlation Coefficient was used to determine the correlation between the parameters studied in CP extract.
Results
HPLC of phenolic compounds
Figure 1 and Table 1 show that the composition of CP contains five compounds namely, catechin, epicatechin, gallic acid, protocatechehuic acid and chlorogenic acid. Seventeen phenolics compounds as standards were run on the HPLC-UV to verify chemical compounds of CP as demonstrated in Fig. 1a. Table 2 shows the standard calibration curves of standards (area vs. concentration) showing retention time, area, as well as concentrations of various phenolic acid and flavonoid standards, which were run in triplicates together with the samples using the Agilent HPLC instrument.
Fig. 1.
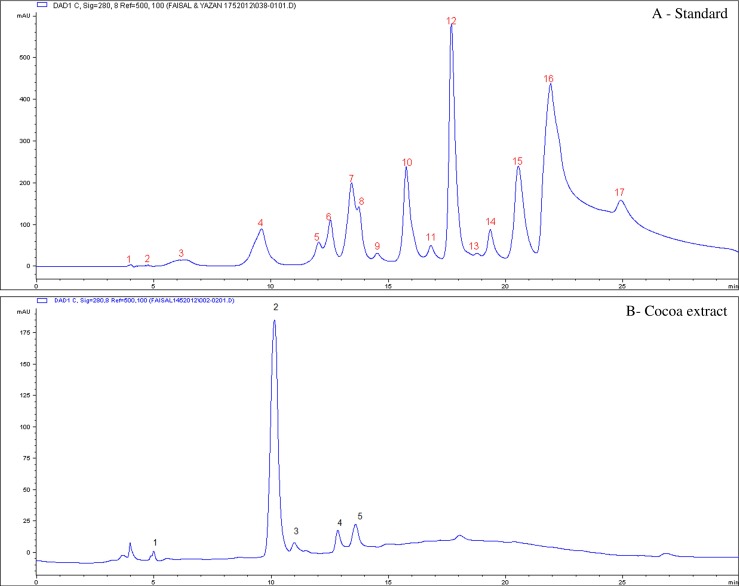
HPLC/UV chromatogram of CP showing five major compounds in (b). The five compounds correspond to peaks 1–5, respectively. The peak numbers and their identifications were referenced in Table 1. Standards of phenolic acid and flavonoid compounds correspond to peaks in (a). 1- Gallic acid, 2- caffeic acid, 3- vanillic acid, 4- epicatechin, 5- rutin, 6- Catechin,7- o-coumaric acid, 8-sinapic acid, 9- Chlorogenic acid, 10- keampferol, 11- genistein, 12- Protocatechuic acid, 13- naringin, 14- apigenin, 15- quercetin, 16- morin, 17- syringic acid
Table 1.
Contents of Flavonoids and phenolic acids in CP determined by HPLC
| Peaks | Compounds | RT(min) | Concentrations mg/g CP |
|---|---|---|---|
| 1 | Gallic acid | 5.9 | 0.84 ± 0.45 |
| 2 | Protocatechuic acid | 10.1 | 18.8 ± 2.40 |
| 3 | Chlorogenic acid | 12.8 | 1.18 ± 0.33 |
| 4 | Epicatechin | 13.5 | 1.39 ± 0.14 |
| 5 | Catechin | 11.03 | 1.32 ± 0.47 |
| Phenolic acid amount | 114 mg/g | ||
| Flavonoid amount | 94.95 mg/g | ||
| Yield extracta | 23.75 g/100 g |
The data are given as mean ± SD (n = 3)
aYield (percent) [solvent extracts wt (g)/sample wt (g)] × 100
Table 2.
Linearity of standard calibration curves for various phenolic standards as determined by HPLC-UV
| Compound | RT(min) | Regression equation | R2 | Area (Y) (MAU*s) | Concentration (X,μg/g) |
|---|---|---|---|---|---|
| Gallic acid | 5.9 | Y = 0.612X + 313.4 | 0.998 | 1019.22 | 1153.3 |
| Protocatechuic acid | 10.3 | Y = 0.131X + 199.5 | 0.997 | 4537.4 | 33113.7 |
| Chlorogenic acid | 12.9 | Y = 0.006X + 7.542 | 0.995 | 9.095 | 258.3 |
| Epicatechin | 13.9 | Y = 2.27X + 2070 | 0.988 | 2448.7 | 166.83 |
| Catechin | 11.4 | Y = 1.360X + 355.2 | 0.997 | 1408.4 | 774.4 |
Where Y = area (mAU*s), X = concentration (μg/ml), R2 is the regression coefficient
HPLC-MS-MS of phenolic compounds
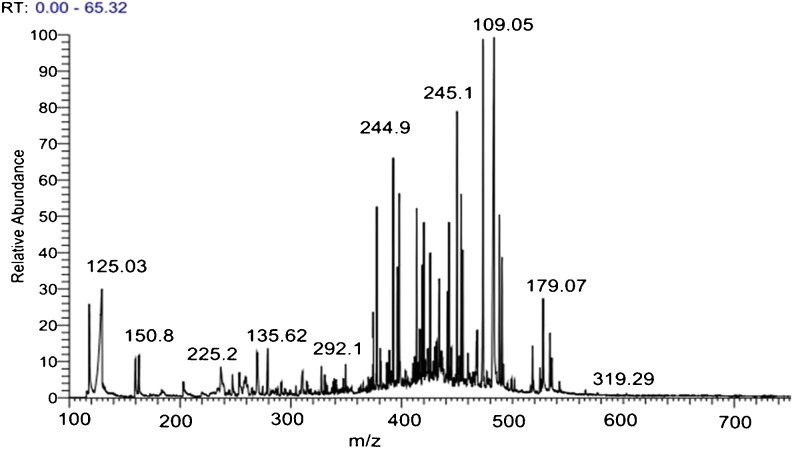
Based on HPLC-MS-MS optimized conditions, cocoa rich-polyphenols extract was then analyzed by HPLC/UV-ESI-MS/MS. The results are listed in Fig. 2. At the same time, HPLC-MS/MS results were confirmed by using our standard library information for identifying phenolic compounds in CP samples. Throughout searching in our standard library information (e.g. Peak retention times, UV spectrum, [M-H] (m2) and ESI-MS/MS data), the five phenolic compounds that have been investigated by HPLC-UV, also detected in HPLC-MS-MS as shown in Table 3 and Fig. 2. As a result, the deprotonated [M-H] molecule was observed for all the analyzed compounds as shown in Fig. 2. And as expected the molecular mass of these five compounds were further detected and confirmed as indicted in Fig. 2 and Table 3.
Fig. 2.
Peaks of Phenolics compound in CP by LC-MS/MS with ESI
Table 3.
Phenolic compounds identified in CP by LC-MS/MS with ESI
| Compound | RT (min) | MW | [M-H] (m2) | UV band (nm) |
|---|---|---|---|---|
| Gallic acid | 5.9 | 170 | 169(125) | 272 |
| Protocatechuic acid | 10.1 | 154.12 | 153(109) | 230,260 |
| Chlorogenic acid | 12.8 | 354.31 | 353(179) | 226,300 |
| Epicatechin | 13.5 | 290.26 | 289(245) | 280 |
| Catechin | 10.03 | 290.25 | 289(245) | 272 |
Rt (min) retention time, MW Molecular weight, [M-H] Molecular mass of cocoa phenolics on the loss of one proton measured by SIM, UV band (nm) maximum absorption in the UV region
Free radical scavenging activity and xanthine oxidase inhibitory results
DPPH
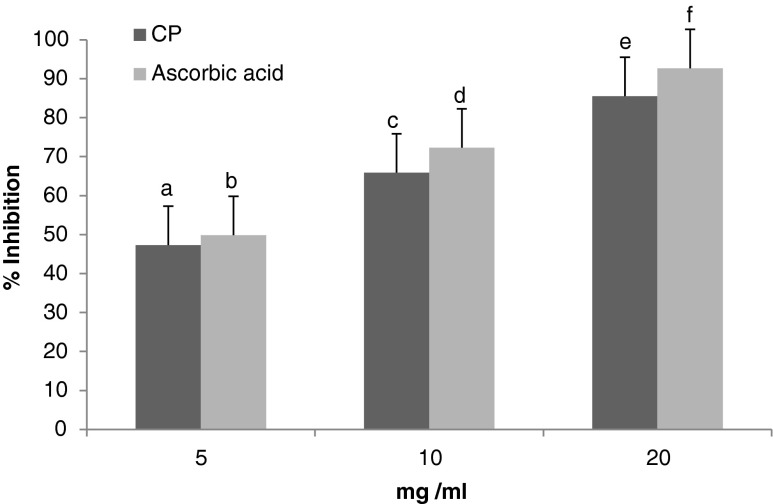
The free radical scavenging activity of CP revealed percentage inhibitions of 47.2, 65.77, 85.8 %, while that of the ascorbic acid showed percentage inhibitions of 49.85, 72.32 and 92.69 % at concentrations of 5, 10 and 20 mg/ml, respectively. These results show that the scavenging activity increased along with increasing the concentrations of CP as given in Fig. 3. The CP showed a slightly lower DPPH-radical scavenging activity (IC 50 = 7.4 mg/ml) than ascorbic acid (IC 50 = 4.9 mg/ml).
Fig. 3.
Antioxidant activity (%) of CP compared with ascorbic acid at 5, 10 and 20 mg/ml using DPPH. Results are expressed as mean ± SD (n = 3). Bars having different letters are significantly different (P < 0.05)
β-carotene bleaching
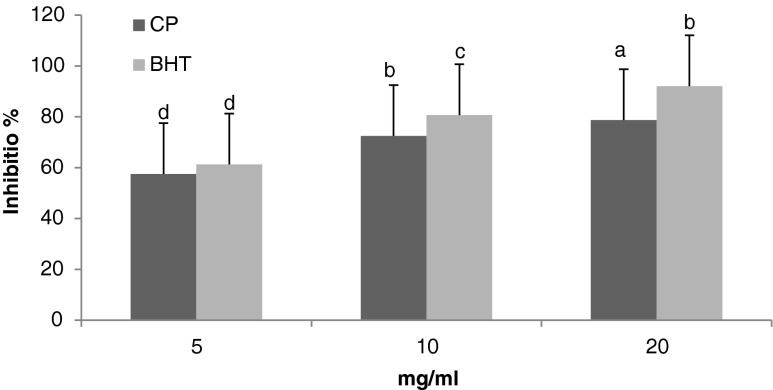
The result of lipid peroxidation inhibitory activity of the CP was assessed by the β-carotene bleaching test is shown in Fig. 4. After 120 min of incubation, the percentage inhibitions were 59.5, 75.1, 81.5 % for CP; and 63.4, 83.51, 95.3 % for BHT at concentrations of 5, 10 and 20 mg/ml, respectively. The concentration supplying 50 % inhibition of CP was slightly similar to BHT (IC50 = 2.63 mg/ml).
Fig. 4.
Antioxidant activity (%)of CP compared with BHT at 5,10 and 20 mg/ml using a β-carotene bleaching assay. Results are expressed as mean ± SD (n = 3). Bars having different letters are significantly different (P < 0.05)
Xanthine oxidase
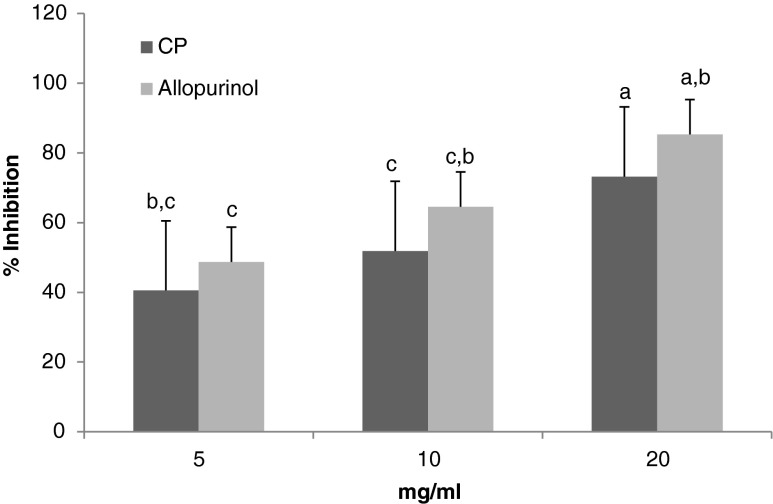
The inhibition activity of CP towards xanthine oxidase was evaluated using the above method. The result was shown in Fig. 5. The xanthine oxidase inhibition activities were 40.1, 51.8 and 73.1 % for CP; and 48.7, 64.5 and 85.29 % for Allopurinol at concentrations of 5, 10, 20 mg/ml. IC50 value of both was 7.68 mg/ml.
Fig. 5.
Antioxidant activity (%) of CP compared with Allopurinol at 5, 10 and 20 mg/ml using xanthin oxidase inhibitory. Results are expressed as mean ± SD (n = 3). Means with different letters were significantly different at the level of p < 0.05
Total antioxidant activity
ABTS assay
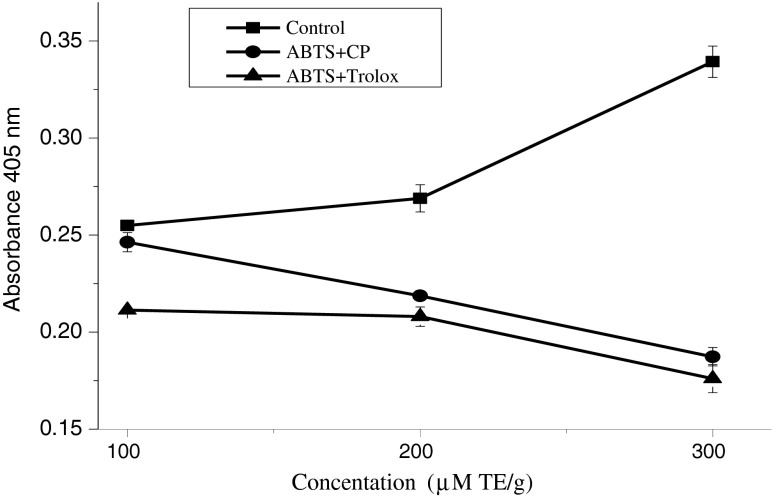
The oxidation of ABTS by ferryl myoglobin radical with H2O2 proceeded linearly as a function of time. CP has shown significantly (p < 0.05) inhibitory effect against the oxidation of ABTS compared with the effect of Trolox and negative control as shown in Fig. 6. The equations below demonstrate the mechanism of actions of CP as a potent inhibitor towards ABTS free radicals in the reaction of the assay.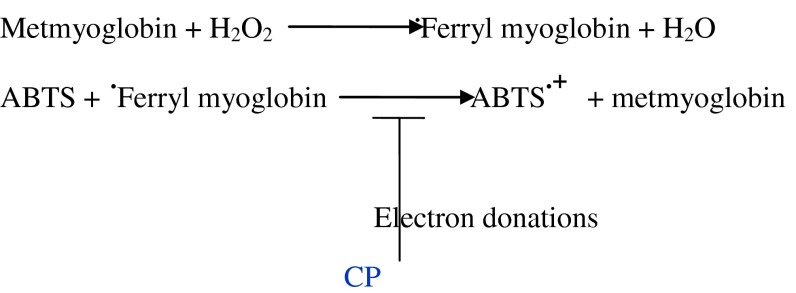
Fig. 6.
Total antioxidant activity (%)of CP compared with Trolex at 100,200 and 300 μM using ABTS. . Results are expressed as means ± SD (n = 3). Differences between means were significantly different p < 0.01. TE: Trolox equivalent per gram of extract
Discussion
By testing the profiles of polyphenols in CP, we have demonstrated that HPLC-UV analysis done under the conditions described above can serve to distinguish each type of polyphenol, while LC-MS-MS analysis was more suitable for confirmation of individual polyphenols in the sample on the basis of molecular size. Therefore, Coupling a HPLC and an ion trap MS with an electronspray ionization source, operated in negative ion mode was used for further analysis. The presence of phenolic compounds in CP extract was confirmed using HPLC/MS-MS libraries. Epicatechin, gallic acid, catechin, protocatechehuic acid and cholorogenic acid contents were 1.39 ± 0.14, 0.84 ± 0.45, 1.32 ± 0.47, 18.8 ± 2.40 and 1.18 ± 0.33 mg/ml CP, respectively (Table 1). Surprisingly, phenolic compounds which have been identified by (Maleyki et al. 2008) were different quantatively and qualitatively, compared with our sample.
Total polyphenols content levels are affected by a wide variety of factors, such as cultivar, growing conditions, harvesting, food processing and preparation, sampling, and analytical procedures and thus, the antioxidant activity is affected.
In-vitro, this study was comparatively assessed the antioxidant potency of our extract with synthetic antioxidants or standard drugs [Ascorbic acid, Butylated hydroxytoluene (BHT), Allopurinol and Trolox (Vitamin E)]. Interestingly, the above research results suggest that test cocoa polyphenols rich-extract possess a significant antioxidant property when comparing with antioxidant efficacy among synthetic antioxidants. In particular, the evaluation of cocoa polyphenol extract for antioxidant and xanthine oxidase inhibitory activity was assessed.
The results presented for CP of Malaysian cocoa powder indicate that the DPPH, β-carotene, xanthine oxidase and ABTS showed comparable antioxidant activity. For example, DPPH radical scavenging activity was demonstrated to increase as the concentration increased from 5 to 20 mg/ml for all samples and standards.
As mentioned by (Jayaprakasha et al. 2001) the bleaching pathway of β-carotene is a free radical phenomenon which is resulting from the hydroperoxidation of linoleic acid. In the absence of antioxidant, β-carotene will be under rapid discoloration as a result of losing their double bonds by oxidation. Thus, changing in color is measured spectrophotometrically. The presence of antioxidants in the extracts can exert as a protective agent of β-carotene bleaching by neutralizing the linoleate-free radical and other free radicals formed in the system (Liyana-Pathiranan and Shahidi 2005). There was a correlation between degradation rate and the bleaching of β-carotene; where the extract and BHT with the lowest β-carotene degradation rate exhibited the highest antioxidant activity. However, the CP with various concentrations had a lower antioxidant activity than BHT, (Fig. 4).
Xanthine oxidase has been mentioned as a very important enzyme that inducing the production of reactive oxygen specious during the conversion of hypoxanthine to xanthine and to uric acid as well. Therefore, XO could be used as a marker for the formation of free radical-related diseases, oxidative stress and inflammation. Specifically, gout and hyperuricemia are considered as a XO-related disease (Liu et al. 2008). In this study, Malaysian CP extract exhibited xanthine oxidase inhibition activity compared with Allopurinol, a known inhibitor of xanthine oxidase Fig. 5. This particular extract which suppresses activity of XO could be very beneficial in the contribution of treating the above mention diseases. Hence, from this study CP could be continuously study further to develop XO inhibition agent.
TAC assays using 96-well plates have already been mentioned (Neuhouser 2004; Sanbongi et al. 1998). In our study, we used 96-well microplate to assess TAC of CP sample with different concentration simultaneously. The ABTS• + decolorization method assay measures ABTS. + radical cation formation induced by metmyoglobin and hydrogen peroxide. Trolox (6-Hydroxy-2,5,7,8-tetramethylchroman-2-carboxylic acid), a water soluble vitamin E analog, serves as a positive control inhibiting the formation of the radical cation in a dose dependent manner (Netzel et al. 2003; Rusconi and Conti 2010). In a previous research, it has been mentioned that ABTS assay using microplate would help in cutting the cost to 25 %, increasing the analyzed sample and improving the analytical performance compared with other previously reported methods (Kampa et al. 2002). CP extract has been perfectly demonstrated to inhibit the oxidation of ABTS by donation electron compared with Trolox Fig. 6. The contribution of ABTS assay-microplate in evaluating TAC of our results was in agreement with (Kambayashi et al. 2009). In summary, the results of antioxidant scavenging activity by ABTS method showed that CP has the same as the effect of Trolox, against the oxidation of ABTS compared with the negative control as given in Fig. 6. Therefore, ABTS microplate assay could be a proper method for measuring TAC in functional foods. Importantly, our results also showed that correlations between scavenging activity/antioxidant activity and total phenolic content were positively very strong (967 ≤ r ≤ 1.00). This correlation confirmed that the total phenolic content were the main constituents contributing to the antioxidant activity of cocoa powder. However, relationship between phenolic content and antioxidant activity from other studies was due to a high content of ascorbic acid or minerals (Reddy et al. 2010 and Deepa et al. 2006).
Conclusion
Taken together, our study demonstrates that cocoa polyphenols prepared from cocoa possesses free radical–scavenging and total antioxidant capacity properties. ABTS method has relatively reduced the cost and frame work with more ability to be employed in epidemiological studies where large numbers of sample are to be assessed. In addition, the polyphenols present in Malaysian cocoa extract also may be useful in the treatment of oxidative stress- and xanthine oxidase-related diseases such as inflammation, gout and cancer. Thus, specific inhibitors of free radical and xanthine oxidase are expected to be therapeutically useful in the contribution of improving a new functional supplement having a potent therapy. However, further investigations are still required to shed the light underlining the beneficial effect of Malaysian cocoa powder.
Acknowledgments
This work was supported by (Research Grant Number: 9315900). The authors would like to acknowledge Faculty of Medicine and Health sciences for the use of laboratory facilities and financial support. Syed Hasbulla is acknowledged for technical help in HPLC-UV. The technicians in Food science and technology laboratory are acknowledged for their technical assistance in LC-MS-MS. Also, we remain thankful to IBS for libraries information of phenolic compounds.
Conflict of interest
The authors have no competing interests to disclose.
Abbreviations
- HPLC-UV-/ESI-MS-MS
High-performance liquid chromatography/Ultraviolet and electronspray ionization—tandem mass spectrometry
- BHT
Butylated hydroxytoluene
- DPPH
2,2-diphenyl-1-picrylhydrazyl
- ABTS
2,2′-azino-di(3-ethylbenzthiazoline-6-sulfonic acid
- ABTS•+
ABTS cation radical
- TAC
Total antioxidant capacity
- Trolox
6-Hydroxy-2,5,7,8-tetramethylchroman-2-carboxylic acid
Footnotes
Faisal Ali and Yazan Ranneh contributed equally to this work and therefore, share the first authorship.
Contributor Information
Amin Ismail, Phone: +60-3-89472435, FAX: +60-3-89426769, Email: aminis@upm.edu.my.
Norhaizan Mohd Esa, Phone: +60-3-89472435, FAX: +60-3-89426769, Email: nhaizan@upm.edu.my.
References
- Benzie IFF, Strain JJ. The ferric reducing ability of plasma (FRAP) as a measure of “antioxidant power”: the FRAP assay. Anal Biochem. 1996;239:70–76. doi: 10.1006/abio.1996.0292. [DOI] [PubMed] [Google Scholar]
- Cao G, Alessio HM, Cutler RG. Oxygen-radical absorbance capacity assay for antioxidants. Free Radic Biol Med. 1993;14:303–311. doi: 10.1016/0891-5849(93)90027-R. [DOI] [PubMed] [Google Scholar]
- Ching SYL, Hall J, Croft K, Beilby J, Rossi E, Ghisalberti E. Antioxidant inhibition of oxygen radicals for measurement of total antioxidant capacity in biological samples. Anal Biochem. 2006;353:257–265. doi: 10.1016/j.ab.2006.02.027. [DOI] [PubMed] [Google Scholar]
- Deepa N, Kaur C, Singh B, Kapoor HC. Antioxidant capacity in some red sweet pepper cultivars. J Agric Food Chem. 2006;19:572–578. [Google Scholar]
- Erel O. A novel automated direct measurement method for total antioxidant capacity using a new generation, more stable ABTS radical cation. Clin Biochem. 2004;37:277–285. doi: 10.1016/j.clinbiochem.2003.11.015. [DOI] [PubMed] [Google Scholar]
- Gulcin IME, Buyukokuroglu M, Oktay I, Kufrevioglu O. On the in vitro antioxidant properties of melatonin. J Pineal Res. 2002;33:167–171. doi: 10.1034/j.1600-079X.2002.20920.x. [DOI] [PubMed] [Google Scholar]
- Gulcin IME, Buyukokuroglu M, Oktay I, Kufrevioglu O. Antioxidant and analgesic activities of turpentine of Pinus nigra Arn. Subsp.Pallsiana (Lamb.) Holmboe. J Ethnopharmacol. 2003;86:51–58. doi: 10.1016/S0378-8741(03)00036-9. [DOI] [PubMed] [Google Scholar]
- Guo W, Kong E, Meydani M. Dietary polyphenols, inflammation, and cancer. Curr Genomics. 2009;10(8):534–539. doi: 10.2174/138920209789503888. [DOI] [PubMed] [Google Scholar]
- Hammerstone JF, Lazarus SA, Mitchell AE, Rucker R, Schmitz HH. Identification of procyanidins in cocoa (Theobroma cacao) and chocolate using high-perfomance liquid chromatogra-phy/mass spectrometry. J Agric Food Chem. 1999;47:490–496. doi: 10.1021/jf980760h. [DOI] [PubMed] [Google Scholar]
- Hay KX, Waisundara VY, Timmins M, Ou B, Pappalardo K, McHale N, Huang D. High-throughput quantitation of peroxyl radical scavenging capacity in bulk oils. J Agric Food Chem. 2006;54:5299–5305. doi: 10.1021/jf061410v. [DOI] [PubMed] [Google Scholar]
- Hodgson JM, Croft KD. Dietary flavonoids: effects on endothelial function and blood pressure. J Sci Food Agric. 2006;86:2492–2498. doi: 10.1002/jsfa.2675. [DOI] [Google Scholar]
- Jayaprakasha GK, Singh RP, Sakariah KK. Antioxidant activity of grape seed (Vitis vinifera) extracts on peroxidation models in vitro. Food Chem. 2001;73:285–290. doi: 10.1016/S0308-8146(00)00298-3. [DOI] [Google Scholar]
- Kambayashi Y, Yamashita S, Niki E, Yamamoto Y. Oxidation of rat liver phospholipids: comparison of pathways in homogenous solution, in liposomal suspension and in whole tissue homogenates. J Biochem. 1997;121:425–431. doi: 10.1093/oxfordjournals.jbchem.a021606. [DOI] [PubMed] [Google Scholar]
- Kambayashi Y, Binh NT, Asakura HW, Hibino Y, Hitomi Y, Nakamura H, Ogino K. Efficient assay for total antioxidant capacity in human plasma using a 96-well microplate. J Clin Biochem Nutr. 2009;44:46–51. doi: 10.3164/jcbn.08-162. [DOI] [PMC free article] [PubMed] [Google Scholar]
- Kampa M, Nistikaki A, Tsaousis V, Maliaraki N, Notas G, Castanas E. A new automated method for the determination of the total antioxidant capacity (TAC) of human plasma, based on the crocin bleaching assay. BMC Clinic Pathol. 2002;2:3. doi: 10.1186/1472-6890-2-3. [DOI] [PMC free article] [PubMed] [Google Scholar]
- Keen CL. Chocolate: food as medicine/medicine as food. J Am Coll Nutr. 2001;20:436S–439S. doi: 10.1080/07315724.2001.10719181. [DOI] [PubMed] [Google Scholar]
- La-Torre GL, Saitta M, Vilasi F, Pellicano T, Dugo G. Direct determination of phenolic compounds in Sicilian wines by liquid chromatography with PDA and MS detection. Food Chem. 2006;94:640–650. doi: 10.1016/j.foodchem.2005.02.007. [DOI] [Google Scholar]
- Lee KW, Kim YJ, Lee HJ, Lee CY. Cocoa has more phenolic phytochemicals and a higher antioxidant capacity than teas and red wine. J Agric Food Chem. 2003;51:7292–7295. doi: 10.1021/jf0344385. [DOI] [PubMed] [Google Scholar]
- Liu X, Chen R, Shang Y, Jiao B, Huang C. Lithospermic acid as a novel xanthine oxidase inhibitor has anti-inflammatory and hypouricemic effects in rats. Chem Biol Interact. 2008;176:137–142. doi: 10.1016/j.cbi.2008.07.003. [DOI] [PubMed] [Google Scholar]
- Liu SC, Lin JT, Wang CK, Chen HY, Yang DJ. Antioxidant properties of various solvent extracts from lychee (Litchi chinenesis Sonn.) flowers. Food Chem. 2009;114:577–581. doi: 10.1016/j.foodchem.2008.09.088. [DOI] [Google Scholar]
- Liyana-Pathiranan CM, Shahidi F. Antioxidant activity of commercial soft and hard wheat (Triticum aestivum L) as affected by gastric conditions. J Agric Food Chem. 2005;53:2433–2440. doi: 10.1021/jf049320i. [DOI] [PubMed] [Google Scholar]
- Lu YR, Foo LY. Antioxidant and radical scavenging activities of polyphenols from apple pomace. Food Chem. 2000;68:81–85. doi: 10.1016/S0308-8146(99)00167-3. [DOI] [Google Scholar]
- Lussignoli S, Fraccaroli M, Andrioli G, Brocco G, Bellavite P. A microplate-based colorimetric assay of the total peroxyl radical trapping capacity of human plasma. Anal Biochem. 1999;269:38–44. doi: 10.1006/abio.1999.4010. [DOI] [PubMed] [Google Scholar]
- Maleyki A, Ismail A, Chong PP, Hamid M, Kamaruddin S, Hasbullah S. The effect of cocoa Extract on Glucometabolism, oxidative stress, and antioxidant Enzymes in obese-diebetic (ob-db) Rats. J Agric Food Chem. 2008;56:7877–7884. doi: 10.1021/jf8015915. [DOI] [PubMed] [Google Scholar]
- Manach C, Mazur A, Scalbert A. Polyphenols and prevention of cardiovascular diseases. Curr Opin Lipidol. 2005;16:77–84. doi: 10.1097/00041433-200502000-00013. [DOI] [PubMed] [Google Scholar]
- Marcocci I, Marguire JJ, MT D-l, Packer L. The nitric oxide scavenging properties Ginkgo biloba extract. Biochem Biophys Res Commun. 1994;201:748–755. doi: 10.1006/bbrc.1994.1764. [DOI] [PubMed] [Google Scholar]
- Natsume M, Osakabe N, Yamagishi M, Takizawa T, Nakamura T, Miyatake H, Hatano T, Yoshida T. Analyses of polyphenols in cacao liquor, cocoa, and chocolate by normal-phase and reverse-phase HPLC. Biosci Biotech Bioch. 2000;64:2581–2587. doi: 10.1271/bbb.64.2581. [DOI] [PubMed] [Google Scholar]
- Netzel M, Strass G, Bitsch I, Konitz R, Christmann M, Bitsch R. Effect of grape processing on selected antioxidant phenolics in red wine. J Food Eng. 2003;56:223–228. doi: 10.1016/S0260-8774(02)00256-X. [DOI] [Google Scholar]
- Neuhouser ML. Dietary flavonoids and cancer risk: evidence from human population studies. Nutr Cancer. 2004;50:1–7. doi: 10.1207/s15327914nc5001_1. [DOI] [PubMed] [Google Scholar]
- Osakabe N, Yamagishi M, Sanbongi C, Natsume M, Takizawa T, Osawa T. The antioxidative substances in cacao liquor. J Nutr Sci Vitaminol. 1998;44:313–321. doi: 10.3177/jnsv.44.313. [DOI] [PubMed] [Google Scholar]
- Osakabe N, Yasuda A, Natsume M, Takizawa T, Terao J, Kondo K. Catechins and their oligomers linked by C4! C8 bonds are major cacao polyphenols and protect low-density lipoprotein from oxidation in vitro. Exp Biol Med. 2002;227:51–56. doi: 10.1177/153537020222700109. [DOI] [PubMed] [Google Scholar]
- Reddy CVK, Sreeramulu D, Raghunath M. Antioxidant activity of fresh and dry fruits commonly consumed in India. Food Res Int. 2010;4:285–288. doi: 10.1016/j.foodres.2009.10.006. [DOI] [Google Scholar]
- Roginsky AB, Ujiki MB, Ding XZ, Adrian TE. On the potential use of flavonoids in the treatment and prevention of pancreatic cancer. In Vivo. 2005;19:61–67. [PubMed] [Google Scholar]
- Rusconi MA, Conti A. Theobroma cacao L., the Food of the Gods: a scientific approach beyond myths and claims. Pharmacol Res. 2010;61:5–13. doi: 10.1016/j.phrs.2009.08.008. [DOI] [PubMed] [Google Scholar]
- Ruzaidi A, Amin I, Nawalyah AG, Hamid M, Faizul HA. The effect of Malaysian cocoa extract on glucose levels and lipid profiles in diabetic rats. J Ethnopharmacol. 2005;98:55–60. doi: 10.1016/j.jep.2004.12.018. [DOI] [PubMed] [Google Scholar]
- Sanbongi C, Osakabe N, Natsume M, Takizawa T, Gomi S, Osawa T. Antioxidative polyphenols isolated from Theobroma cacao. J Agric Food Chem. 1998;46:452–457. doi: 10.1021/jf970575o. [DOI] [PubMed] [Google Scholar]
- Serafini M, Bugianesi R, Maiani G, Valtuena S, Santis SD, Crozier A. Plasma antioxidants from chocolate. Nature. 2003;424:1013. doi: 10.1038/4241013a. [DOI] [PubMed] [Google Scholar]
- Taga MS, Miller EE, Pratt DE. Chia seeds as a source of natural lipid antioxidant. J Amer Oil Chem Soc. 1984;61:928–931. doi: 10.1007/BF02542169. [DOI] [Google Scholar]
- Tomaru M, Takano H, Osakabe N, Yasuda A, Inoue K, Yanagisawa R, Ohwatari T, Uematsu H (2007) Dietary supplementation with cacao liquor proanthocyanidins prevents elevation of blood glucose levels in diabetic obese mice. Nutrition 351–355 [DOI] [PubMed]
- Vinson JA, Proch J, Bose P, et al. Chocolate is a powerful ex vivo and in vivo antioxidant, an anti-atherosclerotic agent in an animal model, and significant contributor to antioxidants in European and American diets. J Agric Food Chem. 2006;54:8071–8076. doi: 10.1021/jf062175j. [DOI] [PubMed] [Google Scholar]
- Visioli F, Bernaert H, Corti R, Ferri C, Heptinstall S, Molinari E, et al. Chocolate, life style and health. Crit Rev Food Sci Nutr. 2009;49:299–312. doi: 10.1080/10408390802066805. [DOI] [PubMed] [Google Scholar]
- Wollgast A, Anklam E. Polyphenols in chocolate. Is there a contribution to human health? Food Res Int. 2000;33:449–459. doi: 10.1016/S0963-9969(00)00069-7. [DOI] [Google Scholar]


