

Abstract
Dissimilatory sulfate reduction is a microbial catabolic pathway that preferentially processes less massive sulfur isotopes relative to their heavier counterparts. This sulfur isotope fractionation is recorded in ancient sedimentary rocks and generally is considered to reflect a phenotypic response to environmental variations rather than to evolutionary adaptation. Modern sulfate-reducing microorganisms isolated from similar environments can exhibit a wide range of sulfur isotope fractionations, suggesting that adaptive processes influence the sulfur isotope phenotype. To date, the relationship between evolutionary adaptation and isotopic phenotypes has not been explored. We addressed this by studying the covariation of fitness, sulfur isotope fractionation, and growth characteristics in Desulfovibrio vulgaris Hildenborough in a microbial evolution experiment. After 560 generations, the mean fitness of the evolved lineages relative to the starting isogenic population had increased by ∼17%. After 927 generations, the mean fitness relative to the initial ancestral population had increased by ∼20%. Growth rate in exponential phase increased during the course of the experiment, suggesting that this was a primary influence behind the fitness increases. Consistent changes were observed within different selection intervals between fractionation and fitness. Fitness changes were associated with changes in exponential growth rate but changes in fractionation were not. Instead, they appeared to be a response to changes in the parameters that govern growth rate: yield and cell-specific sulfate respiration rate. We hypothesize that cell-specific sulfate respiration rate, in particular, provides a bridge that allows physiological controls on fractionation to cross over to the adaptive realm.
INTRODUCTION
Dissimilatory sulfate reduction (DSR) is a microbial metabolism that consumes sulfate and utilizes this sulfur as a terminal electron acceptor, excreting sulfide. This process creates characteristic enrichments and depletions in the stable isotopes of sulfur that are preserved in sediments and sedimentary rocks as a legacy of the metabolic processing (1). In this way, sulfur isotope fractionation can be thought of as a phenotypic trait of the specific microbes that perform DSR. When the rock record is examined like this, the S isotope phenotype has been interpreted to be continually present in ancient sediments back to at least ≈3.5 billion years ago (2). However, the interpretation of S isotope fractionation as a phenotypic trait that can be preserved in ancient rocks opens up a basic question: does evolutionary adaptation influence the S isotope phenotype?
Evolution-driven modifications to lineages of sulfate reducers (3, 4) may be capable of influencing the isotope phenotype by modifying the relative processing rates within the DSR pathway. If growth and, in turn, the energy supplied by sulfate respiration influence survival, then the controls on sulfate uptake, the internal regulation of concentrations of metabolites, and the structure of enzymes involved in the sulfate-reducing pathway could be key selective targets that influence the isotope phenotype (5). Previous work has emphasized exclusively physiological and environmental controls on the S isotope phenotype, including temperature, sulfate concentrations, and the nature and supply rate of the electron donor (1, 6–14). Among these controls, cell-specific sulfate respiration rate (csSRR) has emerged as a sort of master variable that sets the physiological level of S isotope fractionation. However, large changes in fractionation are not always correlated with variations in csSRR or any environmental parameters (15–18).
This suggests that there is an evolutionary influence preserved in the S isotope fractionation expressed by extant sulfate-reducing microorganisms. For example, different strains of sulfate reducers metabolizing at similar, near-maximal rates can exhibit diverse S isotope fractionations (quantified as 34ε values, which are equal to the difference in molar 34S-32S ratios between sulfate and sulfide relative to the molar 34S-32S ratio in sulfide) (Fig. 1). Although environmental variation may be responsible for some of the fractionation diversity, genetic differences among these strains are likely to be influential as well. Genetic differences might reflect structural differences in the proteins responsible for sulfate respiration, for example, leading to variable fractionation by different isotope selectivity of individual enzymes (5). In fact, given the ultimate control of intracellular metabolite concentrations on fractionation, the observed fractionation diversity could be due to any genetic differences that would produce different respiratory metabolite levels (5). In this light, although environments have unquestionably changed throughout Earth history, the specific metabolic variant of DSR that was active in contemporaneous microorganisms also will influence the preserved S isotopic signature. Therefore, sulfur isotope variations in ancient rocks in part may be a fossil record of how the DSR metabolism has changed through time.
FIG 1.

34ε values from pure cultures of sulfate-reducing microbes with metabolic rates in a range similar to that of this study (50 to 125 fmol cell−1 day−1). Larger data sets are displayed as boxplots, whereas smaller data sets are displayed as individual points. Data labeled with a superscript letter are from the following references: a, reference 13; b, reference 8; c, reference 12; d, reference 15; e, reference 16; f, reference 9.
As a step toward addressing this possibility, we performed selection experiments that examined the response of the S isotope phenotype to evolutionary adaptation. Specifically, we examined one of the simplest cases possible, where replicate populations from a clonal ancestor are serially propagated in a well-defined environment (19). Since respiration rate is a common factor underlying growth rate and fractionation, we thought such an experiment would produce common directional changes in fitness and fractionation. Pure cultures of a sulfate-reducing bacterium were propagated through daily serial transfer in batch cultures, maintaining constant environmental challenges to growth for ≈1,000 generations. Since evolutionary adaptation typically occurs in a hyperbolically decreasing manner (19), major enhancements in the ability of an organism to directly outcompete its ancestors (i.e., fitness, which is the primary indicator of evolutionary adaptation) occur early on, within experimentally obtainable time frames of hundreds of generations. In the same environment as the adaptive evolution experiment, the populations were monitored for changes in fitness, 34ε, exponential growth rate, cell-specific respiration rate, and cell yield. By archiving the sample populations, these experiments produced a short but complete span of evolutionary history, where selective pressures were tightly controlled and the impact of evolutionary adaptation on the S isotope phenotype could be directly compared between ancestral populations and evolved lineages.
MATERIALS AND METHODS
Choice of model organism.
We used a wild-type sulfate-reducing deltaproteobacterium, Desulfovibrio vulgaris Hildenborough (DVH), in our study. DVH has a sequenced genome (20) and is commonly used as a model organism to investigate the evolutionary, physiological, enzymatic, genetic, and growth characteristics of sulfate-reducing bacteria (20–25). Importantly, experiments have shown that populations of DVH can express a wide range of S isotope fractionations that vary predictably with the rate of sulfate respiration (8, 10, 11, 26). This plasticity in the S isotope phenotype provides a well-defined framework against which to compare any adaptive effects on S isotope fractionation.
Design of microbial evolution experiment.
The evolution experiments were designed to select for increased growth rate in a simple and reproducible manner rather than to investigate selective responses to novel environmental, physiological, or genetic challenges. Twelve replicate lines of DVH were serially propagated in batch culture in a chemically defined growth medium optimized for DVH (Fig. 2). Most of the cell divisions in this experimental setup occur during a scramble for resources (27, 28). This type of serial selection experiment in batch culture has been shown to lead to changes in fitness as well as net growth rate (19, 25). Six of the lines were taken from an isogenic wild-type population, whereas six were taken from a reference mutant strain (DVU0600; http://www.microbesonline.org/) constructed from the wild-type DVH. The mutant strain contains unique oligonucleotides (a barcode) flanking an antibiotic resistance cassette for kanamycin that replaced a gene encoding putative lactate dehydrogenase. This genetic manipulation was neutral with respect to the fitness of the mutant strain relative to the wild-type lines (Table 1). We refer to lineages arising from the wild-type ancestral population as DVH-wt and those arising from the mutant ancestral population as DVH-mut.
FIG 2.

Illustration of the experimental workflow. Daily serial transfers produce ≈5 generations of growth per day. The resulting evolved lineages are archived at intervals of ≈100 generations. Archived ancestral and evolved lineages are revived simultaneously to measure the phenotypic differences over two selection intervals (generations 0 to 560 and generations 560 to 927).
TABLE 1.
Fitness and growth characteristics of lineages during the evolution experiment
| Lineage name | Generation | Fitnessa | σc | k (day−1) | σ | Y (106 cells/μmol SO4) | σ | csSRR (fmol/cell/day) | σ |
|---|---|---|---|---|---|---|---|---|---|
| Ancestor | |||||||||
| Rep 1 | 0 | 4.00 | 0.39 | 56.7 | 5.1 | 70.5 | 9.4 | ||
| Rep 2 | 0 | 4.05 | 0.33 | 44.9 | 3.1 | 90.3 | 9.6 | ||
| Rep 3 | 0 | 3.61 | 0.39 | 49.0 | 5.1 | 73.5 | 10.9 | ||
| Rep 4 | 0 | 1.006 | 4.66 | 0.25 | 54.5 | 2.3 | 85.5 | 5.8 | |
| Rep 5 | 0 | 1.000 | 4.29 | 0.27 | 48.0 | 2.4 | 89.4 | 7.2 | |
| Rep 6 | 0 | 1.001 | 4.29 | 0.23 | 55.3 | 2.6 | 77.6 | 5.6 | |
| Mean | 1.002b | 0.003 | 4.15 | 0.35 | 51.4 | 4.7 | 81.1 | 8.4 | |
| Generation 560 | |||||||||
| A | 560 | 1.176 | 0.003 | 4.21 | 0.68 | 44.8 | 7.6 | 94.0 | 22.0 |
| B | 560 | 1.173 | 0.004 | 5.23 | 0.69 | 66.7 | 9.0 | 78.3 | 14.8 |
| C | 560 | 1.148 | 0.010 | 5.13 | 0.74 | 66.9 | 10.2 | 76.6 | 16.1 |
| D | 560 | 1.185 | 0.019 | 5.12 | 0.60 | 70.4 | 8.8 | 72.7 | 12.5 |
| E | 560 | 1.177 | 0.006 | 4.53 | 0.83 | 78.1 | 17.3 | 58.0 | 16.7 |
| F | 560 | 1.175 | 0.004 | 4.74 | 0.57 | 79.6 | 11.2 | 59.6 | 11.0 |
| Mean | 1.172 | 0.012 | 4.83 | 0.40 | 67.8 | 12.5 | 73.2 | 13.3 | |
| Generation 927 | |||||||||
| A | 927 | 1.213 | 0.007 | 3.77 | 0.42 | 77.0 | 9.2 | 48.9 | 8.0 |
| B | 927 | 1.194 | 0.018 | 5.71 | 0.45 | 46.6 | 2.1 | 122.6 | 11.1 |
| C | 927 | 1.178 | 0.003 | 5.76 | 0.53 | 47.9 | 2.4 | 120.2 | 12.6 |
| D | 927 | 1.188 | 0.015 | 5.71 | 0.38 | 56.7 | 2.2 | 100.6 | 7.8 |
| E | 927 | 1.212 | 0.006 | 6.01 | 0.56 | 60.4 | 3.0 | 99.6 | 10.5 |
| F | 927 | 1.196 | 0.007 | 5.83 | 0.46 | 55.7 | 2.5 | 104.7 | 9.5 |
| Mean | 1.197 | 0.014 | 5.46 | 0.84 | 57.4 | 11.0 | 99.4 | 26.7 |
Fitness assays were performed independently of the growth assays whose results are shown in the rest of the table. Fitness is expressed relative to that of ancestral DVU-mut, which is effectively equal to that of ancestral DVH-wt.
The fitnesses of ancestral DVH-wt and DVH-mut are effectively equal.
Uncertainty estimated from biological and technical replicates. See the text for details.
Every 24 h, each of the replicate lines was propagated in batch culture by inoculating 0.6 ml of the previous culture into 10 ml of fresh, defined medium in 20-ml serum bottles capped with blue butyl rubber stoppers (Fig. 2). The headspace was 100% N2 gas (99.995% purity). Cultures were incubated at 33°C and shaken at 110 rpm. Subculturing was alternated between wild-type and mutant lineages, because cross-contamination between DVH-wt and DVH-mut can be monitored (described below). Approximately every 10th transfer, the 12 replicate lines were preserved in a glycerol stock solution at −80°C to obtain a fossil record of the evolution experiment (Fig. 2). These frozen stocks were revived at later times for isotopic, growth, and fitness measurements. All inoculations, sampling, and transfers were performed under strictly anaerobic conditions.
Growth media.
All experiments were performed in a Tris-buffered chemically defined medium (MOLS4) that consists of 30 mM sodium sulfate, 60 mM sodium lactate, 8 mM MgCl2, 20 mM NH4Cl, 2 mM K2HPO4-NaH2PO4, 30 mM Tris-HCl, as well as solutions of trace elements, Thauer's vitamins, and rezasurin as an oxygen indicator (29). The pH was adjusted to 7.2 with hydrochloric acid. For the solid medium, 1.5% (wt/vol) agar was added. For the evolution experiments, 10 ml of MOLS4 was placed into 20-ml serum bottles, while 80 ml of MOLS4 was placed into 120-ml serum bottles for the fitness and isotope assays. Bottles were crimp sealed with butyl rubber stoppers, and the headspace was purged of oxygen by flushing with pure N2 gas. After gassing, individual crimp-sealed medium bottles were sterilized in an autoclave. Except for the culture volume, all our experiments (including evolution experiments and individual assays of growth and fitness) were performed in exactly the same medium under the same environmental conditions. Because sulfur isotope fractionation has a strong physiological control (5, 30), we consistently used the same culture configurations to isolate changes in phenotypic characteristics that were associated with the adaptive process.
Contamination checks.
We performed two types of contamination checks. The first tracked potential cross-contamination between different selection lines, and the second looked for contamination by foreign microbes. Subculturing was alternated between wild-type and mutant lines during the evolution experiment. As a result, cross-contamination was more likely to occur between DVH-wt and DVH-mut lines than between DVH-wt lines. In order to determine if such cross-contamination occurred, samples of the wild-type cultures were screened for growth on plates made with an antibiotic (400 μg G418 antibiotic per ml of MOLS4 medium) that selects for the kanamycin cassette defining the DVH-mut. These contamination checks were performed approximately every 100 generations and were always negative.
We also PCR amplified and sequenced the 16S rRNA gene in order to check that the cultivated lineages were composed of DVH. A detailed procedure is available in the supplemental material. In all 12 evolved lineages and the ancestor, the 16S sequences were identical matches to the 16S rRNA gene from the DVH reference genome (20). We interpret this similarity to show that exogenous strains with higher fitness did not take over any of the populations of the evolution experiment.
Fitness assay.
We quantified the fitness of the evolved populations by direct competition experiments with ancestral populations (Fig. 2). Direct competition experiments between two strains account for environmental or demographic variations that may not be detectable when measuring culture growth independently. Detailed procedures are available in the supplemental material.
Cultures maintained at −80°C were thawed and inoculated into MOLS4. Growing cultures were transferred three times at 24-h intervals prior to performing the fitness assay. Fitness was assayed while serially transferring mixed cultures of wild-type lineages with the ancestral reference mutant over ≈50 generations. Cultures were inoculated with equal numbers of exponentially growing cells of each strain. At each transfer, we tracked the relative frequency of the genetic barcode of the reference mutant relative to that of a gene shared by both strains (dsrA; see the supplemental material) with real-time PCR (RT-PCR). Since the evolved lineages ended up having higher fitness than the ancestral population, this technique was able to monitor only the fitness of the evolved wild-type strains. A similar method has been used for monitoring the fitness of RNA viruses (31) and for quantifying the relative survival of algae under predation by a rotifer (32). We compared the fitness of the experimental lineages over two selection intervals. The first selection interval lasted from the start of the experiment (i.e., with the ancestral population at generation 0) to generation 560. The second interval spanned from generation 560 to generation 927. Fitness measurements were made on six biological replicates at generation 0 and three biological replicates for each of the six lineages at generations 560 and 927.
Characterization of sulfur isotope fractionation.
We measured S isotope fractionation by ancestral DVH wild-type and mutant populations six times each (Fig. 2). We also measured fractionation of each evolved population over the same intervals at which fitness was assayed (560 and 927 generations). A detailed methodology is available in the supplemental material. Cultures used for sulfur isotope fractionation measurements were grown in the same way as cells prepared for fitness assays (described above). At the start of the assay, 5 ml of a mid-exponential-phase culture (optical density at 600 nm [OD600] of ∼0.2) was inoculated into gassed and sterile assay bottles containing 80 ml of MOLS4 and a magnetic stir bar. The assay bottles were vigorously stirred while simultaneously being purged with pure N2 gas for 2 to 3 h to remove any sulfide that was carried over with the inoculum. Repeated tests showed that the sulfide blank in the assay medium after purging was <5 ppm. Immediately after purging, we took a sample (labeled T0, for time zero corresponding to the start of the incubation) to characterize the initial S isotope composition of the sulfate (and sulfide; described above) in the medium. Assay cultures were incubated at 33°C and shaken at 110 rpm. We halted cell growth and sulfate respiration by adding 10 ml of an acidic 4% (wt/vol) zinc acetate solution once enough sulfide was produced for a reliable isotope measurement, typically when <10% of the initial sulfate had been consumed (Table 2). This also preserved the sulfide that had been produced since T0 as ZnS. This sample (labeled T1) provided the S isotope composition of the product sulfide as well as the residual sulfate.
TABLE 2.
Mass balance and isotopic characteristics of individual lines during the evolution experiment
| Generation no. and lineage ID | f | 34ε | 33λ | σ for: |
|
|---|---|---|---|---|---|
| σ34ε | σ33λ | ||||
| 0 | |||||
| Rep 1-wt | 0.97 | 10.06 | 0.5060 | 0.13 | 0.0016 |
| Rep 2-wt | 0.97 | 7.60 | 0.5073 | 0.13 | 0.0016 |
| Rep 3-wt | 0.98 | 7.78 | 0.5082 | 0.13 | 0.0017 |
| Rep 4-wt | 0.95 | 6.83 | 0.5067 | 0.13 | 0.0018 |
| Rep 5-wt | 0.83 | 7.00 | 0.5081 | 0.13 | 0.0019 |
| Rep 6-wt | 0.96 | 6.55 | 0.5130 | 0.13 | 0.0012 |
| Rep 1-mut | 0.96 | 8.66 | 0.5077 | 0.13 | 0.0014 |
| Rep 2-mut | 0.99 | 6.34 | 0.5078 | 0.14 | 0.0021 |
| Rep 3-mut | 0.81 | 5.46 | 0.5046 | 0.13 | 0.0022 |
| Rep 4-mut | 0.75 | 5.74 | 0.5100 | 0.14 | 0.0019 |
| Rep 5-mut | 0.97 | 6.39 | 0.5088 | 0.13 | 0.0019 |
| Rep 6-mut | 0.88 | 5.14 | 0.5044 | 0.13 | 0.0024 |
| Rep 7-mut | 0.98 | 7.05 | 0.5047 | 0.14 | 0.0017 |
| 560 | |||||
| A | 0.99 | 10.04 | 0.5084 | 0.14 | 0.0012 |
| B | 0.99 | 9.54 | 0.5080 | 0.14 | 0.0012 |
| C | 0.92 | 8.19 | 0.5123 | 0.13 | 0.0013 |
| D | 0.92 | 8.94 | 0.5070 | 0.13 | 0.0015 |
| E | 0.94 | 10.09 | 0.5087 | 0.13 | 0.0014 |
| F | 0.93 | 7.34 | 0.5133 | 0.13 | 0.0012 |
| F (replicate) | 0.99 | 6.99 | 0.5091 | 0.13 | 0.0017 |
| G (DVH-mut) | 0.95 | 6.73 | 0.5087 | 0.14 | 0.0018 |
| H (DVH-mut) | 0.98 | 5.90 | 0.5141 | 0.13 | 0.0021 |
| I (DVH-mut) | 0.97 | 8.34 | 0.5121 | 0.13 | 0.0015 |
| J (DVH-mut) | 0.92 | 7.90 | 0.5094 | 0.13 | 0.0016 |
| K (DVH-mut) | 0.97 | 7.17 | 0.5131 | 0.13 | 0.0017 |
| L (DVH-mut) | 0.97 | 6.58 | 0.5110 | 0.13 | 0.0019 |
| 927 | |||||
| A | 0.94 | 6.12 | 0.5087 | 0.14 | 0.0020 |
| B | 0.96 | 7.17 | 0.5085 | 0.13 | 0.0017 |
| C | 0.93 | 8.58 | 0.5100 | 0.13 | 0.0014 |
| D | 0.93 | 8.25 | 0.5109 | 0.14 | 0.0015 |
| E | 0.94 | 6.00 | 0.5109 | 0.13 | 0.0020 |
| F | 0.96 | 6.22 | 0.5092 | 0.14 | 0.0020 |
| G (DVH-mut) | 0.80 | 6.02 | 0.5078 | 0.13 | 0.0021 |
| H (DVH-mut) | 0.90 | 6.49 | 0.5082 | 0.13 | 0.0019 |
| I (DVH-mut) | 0.85 | 6.54 | 0.5106 | 0.13 | 0.0019 |
| J (DVH-mut) | 0.89 | 5.05 | 0.5077 | 0.14 | 0.0025 |
| K (DVH-mut) | 0.88 | 6.54 | 0.5111 | 0.13 | 0.0019 |
| L (DVH-mut) | 0.80 | 6.09 | 0.5089 | 0.13 | 0.0020 |
The 34S-32S and 33S-32S ratios of sulfate at T0 and T1, and that of sulfide at T1, provided six data points that could be used to constrain the three parameters determining S isotope fractionation under the assay conditions, as well as their measurement uncertainty (see the supplemental material). These are the fraction of sulfate left unconsumed during the assay (f), the intrinsic discrimination of 34S from 32S during sulfate respiration (34ε), and the intrinsic discrimination of 33S from 32S during sulfate respiration (33ε). We use the following definitions for 34ε and 33ε:
The mass differences among 34S, 33S, and 32S impart a strong covariation between 34ε and 33ε values, such that 33ε ≈ 0.5 × 34ε (33). In order to look at variability around this common factor of 0.5, 33S-32S fractionations typically are expressed relative to 34S-32S fractionations using 33λ values defined with the following formula:
Natural variation in 34S-32S fractionations is small, leading to 34ε values that are always close to 0. In order to highlight this variation, which is significant given the precision and accuracy with which it can be measured, 34ε values are multiplied by a factor of 1,000 and expressed as parts per thousand (‰).
Measurement of exponential growth characteristics.
Exponential growth characteristics and S isotope fractionation share strong physiological controls through the common influence of cell-specific sulfate reduction rate. This necessitates that exponential growth characteristics are determined during the same experimental assay as fractionation. As a result, our exponential growth characteristics are based on only two sampling points, because we could not repeatedly sample the growing cultures without violating isotopic mass balance and producing erroneous estimates of S isotope fractionation.
Specific growth rates (k in day−1) of exponentially growing cells were calculated as
where T0 is the time of the initiation of the experiment (in days), T1 is the first sampling time (in days), and C0 and C1 are the cell concentrations (in cells ml−1) at these times. We estimated cell concentrations by measuring the optical density of an actively growing culture at 600 nm. Each OD measurement was performed in triplicate. The OD measurements were converted to cell concentrations via a single constant conversion factor (11.4 × 10⁸) obtained by counting individual cells in dilute, 4′,6-diamidino-2-phenylindole (DAPI)-stained aliquots of actively growing ancestral and evolved lines with an epifluorescence microscope. Our cell concentrations were comparable to previously published estimates of exponentially growing DVH under identical growth conditions (34). Analytical uncertainty estimates on growth rate were propagated from the uncertainty on measurements of OD (see Table S1 in the supplemental material). In order to confirm that the growth rates calculated from this method were indeed increases in exponential growth rate rather than decreases in the lag phase, we developed a real-time growth curve assay that used a home-built optical density logger (35) in order to monitor population growth. Details of the logger and the procedure are available in the supplemental material.
Determinations of yield (Y; in 106 cells per μmol SO42− consumed) and cell-specific sulfate reduction rate (csSRR; in fmol SO42− consumed per cell per day) were based on concentrations of hydrogen sulfide produced by exponentially growing cultures. Concentrations were measured with a commercial sulfide kit based on a colorimetric method (63). Absorbance was measured on a Genesys 10S UV-visible spectrophotometer at 670 nm. The spectrophotometer was calibrated with mixed standards of dissolved sodium sulfide and zinc chloride that were reproducible to ±0.1 mM.
Once H2S concentrations and cell numbers were measured, we estimated yield during exponential growth with the following formula:
where [H2S]0 is the concentration of H2S (in mM) at the initiation of the experiment, [H2S]x is the concentration of H2S (in mM) at later sampling times, and the factor of 106 adjusts the units of yield to 106 cells per μmol SO42−. This expression assumes a 1-to-1 stoichiometry between SO42− consumed and H2S produced. The cell-specific sulfate reduction rate during exponential growth was calculated from estimates of growth rate and the yield as
where the factor of 103 adjusts the units of csSRR to femtomoles SO42− per cell per day.
RESULTS AND DISCUSSION
Fitness trajectories reflect an optimization regimen of evolutionary adaptation.
The mean fitness of the DVH wild-type ancestor relative to the mutant reference strain was 1.002 ± 0.003 (uncertainty is reported as the sample standard deviation unless otherwise noted; n = 12) (Fig. 3A and Table 1), justifying our use of the mutant ancestor as a reference strain and attesting to the precision and reliability of estimating fitness with the RT-PCR assay developed here. With this assay, the DVH-wt lineages showed fitness increases over the first 560 generations that were between 14.8% and 18.5%. This corresponds to a mean fitness increase across these lines of 17.2% ± 1.2% over the first selection interval, which is an average change in mean fitness of 0.031% ± 0.002% per generation (Fig. 3A and Table 1). Between generation 560 and generation 927, the fitness of individual lineages increased between 2.0% and 3.6% relative to the fitness at generation 560, with a mean fitness increase across lineages of 2.4% ± 1.3%. The average change in mean fitness for this selection interval is 0.007% ± 0.004% per generation, which shows that the rate of increase in mean fitness decreased as the experiment progressed (Fig. 3). We interpret the competition experiments as evidence for a difference in the mean fitness of the ancestral and evolved populations at generation 560 as well as of the evolved populations at generation 560 and generation 927.
FIG 3.
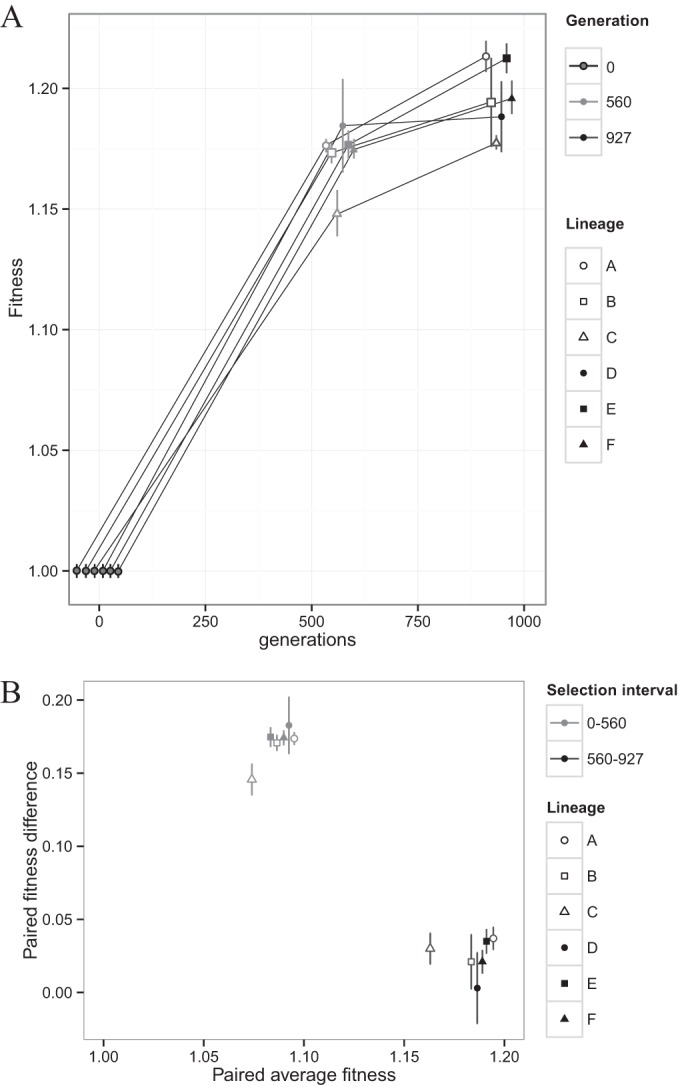
Magnitudes of fitness improvements decrease with increasing generations. (A) Fitness of DVH-wt ancestor and evolved lineages as determined by direct competition experiments as a function of the number of generations. Data from specific generations are jittered along portions of the x axis for easier visualization. Symbols indicate individual lineages, while shades of gray indicate different generations. Error bars indicate 1σ uncertainty on biological replicates (n = 12 for the ancestor, n = 3 for each evolved lineage). (B) Difference in fitness for each lineage from the start to the end of a selection interval (paired fitness difference) against the average fitness for the lineage over that interval. Symbols indicate individual lineages, while shades of gray indicate different selection intervals. Error bars indicate propagated 1σ uncertainties on biological replicates (n = 12 for ancestor, n = 3 for each evolved lineage).
To examine whether the lineages had adapted during the course of the evolution experiment, we first constructed a simple two-way analysis of variance (ANOVA) between fitness across lineages and generations (see Table S2 in the supplemental material). There was a significant effect of generation on fitness (F2,30 = 1,649.6; P < 0.01) and lineage on fitness (F5,30 = 7.4; P < 0.01). Interaction between generation and lineage was significant (F10,30 = 2.2; P < 0.05), suggesting that while fitness changes were strongly impacted by the passage of generations, the magnitude of fitness changes was lineage specific. A repeated-measures ANOVA supports this result. Such an approach accounts for the fact that the generation factor is nested within subjects and is used here because the response of fitness through time appears nonlinear (36). The repeated-measures approach reveals a highly significant effect of generation on fitness; all lineages are significantly affected by generation (F2,10 = 637; P < 0.01), suggesting that in all cases fitness was increasing across lineages as the evolution experiment progressed.
In order to simply understand the effect of lineage on fitness, we discuss each generation individually, because generation 0 has the special distinction of being the common ancestor of all lineages, as illustrated in a single-factor ANOVA of generation 0, where the measured fitnesses are not significantly different (F5,12 = 2.0; P = 0.14). In single-factor ANOVAs of generations 560 and 927, however, lineage significantly affects fitness (F5,12 = 5.0 [P = 0.01] and F5,12 = 4.9 [P = 0.01], respectively). While all lineages are evolving in the same direction in terms of fitness, apparently the fitness increases for each lineage are not set on the same predetermined course. This inference also is clear graphically from plots of the difference in fitness for each lineage from the start to the end of a selection interval (paired fitness differences) against the average fitness for the lineage over that interval (Fig. 3B).
The fitness dynamics of the DVH-wt lines resemble those seen in other serial transfer experiments with microbial populations over similar time scales. For example, rates of mean fitness changes measured in evolving glucose-limited populations of the gammaproteobacterium Escherichia coli increased quickly over the first 600 generations (approximately 0.0375% per generation) but then decreased to approximately 0.008% per generation over the next 400 generations (19). Similarly, in selection experiments with the methylotrophic alphaproteobacterium Methylobacterium extorquens AM1, growing on a single-carbon substrate, mean fitness increased at a rate of 0.054% per generation over the initial 300 generations of growth and decreased to 0.009% per generation between generations 900 and 1,500 (37). In five hundred generations of evolution on nutrient-rich medium, 640 separate lines of the model eukaryotic microbe Saccharomyces cerevisiae exhibited a mean fitness that increased at a rate of 0.013% per generation (38). With a wide range of microorganisms and in a variety of selective environments, it seems that experimental evolutionary adaptation produces a common pattern of generally decreasing rates of fitness increase, often with strikingly similar magnitudes in the deceleration of the actual rates. This behavior is characteristic of adaptive evolution in a regimen of optimization rather than innovation (28). In this regimen, beneficial mutations tend to modify the extent, rather than the kind, of existing metabolic and genetic networks leading to, for example, changes in the levels of gene expression and magnitudes of metabolic fluxes (28).
The overall fitness trajectories of the evolved DVH-wt lineages appear to be similar, but this does not necessarily translate into reproducibility of the underlying population or genetic dynamics in each lineage. It is possible that the close correlations in fitness among lineages at generations 560 and 927 (Fig. 3) are because high-fitness mutants that evolve in a defined environment tend to be phenotypically similar; thus, they might have accumulated similar beneficial mutations (39). However, fitness responses of decreasing sensitivity can be a more general consequence of the hierarchal fixation of beneficial mutations (40–43), affecting the dynamics of ultimate mutation incorporation in individuals and populations (44–49). Clonal interference, for example, is a population-level process that leads to a decrease in overall adaptive rates because of the competition between multiple subpopulations, each with mutations of similar benefit (44). Diminishing-returns epistasis, on the other hand, is an individual-level effect where mutations confer smaller fitness benefits in combination than they do individually, leading to deceleration of adaptation (50). Both of these processes may play a role in setting the power-law trajectory of fitness, as adapting microbial populations sample a larger and larger number of mutations (51). However, both apparently are underlain by an inherent unpredictability regarding which groups of beneficial mutations actually become fixed (38, 52). Detailed examinations of whole genomes are required to determine whether the parallel fitness trajectories of the evolved DVH-wt lineages reflect these more stochastic events or the deterministic fixation of shared beneficial mutations. In either case, however, the patterns of fitness changes seen here indicate that the populations of DVH-wt genotypes at generations 560 and 927 are distinct from the original isogenic ancestral population and from each other.
Sulfur isotope fractionation changes consistently during evolutionary adaptation.
Ancestral populations had 34ε values between 5.14 and 10.06‰ and 33λ values between 0.5044 and 0.5141 (Table 2 and Fig. 4A). These values are consistent with previous characterizations of the S isotope phenotype of sulfate-reducing microbes at high rates of respiration (8, 9, 13). Ancestral populations of DVH-wt and DVH-mut were assayed six times each, and no significant differences were noted in the underlying distribution of 34ε (P = 0.17 for no difference in means via two-sided Student's t test assuming equal variance; n = 6) or 33λ (P = 0.23; n = 6). The means of all 12 biological replicates of the ancestral 34ε were 6.96‰ ± 1.34‰, while those for 33λ were 0.5077 ± 0.0023 on average.
FIG 4.

Isotope fractionation (34ε) over the course of the evolution experiment. (A) Measured 34ε values as a function of number of generations estimated from individual growth experiments. Data from specific generations are jittered along portions of the x axis for easier visualization. Symbols indicate individual lineages, while shades of gray distinguish generations (560 or 927) and common ancestors (DVH-wt or DVH-mut). Error bars indicate 1σ uncertainty estimates (technical replicates) on individual 34ε values based on a Monte Carlo resampling procedure (see the supplemental material). wt, wild type; mu, mutant. (B) Difference in 34ε for each lineage from the start to the end of a selection interval (paired difference in 34ε) against the average 34ε for the lineage over that interval. Symbols indicate individual lineages, while shades of gray indicate different selection intervals. Error bars indicate propagated 1σ uncertainties based on the biological replicates from the ancestral wild type (n = 6).
The range, means, and standard deviations of 34ε and 33λ values were similar among populations throughout the course of the adaptive evolution experiment (Table 2 and Fig. 4A). At generation 560, 34ε ranged from 5.90‰ to 10.08‰ across the DVH-wt and DVH-mut lines, with means of 8.06‰ ± 1.38‰ (n = 12) and an average 33λ of 0.5105 ± 0.0024. At generation 927, 34ε ranged from 5.05‰ to 8.05‰ across the DVH-wt and DVH-mut lines, with means of 6.59‰ ± 0.51‰ (n = 12) and an average 33λ of 0.5094 ± 0.0013. At each sampling time, the variability in 33λ values among populations was always similar to the magnitude of measurement uncertainty (see Fig. S1 in the supplemental material). Pure-culture experiments show that 33λ and 34ε positively covary during microbial sulfate reduction (8–11), because nearly thermodynamic isotope partitioning pins the large fractionation limits for 33λ and 34ε when respiration rates are low (5). The slope of the 33λ-34ε correlation is shallow enough that minor 33λ differences would result from the 34ε variations measured here. Large changes in 33λ appear to require alteration of the intrinsic fractionation associated with sulfate uptake (5) and, by inference, structural modification to the transporters that bring sulfate into the cytoplasm. Considering these points, we suggest that the limited variation observed in 33λ is an expected consequence of the optimizing adaptive regimen investigated here.
The comparison of fitness and 34ε was approached graphically by focusing on differences in 34ε for each lineage from the start to the end of a selection interval (paired differences in 34ε) (53). This was possible only for the DVH-wt lines. Our fitness assay relies on the ancestral DVH-mut as a reference strain and was not able to track increasing fitness in the DVH-mut lines. When paired differences in 34ε are plotted against the paired average fitness value for the lineage over that interval (Fig. 4B), S isotope fractionation appears to have changed consistently during evolutionary adaption. If 34ε values at later generations were unrelated to those at earlier generations, the paired differences in 34ε should be centered on 0 and show no systematic variation with selection interval. Instead, paired differences in 34ε are mostly positive over the first selection interval and dominantly negative over the second (Fig. 4B). These signals are robust, even in the face of the biological reproducibility of our 34ε measurements, which was 5 to 10 times greater than the uncertainty with which we were able to assay the 34ε associated with an individual population (Table 2). Although these phenotypic changes were consistent over each selection interval, their association with increasing fitness was not monotonic (Fig. 4B).
Selection is unlikely to act on the isotopic phenotype itself. Sulfur isotope exchange between sulfate and sulfide, the initial reactant and final product of sulfate respiration, reflects energy differences of ∼0.1 kJ mol−1, much less than the minimum free energy required to sustain anaerobic metabolisms (∼10 kJ mol−1) (54). Increased variability in a phenotypic trait has been seen in microbial evolution experiments when that trait itself was not under direct selection (55). This type of incidental response can arise from random variation in the initial lines used for a selection experiment (56). This is unlikely to be the case here given the clonal nature of the ancestral population. Accordingly, we looked at the DVH-wt lineages for variations in phenotypic traits that may have affected both fitness and 34ε.
Increases in exponential growth rate accompany increased fitness but not increased 34ε.
Replicate experiments with the ancestral population established growth rates (k) in the early stages of growth from 3.6 to 4.6 day−1, clustered around a mean of 4.2 ± 0.4 day−1 (n = 6) (Fig. 5A and Table 1). Across all DVH-wt lines, these average early-stage growth rates increased to 4.8 ± 0.7 day−1 at generation 560 and to 5.5 ± 0.5 day−1 at generation 927 (Table 1). The consistency of these changes across each lineage is striking, as shown by a plot of the growth rate differences for each lineage from the start to the end of a selection interval (paired growth rate differences) against the paired fitness differences for that lineage across the same interval (Fig. 6A). While fitness increases showed a nonlinear deceleration over the course of the adaptive evolution experiment, increases in early-stage growth rate appear to follow a more linear trajectory.
FIG 5.
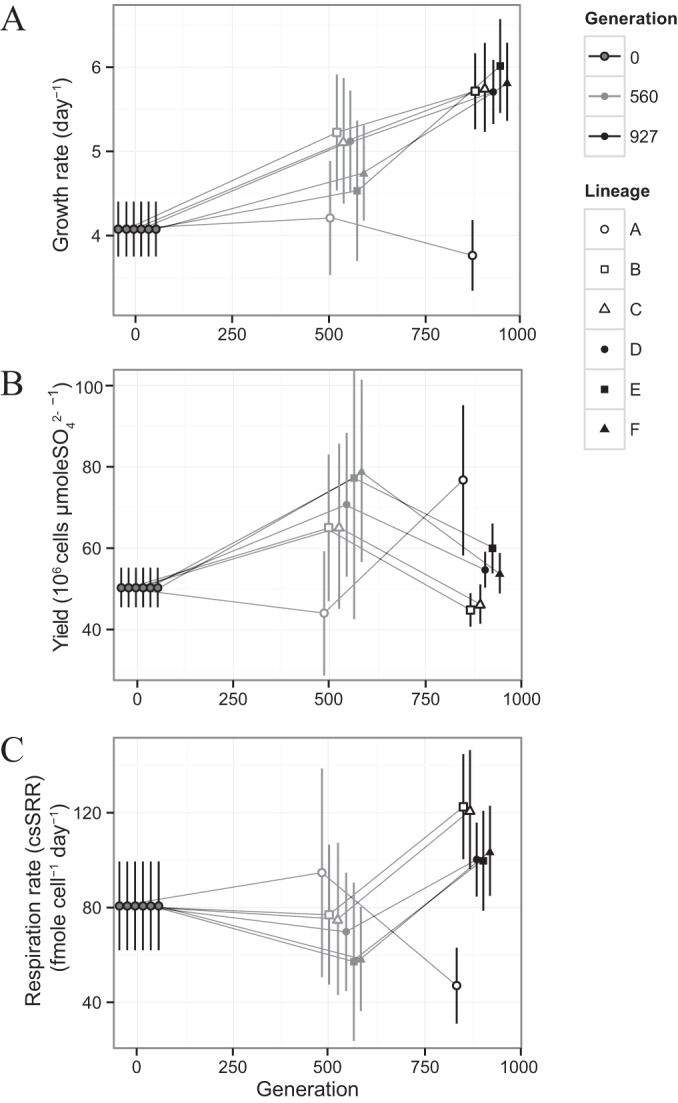
Growth characteristics of individual lineages during exponential growth taken from individual growth assays. Data from specific generations are jittered along portions of the x axis for easier visualization. Symbols indicate individual lineages, while shades of gray indicate different generations. Error bars on evolved populations indicate 1σ measurement uncertainty (technical replicates) on individual growth characteristics propagated from measurements of optical density and [H2S]. Error bars on ancestral data indicate 1σ uncertainties from biological replicates (n = 6). (A) Growth rate (k). (B) Growth yield (Y). (C) Cell-specific sulfate reduction (csSRR).
FIG 6.

Difference in growth characteristics for each lineage from the start to the end of a selection interval relative to paired differences in fitness. Symbols indicate individual lineages, while shades of gray indicate different selection intervals. Error bars indicate propagated 1σ uncertainties. (A) Paired growth rate differences relative to paired fitness differences. (B) Paired yield differences relative to paired fitness differences. (C) Paired csSRR differences relative to paired fitness differences.
In principle, overall fitness could be enhanced by adaption to any of the four phases of density-regulated growth that accompany serial transfer in batch culture (57). The competition assays accounted for the full range of possible fitness improvements, in both the low-density, nutrient-rich conditions that characterized the early phases of growth and the crowded, nutrient-poor conditions that came later. Measured increases in growth rate, however, were based on two OD measurements taken at the start and at the end of the isotope assay and only characterized the early stages of growth (7.5 to 10.5 h; see Table S1 in the supplemental material). We ran a real-time OD logging experiment in order to determine whether these measurements reflected a reduction in the duration of the lag phase or a true increase in exponential growth rates.
This experiment was run for a subset of the evolved lineages (lines WT-B, -D, and -E) at both generations 560 and 927 (Fig. 7). In all cases, the slopes of the log-normalized OD600 measurements for the evolved populations were steeper than those for the ancestral DVH, with the lineages at 560 generations (Fig. 7A) exhibiting slightly shallower slopes than the lineages at 927 generations (Fig. 7B). This suggests that the growth rates measured during the isotope assays reflect changes in exponential growth rates alone rather than in some combination with changing lag times. We interpret these results to show that the evolved lineages at generations 560 and 927 possess heightened exponential growth rate relative to the ancestral population (Fig. 5A and 7A and B). The evolved lineage A appears to be the sole inconsistency in this statement (Fig. 5A). All other lineages evolved the ability to replicate at a higher rate than the ancestor during exponential growth. Adaptive effects at high population density may have been more important during the first selection interval than during the second, accounting for the lack of strict proportionality between exponential growth rate and fitness (Fig. 6A). However, as was the case for DVH adapting to salt stress (24) or a mutualistic, non-sulfate-reducing lifestyle with the archaeon Methanococcus maripaludis (25), exponential growth rate appears to be a primary selective target for adaption during serial transfer of batch cultures of DVH.
FIG 7.
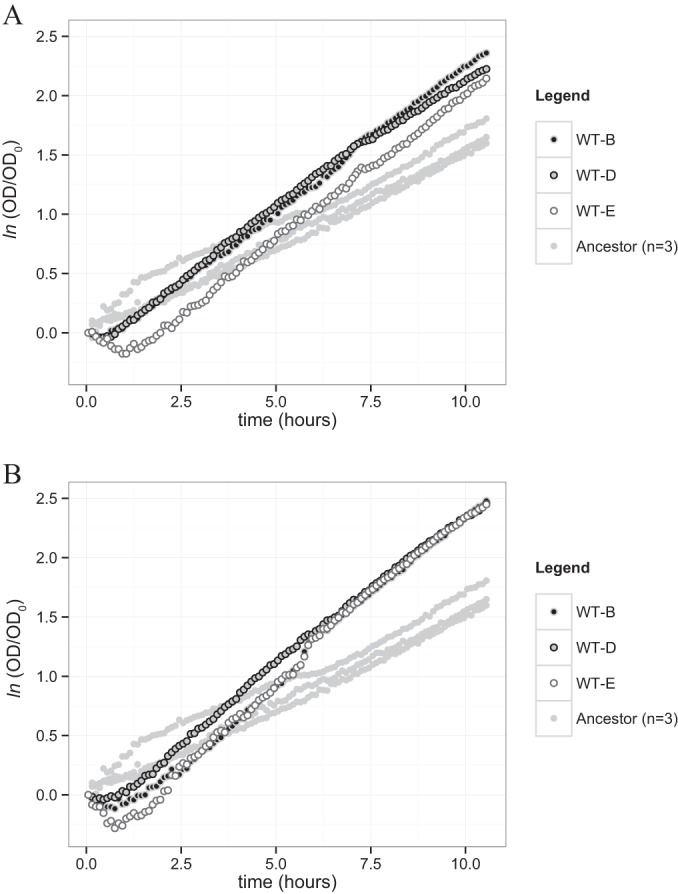
Time evolution of the natural logarithm of the normalized population density of evolved lineages and the ancestral population. Two-shaded dots correspond to the evolved lineages, while the uniform gray dots correspond to the individual replicate runs of the ancestral population (n = 3) and provide a visual guide to the background variability in the results. (A) Assay of lineages WT-B, -D, and -E at generation 560. (B) Assay of lineages WT-B, -D, and -E at generation 927.
Although exponential growth rates increased throughout the course of the experiment, 34ε values did not. The same relative changes in growth rate (≈0.5 to 0.6 day−1) over each selection interval were associated with opposite, and near equal, effects in 34ε (Fig. 8A). Despite the direct association of increased exponential growth rate with enhanced fitness during evolutionary adaptation, changes in S isotope fractionation do not appear to reflect simply the increased growth rates.
FIG 8.

Difference in 34ε for each lineage from the start to the end of a selection interval relative to the paired differences in growth rate, yield, and csSRR. Symbols indicate individual lineages, while colors indicate different selection intervals. Vertical error bars indicate propagated 1σ uncertainties based on the biological replicates from the ancestral population (n = 6). (A) Paired differences in 34ε relative to paired growth rate differences. (B) Paired differences in 34ε relative to paired yield differences. (C) Paired differences in 34ε relative to paired csSRR differences.
Exponential yield and respiration rates covary with fitness increases and 34ε changes.
Across the DVH-wt lines, cell yields during exponential growth increased slightly after the first selection interval and fell by a similar amount after the second (Fig. 5B). Cell-specific sulfate respiration rates during exponential growth (csSRR), on the other hand, exhibited contrasting behavior, with minor changes over the first interval and large increases after the second (Fig. 5C). The signal-to-noise ratio for determinations of yield is hampered by the small accumulation of H2S during the growth assays. One way to increase the reliability of these estimates would be to extend the growth assays over longer times. However, this approach changes our results only in detail (see Table S1 in the supplemental material). Since yield estimates over longer growth assay times consider a portion of the growth cycle where growth rate was not monitored, we used the initial estimates of yield for calculating csSRR and further analysis.
Paired differences in yield show a consistent covariation with fitness, with the large fitness gains seen in each lineage over the first selection interval accompanied by increases in yield and the smaller fitness gains of the second interval associated with yield decreases (Fig. 6B). As implicit in the definition of csSRR, decreased respiration rates are associated with the initial fitness increases that accompany increased yields (Fig. 6C). Respiration rates increase over the second interval and are larger in magnitude than the respiration changes that came earlier (Fig. 6C). One lineage (A) was a clear exception to these patterns, largely as a result of the atypically low exponential growth rates estimated for this population at generations 560 and 927 (Table 1). However, lineage A has a fitness trajectory that is consistent with other lines and 34ε values that are equivalent as well. We do not have an explanation for the atypical growth rate that we estimated.
Like fitness changes, paired differences in 34ε show a systematic variation with exponential yield and csSRR (Fig. 8B and C). When yield changes were positive, 34ε changes were positive; when yield decreased, 34ε decreased (Fig. 8B). Since exponential growth rates increased monotonically throughout the course of the adaptive evolution experiment (Fig. 5A), variations in exponential csSRR are a reflection of those seen in yield. For the first selection interval, this led to decreased csSRR associated with positive changes in 34ε, while the negative 34ε changes over the second selection interval accompanied csSRR increases (Fig. 8C). Again, lineage A showed behavior that did not fit these patterns.
Consequences of adaptive evolution for the S isotope phenotype.
Over the last 60 years, great efforts have been made to understand the controls on isotope fractionation during dissimilatory sulfate reduction (26, 58, 59), because a working knowledge of how environmental conditions affect S isotopes during DSR allows the reconstruction of past environmental conditions (7, 60). Electron donor, temperature, and sulfate concentration all impose constraints on portions of the DSR metabolism and, in turn, affect the S isotope signature that is produced (1, 6, 7). At high concentrations of sulfate, it is the rate of respiration of sulfate within a microbial cell that appears to explain a large portion of the isotopic selectivity. Increasing csSRR is observed to affect the magnitude of S isotope fractionation in a hyperbolically decreasing manner (8–14). This behavior likely results from the enhanced production of respiratory enzymes with increasing csSRR, which leads to diminished isotopic sensitivity to csSRR (5).
With this physiological response as a guide, our results suggest that the adaptive consequences on 34ε recapitulate physiological ones within the optimization adaptive regimen in which we conducted our experiments. If a common mechanism is shared by the physiological and adaptive influences of csSRR, then the lineages in the evolution experiment likely saw beneficial mutations that changed protein expression levels rather than protein structure. This inference is consistent with experiments that directly test how adaptive optimization works at a molecular level, by first tuning protein expression (61) to weaken metabolic pathways that are not necessary and to enhance flux through pathways that are essential (62). We might expect such a similarity between evolutionary adaptation and physiological acclimation, given the rapidity of these regulatory changes during adaptation and the languid occurrence of those that affect enzyme structure.
However, the interaction between evolutionary adaptation and the isotope phenotype is sure to be more complex than a simple resemblance to physiological acclimation. Some evolution-driven adaptations might influence genes that epistatically interact with genes affecting the isotope phenotype while others may not. If this is the case, then isotope phenotype and evolutionary adaptation may not be correlated in a broad sense but might be more contingent upon the development and optimization of particular functional traits (e.g., sulfate uptake, enzyme activity, and csSRR). If the isotope phenotype is correlated with specific traits, the expected trajectory of the isotope phenotype during instances of evolutionary adaptation may be able to be anticipated. A microbial evolution experiment that starts with a strain further from the fitness peak than the DVH-wt used here might be able to answer these questions. It also may point toward a way to reconcile evolutionary adaptation with the isotope phenotype and its preserved variation in the rock record.
Conclusion.
This investigation shows that short-term evolutionary adaptation can affect the S isotope phenotype of sulfate-reducing microorganisms. The dissimilatory sulfate-reducing bacterium Desulfovibrio vulgaris Hildenborough increased its growth rate during a simple microbial evolution experiment. Our experimental design led to mean fitness that always increased with time but at a decreasing rate, reaching improvements of ∼20% after nearly ≈1,000 generations of selection. At the high growth rates of the experiment, fitness changes were directly correlated with changes in exponential growth rate. In contrast, growth rate did not appear to play a direct role in shaping the isotope phenotype.
Changes in 34ε were consistent within a given selection interval, although they differed in sign, from slightly positive over the first interval to slightly negative over the second. These changes appeared to vary in concert with changes in cell-specific sulfate reduction rate and yield. A physiological control of cell-specific sulfate reduction rate on 34ε is well known, with higher rates leading to lower 34ε. We observed a similar inverse association between 34ε and cell-specific sulfate reduction rate, leading to the possibility that adaptive effects on the sulfur isotope phenotype recapitulate physiological ones, at least at the high growth rates encountered here.
Because the initial growth rates of the ancestral DVH are high, evolutionary adaptation may have a weaker impact on the genes responsible for the expression of 34ε than under other conditions conducive to lower initial growth rates. Since a common mechanism behind physiological and evolutionary change is gene expression, we hypothesize that evolutionary situations where fitness increases are directly hinged on increases in the physiology of sulfate reducers would promote higher respiration rates and lower 34ε values.
Supplementary Material
ACKNOWLEDGMENTS
We thank three anonymous reviewers for their supportive comments and for guiding us to a constructive reevaluation of the basic questions and methodological assumptions behind our study. We acknowledge Jesse Colangelo-Lillis for assistance with counting cells and thoughtful comments on this paper and Nadia Mykytczuk and Rebecca Austin for their efforts in the development of the RT-PCR fitness assay.
This work was supported by NSERC through a Canada graduate fellowship to A.P., Discovery and RTI grants to B.A.W. and L.G.W., and a USRA grant to L.A.-T. The Stable Isotope Laboratory in the Earth and Planetary Sciences department at McGill is supported by the FQRNT through the GEOTOP research center.
Footnotes
Supplemental material for this article may be found at http://dx.doi.org/10.1128/AEM.03476-14.
REFERENCES
- 1.Habicht KS, Canfield DE. 1997. Sulfur isotope fractionation during bacterial sulfate reduction in organic-rich sediments. Geochim Cosmochim Acta 61:5351–5361. doi: 10.1016/S0016-7037(97)00311-6. [DOI] [PubMed] [Google Scholar]
- 2.Shen Y, Buick R, Canfield DE. 2001. Isotopic evidence for microbial sulphate reduction in the early Archaean era. Nature 410:77–81. doi: 10.1038/35065071. [DOI] [PubMed] [Google Scholar]
- 3.Minz D, Fishbain S, Green SJ, Muyzer G, Cohen Y, Rittmann BE, Stahl DA. 1999. Unexpected population distribution in a microbial mat community: sulfate-reducing bacteria localized to the highly oxic chemocline in contrast to a eukaryotic preference for anoxia. Appl Environ Microbiol 65:4659–4665. [DOI] [PMC free article] [PubMed] [Google Scholar]
- 4.Wagner M, Roger AJ, Flax JL, Brusseau GA, Stahl DA. 1998. Phylogeny of dissimilatory sulfite reductases supports an early origin of sulfate respiration. J Bacteriol 180:2975–2982. [DOI] [PMC free article] [PubMed] [Google Scholar]
- 5.Wing BA, Halevy I. 2014. Intracellular metabolite levels shape sulfur isotope fractionation during microbial sulfate respiration. Proc Natl Acad Sci U S A 111:18116–18125. doi: 10.1073/pnas.1407502111. [DOI] [PMC free article] [PubMed] [Google Scholar]
- 6.Canfield DE, Olesen CA, Cox RP. 2006. Temperature and its control of isotope fractionation by a sulfate-reducing bacterium. Geochim Cosmochim Acta 70:548–561. doi: 10.1016/j.gca.2005.10.028. [DOI] [Google Scholar]
- 7.Habicht KS, Gade M, Thamdrup B, Berg P, Canfield DE. 2002. Calibration of sulfate levels in the archean ocean. Science 298:2372–2374. doi: 10.1126/science.1078265. [DOI] [PubMed] [Google Scholar]
- 8.Leavitt WD, Halevy I, Bradley AS, Johnston DT. 2013. Influence of sulfate reduction rates on the Phanerozoic sulfur isotope record. Proc Natl Acad Sci U S A 110:11244–11249. doi: 10.1073/pnas.1218874110. [DOI] [PMC free article] [PubMed] [Google Scholar]
- 9.Sim MS, Ono S, Bosak T. 2012. Effects of iron and nitrogen limitation on sulfur isotope fractionation during microbial sulfate reduction. Appl Environ Microbiol 78:8368–8376. doi: 10.1128/AEM.01842-12. [DOI] [PMC free article] [PubMed] [Google Scholar]
- 10.Sim MS, Bosak T, Ono S. 2011. Large sulfur isotope fractionation does not require disproportionation. Science 333:74–77. doi: 10.1126/science.1205103. [DOI] [PubMed] [Google Scholar]
- 11.Sim MS, Ono S, Donovan K, Templer SP, Bosak T. 2011. Effect of electron donors on the fractionation of sulfur isotopes by a marine Desulfovibrio sp. Geochim Cosmochim Acta 75:4244–4259. doi: 10.1016/j.gca.2011.05.021. [DOI] [Google Scholar]
- 12.Hoek J, Reysenbach AL, Habicht KS, Canfield DE. 2006. Effect of hydrogen limitation and temperature on the fractionation of sulfur isotopes by a deep-sea hydrothermal vent sulfate-reducing bacterium. Geochim Cosmochim Acta 70:5831–5841. doi: 10.1016/j.gca.2006.07.031. [DOI] [Google Scholar]
- 13.Johnston DT, Farquhar J, Canfield DE. 2007. Sulfur isotope insights into microbial sulfate reduction: when microbes meet models. Geochim Cosmochim Acta 71:3929–3947. doi: 10.1016/j.gca.2007.05.008. [DOI] [Google Scholar]
- 14.Chambers LA, Trudinger PA, Smith JW, Burns MS. 1975. Fractionation of sulfur isotopes by continuous cultures of Desulfovibrio desulfuricans. Can J Microbiol 21:1602–1607. doi: 10.1139/m75-234. [DOI] [PubMed] [Google Scholar]
- 15.Detmers J, Brüchert V, Habicht KS, Kuever J. 2001. Diversity of sulfur isotope fractionations by sulfate-reducing prokaryotes. Appl Environ Microbiol 67:888–894. doi: 10.1128/AEM.67.2.888-894.2001. [DOI] [PMC free article] [PubMed] [Google Scholar]
- 16.Kleikemper J, Schroth MH, Bernasconi SM, Brunner B, Zeyer J. 2004. Sulfur isotope fractionation during growth of sulfate-reducing bacteria on various carbon sources. Geochim Cosmochim Acta 68:4891–4904. doi: 10.1016/j.gca.2004.05.034. [DOI] [Google Scholar]
- 17.Bruchert V, Knoblauch C, Jorgensen BB. 2001. Controls on stable sulfur isotope fractionation during bacterial sulfate reduction in Arctic sediments. Geochim Cosmochim Acta 65:763–776. doi: 10.1016/S0016-7037(00)00557-3. [DOI] [Google Scholar]
- 18.Bolliger C, Schroth MH, Bernasconi SM, Kleikemper J, Zeyer J. 2001. Sulfur isotope fractionation during microbial sulfate reduction by toluene-degrading bacteria. Geochim Cosmochim Acta 65:3289–3298. doi: 10.1016/S0016-7037(01)00671-8. [DOI] [Google Scholar]
- 19.Lenski RE, Rose MR, Simpson SC, Tadler SC. 1991. Long-term experimental evolution in Escherichia coli. I. Adaptation and divergence during 2,000 generations. Am Nat 138:1315–1341. [Google Scholar]
- 20.Heidelberg JF, Seshadri R, Haveman SA, Hemme CL, Paulsen IT, Kolonay JF, Eisen JA, Ward N, Methe B, Brinkac LM, Daugherty SC, Deboy RT, Dodson RJ, Durkin AS, Madupu R, Nelson WC, Sullivan SA, Fouts D, Haft DH, Selengut J, Peterson JD, Davidsen TM, Zafar N, Zhou L, Radune D, Dimitrov G, Hance M, Tran K, Khouri H, Gill J, Utterback TR, Feldblyum TV, Wall JD, Voordouw G, Fraser CM. 2004. The genome sequence of the anaerobic, sulfate-reducing bacterium Desulfovibrio vulgaris Hildenborough. Nat Biotechnol 22:554–559. doi: 10.1038/nbt959. [DOI] [PubMed] [Google Scholar]
- 21.He Z, Zhou A, Baidoo E, He Q, Joachimiak MP, Benke P, Phan R, Mukhopadhyay A, Hemme CL, Huang K, Alm EJ, Fields MW, Wall J, Stahl D, Hazen TC, Keasling JD, Arkin AP, Zhou J. 2010. Global transcriptional, physiological and metabolite analyses of Desulfovibrio vulgaris Hildenborough responses to salt adaptation. Appl Environ Microbiol 76:1574–1586. doi: 10.1128/AEM.02141-09. [DOI] [PMC free article] [PubMed] [Google Scholar]
- 22.Hemme CL, Wall JD. 2004. Genomic insights into gene regulation of Desulfovibrio vulgaris Hildenborough. OMICS 8:43–55. doi: 10.1089/153623104773547480. [DOI] [PubMed] [Google Scholar]
- 23.Wall J, Hemme C, Rapp-Giles B, Ringbauer J, Casalot L, Giblin T. 2003. Genes and genetic manipulations of desulfovibrio, p 85–98. In Ljungdahl L, Adams MW, Barton LL (ed), Biochemistry and physiology of anaerobic bacteria. Springer, New York, NY. [Google Scholar]
- 24.Zhou A, Baidoo E, He Z, Mukhopadhyay A, Baumohl JK, Benke P, Joachimiak MP, Xie M, Song R, Arkin AP, Hazen TC, Keasling JD, Wall JD, Stahl DA, Zhou J. 2013. Characterization of NaCl tolerance in Desulfovibrio vulgaris Hildenborough through experimental evolution. ISME J 7:1790–1802. doi: 10.1038/ismej.2013.60. [DOI] [PMC free article] [PubMed] [Google Scholar]
- 25.Hillesland KL, Stahl DA. 2010. Rapid evolution of stability and productivity at the origin of a microbial mutualism. Proc Natl Acad Sci U S A 107:2124–2129. doi: 10.1073/pnas.0908456107. [DOI] [PMC free article] [PubMed] [Google Scholar]
- 26.Kaplan IR, Rittenberg SC. 1964. Microbiological fractionation of sulphur isotopes. J Gen Microbiol 34:195–212. doi: 10.1099/00221287-34-2-195. [DOI] [PubMed] [Google Scholar]
- 27.Dykhuizen DE, Dean AM. 1990. Enzyme activity and fitness: evolution in solution. Trends Ecol Evol 5:257–262. doi: 10.1016/0169-5347(90)90067-N. [DOI] [PubMed] [Google Scholar]
- 28.Barrick JE, Lenski RE. 2013. Genome dynamics during experimental evolution. Nat Rev Genet 14:827–839. doi: 10.1038/nrg3564. [DOI] [PMC free article] [PubMed] [Google Scholar]
- 29.Zane GM, Yen H-C, Wall BJD. 2010. Effect of the deletion of qmoABC and the promoter-distal gene encoding a hypothetical protein on sulfate reduction in Desulfovibrio vulgaris Hildenborough. Appl Environ Microbiol 76:5500–5509. doi: 10.1128/AEM.00691-10. [DOI] [PMC free article] [PubMed] [Google Scholar]
- 30.Harrison AG, Thode HG. 1958. Mechanism of the bacterial reduction of sulphate from isotope fractionation studies. Trans Faraday Soc 54:84–92. doi: 10.1039/tf9585400084. [DOI] [Google Scholar]
- 31.Carrasco P, Daros JA, Agudelo-Romero P, Elena SF. 2007. A real-time RT-PCR assay for quantifying the fitness of tobacco etch virus in competition experiments. J Virol Methods 139:181–188. doi: 10.1016/j.jviromet.2006.09.020. [DOI] [PubMed] [Google Scholar]
- 32.Meyer JR, Ellner SP, Hairston NG Jr, Jones LE, Yoshida T. 2006. Prey evolution on the time scale of predator-prey dynamics revealed by allele-specific quantitative PCR. Proc Natl Acad Sci U S A 103:10690–10695. doi: 10.1073/pnas.0600434103. [DOI] [PMC free article] [PubMed] [Google Scholar]
- 33.Hulston JR, Thode HG. 1965. Variations in S33, S34, and S36 contents of meteorites and their relation to chemical and nuclear effects. J Geophys Res 70:3475–3484. doi: 10.1029/JZ070i014p03475. [DOI] [Google Scholar]
- 34.Tang Y, Pingitore F, Mukhopadhyay A, Phan R, Hazen TC, Keasling JD. 2007. Pathway confirmation and flux analysis of central metabolic pathways in Desulfovibrio vulgaris Hildenborough using gas chromatography-mass spectrometry and Fourier transform-ion cyclotron resonance mass spectrometry. J Bacteriol 189:940–949. doi: 10.1128/JB.00948-06. [DOI] [PMC free article] [PubMed] [Google Scholar]
- 35.Toprak E, Veres A, Yildiz S, Pedraza JM, Chait R, Paulsson J, Kishony R. 2013. Building a Morbidostat: an automated continuous-culture device for studying bacterial drug resistance under dynamically sustained drug inhibition. Nat Protoc 8:555–567. doi: 10.1038/nprot.2013.021. [DOI] [PMC free article] [PubMed] [Google Scholar]
- 36.Melnyk AH, Kassen R. 2011. Adaptive landscapes in evolving populations of Pseudomonas fluorescens. Evolution 65:3048–3059. doi: 10.1111/j.1558-5646.2011.01333.x. [DOI] [PubMed] [Google Scholar]
- 37.Lee M-C, Chou H-H, Marx CJ. 2009. Asymmetric, bimodal trade-offs during adaptation of Methylobacterium to distinct growth substrates. Evolution 63:2816–2830. doi: 10.1111/j.1558-5646.2009.00757.x. [DOI] [PubMed] [Google Scholar]
- 38.Kryazhimskiy S, Rice DP, Jerison ER, Desai MM. 2014. Global epistasis makes adaptation predictable despite sequence-level stochasticity. Science 344:1519–1522. doi: 10.1126/science.1250939. [DOI] [PMC free article] [PubMed] [Google Scholar]
- 39.Cooper TF, Rozen DE, Lenski RE. 2003. Parallel changes in gene expression after 20,000 generations of evolution in Escherichia coli. Proc Natl Acad Sci U S A 100:1072–1077. doi: 10.1073/pnas.0334340100. [DOI] [PMC free article] [PubMed] [Google Scholar]
- 40.Fisher RA. 1930. The genetical theory of natural selection. Clarendon Press, Oxford, United Kingdom. [Google Scholar]
- 41.Muller HJ. 1932. Some genetic aspects of sex. Am Nat 66:118–138. [Google Scholar]
- 42.Muller HJ. 1964. The relation of recombination to mutational advance. Mutat Res 1:2–9. doi: 10.1016/0027-5107(64)90047-8. [DOI] [PubMed] [Google Scholar]
- 43.Crow JF, Kimura M. 1965. Evolution in sexual and asexual populations. Am Nat 99:439–450. [Google Scholar]
- 44.Gerrish P, Lenski R. 1998. The fate of competing beneficial mutations in an asexual population. Genetica 102-103:127–144. [PubMed] [Google Scholar]
- 45.de Visser JA, Rozen DE. 2006. Clonal interference and the periodic selection of new beneficial mutations in Escherichia coli. Genetics 172:2093–2100. [DOI] [PMC free article] [PubMed] [Google Scholar]
- 46.Miralles R, Gerrish PJ, Moya A, Elena SF. 1999. Clonal interference and the evolution of RNA viruses. Science 285:1745–1747. doi: 10.1126/science.285.5434.1745. [DOI] [PubMed] [Google Scholar]
- 47.Joseph SB, Hall DW. 2004. Spontaneous mutations in diploid Saccharomyces cerevisiae: more beneficial than expected. Genetics 168:1817–1825. doi: 10.1534/genetics.104.033761. [DOI] [PMC free article] [PubMed] [Google Scholar]
- 48.Desai MM, Fisher DS, Murray AW. 2007. The speed of evolution and maintenance of variation in asexual populations. Curr Biol 17:385–394. doi: 10.1016/j.cub.2007.01.072. [DOI] [PMC free article] [PubMed] [Google Scholar]
- 49.Kao KC, Sherlock G. 2008. Molecular characterization of clonal interference during adaptive evolution in asexual populations of Saccharomyces cerevisiae. Nat Genet 40:1499–1504. doi: 10.1038/ng.280. [DOI] [PMC free article] [PubMed] [Google Scholar]
- 50.Chou HH, Chiu HC, Delaney NF, Segre D, Marx CJ. 2011. Diminishing returns epistasis among beneficial mutations decelerates adaptation. Science 332:1190–1192. doi: 10.1126/science.1203799. [DOI] [PMC free article] [PubMed] [Google Scholar]
- 51.Wiser MJ, Ribeck N, Lenski RE. 2013. Long-term dynamics of adaptation in asexual populations. Science 342:1364–1367. doi: 10.1126/science.1243357. [DOI] [PubMed] [Google Scholar]
- 52.Lang GI, Rice DP, Hickman MJ, Sodergren E, Weinstock GM, Botstein D, Desai MM. 2013. Pervasive genetic hitchhiking and clonal interference in forty evolving yeast populations. Nature 500:571–573. doi: 10.1038/nature12344. [DOI] [PMC free article] [PubMed] [Google Scholar]
- 53.Altman DG, Bland JM. 1983. Measurement in medicine: the analysis of method comparison studies. Statistician 32:307–317. [Google Scholar]
- 54.Jackson BE, McInerney MJ. 2002. Anaerobic microbial metabolism can proceed close to thermodynamic limits. Nature 415:454–456. doi: 10.1038/415454a. [DOI] [PubMed] [Google Scholar]
- 55.Travisano M, Mongold J, Bennett A, Lenski R. 1995. Experimental tests of the roles of adaptation, chance, and history in evolution. Science 267:87–90. doi: 10.1126/science.7809610. [DOI] [PubMed] [Google Scholar]
- 56.Bell G. 2013. The incidental response to uniform natural selection. Biol Lett 9:20130215. doi: 10.1098/rsbl.2013.0215. [DOI] [PMC free article] [PubMed] [Google Scholar]
- 57.Bell G. 1996. The basics of selection. Chapman & Hall, New York, NY. [Google Scholar]
- 58.Canfield DE. 2001. Biogeochemistry of sulfur isotopes. Rev Mineral Geochem 43:607–636. doi: 10.2138/gsrmg.43.1.607. [DOI] [Google Scholar]
- 59.Rees CE. 1973. A steady-state model for sulphur isotope fractionation in bacterial reduction processes. Geochim Cosmochim Acta 37:1141–1162. doi: 10.1016/0016-7037(73)90052-5. [DOI] [Google Scholar]
- 60.Canfield DE, Habicht KS, Thamdrup B. 2000. The archean sulfur cycle and the early history of atmospheric oxygen. Science 288:658–661. doi: 10.1126/science.288.5466.658. [DOI] [PubMed] [Google Scholar]
- 61.Dekel E, Alon U. 2005. Optimality and evolutionary tuning of the expression level of a protein. Nature 436:588–592. doi: 10.1038/nature03842. [DOI] [PubMed] [Google Scholar]
- 62.Lewis NE, Hixson KK, Conrad TM, Lerman JA, Charusanti P, Polpitiya AD, Adkins JN, Schramm G, Purvine SO, Lopez-Ferrer D, Weitz KK, Eils R, Konig R, Smith RD, Palsson BO. 2010. Omic data from evolved E-coli are consistent with computed optimal growth from genome-scale models. Mol Syst Biol 6:390. doi: 10.1038/msb.2010.47. [DOI] [PMC free article] [PubMed] [Google Scholar]
- 63.Cline JD. 1969. Spectrophotometric determination of hydrogen sulfide in natural waters. Limnol Oceanogr 14:454–458. [Google Scholar]
Associated Data
This section collects any data citations, data availability statements, or supplementary materials included in this article.