Abstract
Propagation of artificial light at night (ALAN) in the environment is now known to have non negligible consequences on fauna, flora and human health. These consequences depend on light levels and their spectral power distributions, which in turn rely on the efficiency of various physical processes involved in the radiative transfer of this light into the atmosphere and its interactions with the built and natural environment. ALAN can affect the living organisms by direct lighting and indirect lighting (scattered by the sky and clouds and/or reflected by local surfaces). This paper mainly focuses on the behaviour of the indirect light scattered under clear sky conditions. Various interaction processes between anthropogenic light sources and the natural environment are discussed. This work mostly relies on a sensitivity analysis conducted with the light pollution radiative transfer model, Illumina (Aubé et al. 2005 Light pollution modelling and detection in a heterogeneous environment: toward a night-time aerosol optical depth retrieval method. In Proc. SPIE 2005, vol. 5890, San Diego, California, USA). More specifically, the impact of (i) the molecular and aerosol scattering and absorption, (ii) the second order of scattering, (iii) the topography and obstacle blocking, (iv) the ground reflectance and (v) the spectrum of light devices and their angular emission functions are examined. This analysis considers different behaviour as a function of the distance from the city centre, along with different zenith viewing angles in the principal plane.
Keywords: atmospheric effects, scattering, light pollution, methods, numerical, sensitivity analysis
1. Introduction
The first studies regarding light pollution focused on its impact on the starry sky. The astrophysical research community began these studies in the 1970s. In recent years, however, the study of light pollution was updated due to the varied effects on the integrity of the nocturnal environment being discovered. These effects affect both the balance of the natural environment (flora and fauna) [1–10] and the social and economic activities of humans [11–15]. Light pollution even has significant impact on human health [16–18]. In order to study the consequences of artificial light at night (ALAN) on fauna, flora and human health, an understanding of how it depends on light levels and spectral power distributions is essential. The aim of this paper is to find relationships between the physical properties of the environment and the production of the anthropogenic spectral radiance of the night sky. The relationships will be obtained through one specific empirical experiment but mostly by using a light pollution radiative transfer model. A simple modelling scenario is suggested to achieve this goal. This scenario comprises a circular city with constant properties together with small-scale obstacles and a mountain outside the city.
To be able to characterize the relationship between ALAN and its impacts on biological organisms, one must first be able to understand the physics of its propagation. This understanding is usually conducted both by field measurements and by a theoretical approach that exploits the numerical modelling. The interaction of ALAN with the environment shows an extremely complex and nonlinear behaviour, which cannot be analytically solved so far. To overcome this limitation, several numerical models of radiative transfer have been developed in recent years [19–23]. These new developments were made possible thanks to the increasing availability of high-performance computing resources, as well as to the availability of geographical datasets, such as night-time satellite data. Such datasets greatly simplify the production of inputs to model over large territories.
Multiple variables that affect the propagation of light pollution in the environment include:
(1) The optical properties of the atmosphere that involve the behaviour of the scattering and absorption of molecules, as well as those caused by aerosols. Some atmospheric constituents, such as water vapour, ozone, aerosols and CO2, show significant spatial and temporal variability, which complicate the propagation of anthropogenic light in the atmosphere. For example, a greater presence of weakly absorbing aerosols will have the effect of increasing the scattering probability of the atmosphere which fosters a greater level of radiance from the sky near the light sources. At the same time, this will increase the attenuation of light over long distances for observers located away from sources;
(2) The spectral reflectance properties of the ground;
(3) The presence of masking by terrain and obstacles (mountains, trees, buildings);
(4) The characteristics of lighting devices (spectral power distributions, angular emission pattern (also known as light output pattern (LOP) function), spatial distribution of lighting power on the territory).
Light pollution can reach the environmental elements via three main paths: (i) direct illumination, (ii) scattered light by cloud cover and (iii) scattered light from a clear sky. Scattered light from a clear sky will be main topic for this paper. This complex process is prevalent in cases where there are long distances between the sources and the environment, but the process is also present for short distances when the direct illumination is blocked by obstacles or by the topography (i.e. in shadows as in dense canopies). Before discussing in more depth the scattered light from a clear sky process, let us introduce general considerations about the direct illumination and about light scattered by cloud cover.
Direct illumination generally has the highest light intensity. In that case, the light leaves the lighting device and hits the surface after very low alteration. The particles between the surface and the source scatter and absorb light but, in most cases, these processes are negligible compared with the intensity of the radiation and also because of the short optical paths. For example, in an urban environment, the mean free path of light to a surface is of the order of tens to hundreds of metres. The case of direct illumination is very simple to understand because it only involves geometrical effects, like the shape of the LOP, the source–surface distance and the angles. An estimation of direct lighting can be made with lighting simulation software (e.g. AGI32 or Radiance). For this reason, this process will not be discussed in this paper.
The second largest contributor is the scattering of artificial light by cloud cover. The importance of scattering by clouds in comparison with the scattering from the clear atmosphere is generally many times greater for sites near sources, such as urban and suburban environments. In the specific case of the Cabau Experimental Site for Atmospheric Research (CESAR), located in the western part of the Netherlands, Lolkema et al. [24] have determined that the night sky luminance can increase by a factor of 5–9 compared with the clear sky conditions. Similarly, Kyba et al. [25] studied the effect of cloud fraction on the sky's brightness using Sky Quality Meter (SQM) measurements for urban and rural locations. According to their results, an overcast sky in an urban environment increases the value of the sky brightness by a factor of approximately 10, while in the rural environment this amplification factor is smaller. Very far from sources, the presence of clouds generally obscures the sky, hiding the natural radiance of the starry night. Our group observed this situation at the Mont-Mégantic International Dark Sky Reserve (Canada). Similar observations can be made at many world-class astronomical observatories. Although the process of light scattering by clouds is of considerable importance for the study of light pollution, it will not be specifically dealt with in this paper. The model Illumina does not yet allow this calculation. The implementation of clouds in the model is in progress, but has neither been completed nor validated.
2. Methodology
The methodology mostly involves a modelling sensitivity analysis using simplified properties of the geographical domain in order to infer the effect of the various physical variables involved. In one exceptional case, a combination of empirical and modelling methods was used to determine the relationship between the night sky radiance and the aerosol optical depth (AOD; e.g. §3a).
(a). Model description
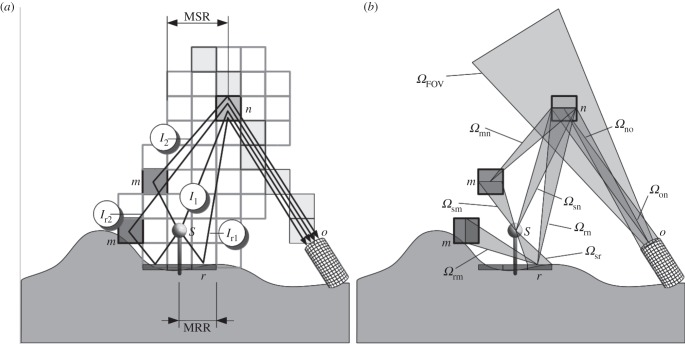
The radiative transfer model used for this study is called Illumina, v. 2 [19]. This model is distributed under Gnu Public License and is available for download from Google Code [26]. The main difference between v. 1 and v. 2 is that a statistical optimization has been added for the selection of ground-level pixels and gridded three-dimensional air elements (voxels) along the line of sight in order to reduce the computing time by a factor of approximately 50. Basically, Illumina acts as a ray-tracing software where a set of photons is thrown from light fixtures located above the ground-level pixels and then reaches the observer's field of view (FOV) following four different light paths: (i) first scattering by molecules and aerosols in voxels of the line of sight (I1), (ii) first scattering after Lambertian reflection on the ground (Ir1), (iii) a second scattering in a voxel of the line of sight after a first scattering from atmospheric voxels contained in a surrounding volume (I2), and (iv) the same path as (iii) but after reflection on the ground pixel (Ir2). The resulting approximation of the light spectral intensity (W sr−1 nm−1) Ino is expressed in equation (2.1) and illustrated in figure 1a.
| 2.1 |
Figure 1.
Modelling geometry and most important contributions to the flux perceived by an observer. MRR, maximum reflection radius which is equivalent to the average distance between obstacles; MSR, maximum radius for second order of scattering computation.
The total spectral flux (W nm−1) as perceived by a simulated observer is modelled by equation (2.2):
| 2.2 |
The different solid angles involved in equation (2.2) are illustrated in figure 1b.
The scattering processes toward the observer and the extinction by aerosols (scattering and absorption) and molecules (scattering only) are computed for all the light paths considered. Illumina computes the first and second orders of scattering of light. The second order of scattering may have a significant impact on sky radiances, especially when the observer is far from the cities [27].
The case of the propagation of light pollution is, in fact, very different from the well-studied propagation of sunlight because the sources of light pollution are spread on a large surface in comparison with the distance from the observer. The importance of the second order of scattering in that case may be understood by the fact that the first scattering dome of light acts as an extended source for the second scattering process, and thus its reduction as a function of the distance is less steep when compared with point-like sources. In addition to the explicit treatment of the second order of scattering, the main advantage of Illumina is its gridded based concept, allowing for change to the light flux power, the spectrum, the LOP, the lamp height, the ground reflectance and the topography for each pixel independently. It is then possible to model complex situations as they appear in real cities and environments.
Generally, many gridded datasets are taken from satellite remote sensing data (MODIS, DMSP-OLS, SRTM). But there are still some limitations, especially those generated by the spatial uniformity of some variables. Indeed, the AOD, relative humidity, ground-level atmospheric pressure, obstacle height and the typical distance between obstacles are spatially uniform in the model. The chemical composition of the aerosol content and the size distributions are determined by using the complex refractive index and bimodal lognormal size distributions suggested by Shettle & Fenn [28]. Their corresponding optical impacts were calculated with a Mie theory code for spherical particles, originally developed by Evans [29]. The aerosol composition may be changed according to the geographical particularities of the modelling experiment or to account for specific events, like important biomass burning or Saharan sand storms. Many standard aerosol models are available (maritime, urban, rural), with each of them defining the chemical composition, size distribution and hygroscopic properties of aerosols, which have been translated in scattering and absorption cross sections, as well as in scattering phase functions for a variety of ambient relative humidities.
(b). Standard modelling parameters set used
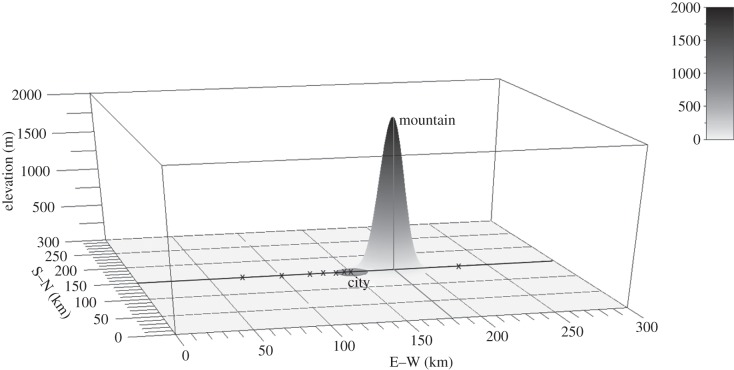
In this specific study, some simplifications of the geographical properties of the modelling domain are made as shown in figure 2. Actually, a hypothetical circular shaped city with a 10 km radius and constant lamp properties is considered. Ground reflectance was made uniform over the modelling domain. The ground elevation was set to zero for most of the grid points, except for a 2000 m high three-dimensional Gaussian-shaped mountain located 30 km eastward from the city centre. The full width half maximum used for the Gaussian function was 10 km. The city has a small slope. The westernmost pixel of the city is elevated by only 1 m, while the elevation is gradually increasing to a height of 164 m at the easternmost pixel. This elevation change occurs over a distance of 20 km (equivalent to a mean slope of approx. 0.8%). The spatial resolution used for this study is 1 km per pixel, and the domain covers a surface of 301 × 301 km, centred on the city. Light flux inside the city is set to 1000 W per pixel for each of the key spectral lines used. The idea was to study the spectral behaviour of light pollution while excluding the fact that the spectral line fluxes vary according to the mix of lamps installed. The five key spectral lines used are: 436, 498, 546, 569 and 616 nm. Each line corresponds to a common line for high pressure sodium, for metal halide, or for mercury vapour lamps. The spectral lines have been selected in such a way that they do not interfere with any important molecular absorption feature, and are only slightly impacted by the Fraunhoffer and auroral lines.
Figure 2.
Three-dimensional representation of model elevation and of lighted area. The Gaussian shape is a mountain of 2000 m elevation; the grey disc centred at (150,150) is a city 10 km in radius. The simulated observers are marked by black crosses in the E–W direction.
The reference frame and set of standard parameters were defined in order to be able to efficiently compare any variation of a given variable. The reference frame is summarized in table 1. Note that the averaged distance between obstacles and averaged obstacle height has been determined from the average distance between buildings facades and average building height in typical European city centres. For the suburbs, the distance must be increased and the building height decreased, but as of now Illumina considers this distance as a constant value all over the modelling domain. In a future version, one may expect correction of this limitation.
Table 1.
Standard parameter set used as reference.
| parameter name | value | units |
|---|---|---|
| aerosol model–Urban | ||
| relative humidity | 70 | % |
| ground-level pressure | 101.3 | kPa |
| mesh size | 1 | km |
| aerosol optical depth | 0.1 | |
| ground reflectance | 0.1 | |
| light fixture model–Cobrahead | ||
| lamp height relative to ground | 7 | m |
| sub-grid obstacle height | 10 | m |
| average distance between obstacles | 15 | m |
| reference wavelength | 569 | nm |
| distance from city centre | 0 | km |
| zenith angle | 0 | deg |
To infer the impact of each identified variable, a set of values for each variable was defined, each combination corresponding to a distinct model computation. The set of values is given in table 2. This set resulted in 163 800 different calculations that needed to be solved. Calculations were made with the supercomputer Mammouth serial II, an infrastructure maintained by Compute Canada. On average, it requires a couple of weeks to complete the computations for approximately 1000 computing nodes using this equipment.
Table 2.
Parameters used for sensitivity analysis.
| parameter name | no. values | set of values | units |
|---|---|---|---|
| aerosol optical depth | 5 | 0.05, 0.1, 0.2, 0.5, 1.0 | — |
| ground reflectance | 3 | 0.1, 0.2, 0.8 | — |
| light fixture model | 2 | Cobrahead, Helios | — |
| sub-grid obstacle height | 3 | 0, 5, 10 | m |
| reference wavelength | 5 | 436, 498, 546, 569, 616 | nm |
| distance from city centre | 13 | −80, −50, −30, −20, −10, −5, 0, 5, 10, 20, 30, 50, 80 | km |
| zenith angle | 7 | 0, 30, 50, 60, 70, 75, 85 | ° |
| azimuth angle | 2 | 90, 270 | ° |
| second order of scattering | 2 | on, off | — |
3. Results and discussion
(a). Sky radiance as a function of aerosol loading
Very few studies have inferred the dependence of the sky brightness upon aerosol loading, but a modelling experiment conducted by Tian et al. [30] showed that for a constant light source the brightness of anthropogenic light sources observed from a distance (here, approx. 50 km) is strongly dependent on AOD with a negative slope. According to Tian et al., for sites located in the suburbs or cities, the sky brightness becomes less dependent on AOD.
Pun & So [31] tried to find experimentally a relationship between the sky brightness and aerosol atmospheric content by comparing a huge database of SQM measurements taken around Hong Kong with ground-level particulate (PM2.5) concentration measurements. Note that there is a strong correlation between AOD measurements and ground-level PM2.5 concentrations [32]. The data acquired by Pun & So do not show clear relationship between aerosol loading and sky brightness (R² = 0.0667 with a very low slope). This low dependency is consistent with the results of Tian et al. [30] for cities and suburbs.
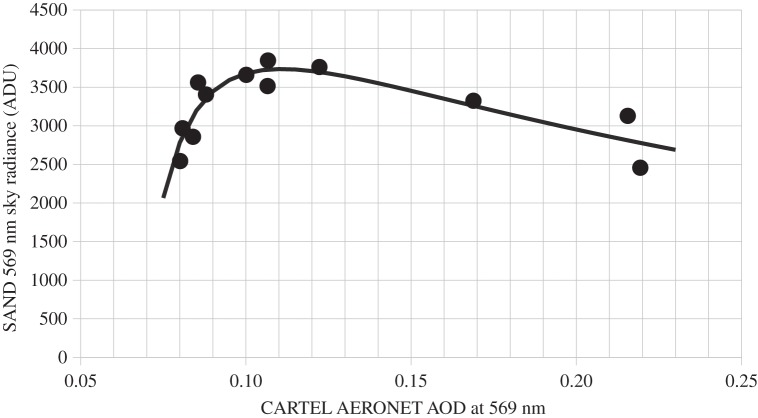
During the winter of 2009, I tried to find the AOD versus sky brightness relationship in Sherbrooke, Canada, by using the spectrometer for aerosol night detection (SAND) [33]. The methodology used compared night radiance of the 569 nm sodium line with AERONET AOD measurement (CARTEL site) which was the nearest in time (less than 6 h) [34]. Only the AERONET data which were stable were considered, and a first-order correction to the SAND data was applied to reduce the impact of temporal variations in snow cover during this period. This correction was made to account for the major impact of snow reflection on the sky radiance readings. In fact, the radiance was divided by the snow cover fraction. The SAND and the AERONET sunphotometer were located in the suburbs of Sherbrooke city and thus, according to Tian et al. [30], one must expect a weak relationship between sky radiance and AOD. This relationship, however, showed a significant increase in the AOD range 0–0.1, followed by a slow decrease. Tian et al.'s theoretical result is consistent with our observations presented in figure 3. The grey curve on that figure is a lognormal fit of the data, which is only valid for that specific case.
Figure 3.
Relationship between the sky radiance in the 569 nm sodium line, as measured with the SAND and with the AERONET sunphotometer (CARTEL site) for Sherbrooke, Canada, during March 2009. SAND data are reported in analogue to digital units (ADU) and were determined by the surface of a Gaussian fit of the spectral line.
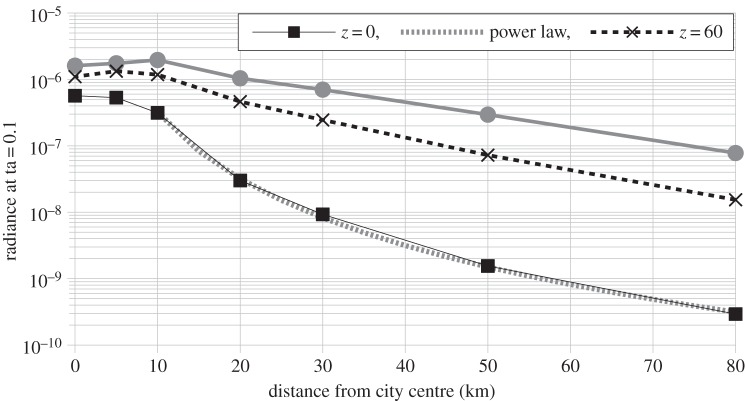
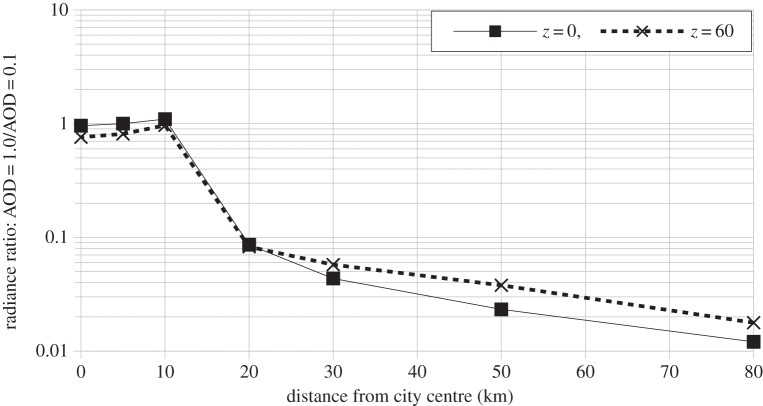
Figure 4 shows the calculated distance relationship of the radiance at 569 nm obtained with the Illumina model. The relationship is steep (note the logarithmic vertical scale) and it gets steeper when the zenith angle decreases. Note that the curve for z = 0 corresponds to the standard parameter set described in table 1. A power law was fitted on the data for distance larger than a city radius; a decreasing function with r−3.33 (R2 = 0.9933) was obtained. Figure 5 clearly shows how the ratio of the sky radiance at AOD = 1.0 (polluted atmosphere) over the sky radiance at AOD = 0.1 (clear atmosphere) is close to unity (between 0.96 and 1.10) inside the city but decreases rapidly outside city limits with increase of the distance from the city centre. As an example, at 50 km from the city centre the ratio is about 0.023. In other words, the zenith radiance is 44× larger with AOD = 0.1 compared with AOD = 1.0. This behaviour can be understood by the mechanism of extinction that reduces the light reaching the zenith direction when the observer is far from the source.
Figure 4.
Distance relationship of 569 nm sky radiance as a function of distance from the city centre for three zenith angles with AOD = 0.1 as given by the model results.
Figure 5.
Ratio of 569 nm sky radiance with AOD = 1.0 over sky radiance with AOD = 0.1 as a function of distance from the city centre.
(b). Impact of second order of scattering and small obstacles
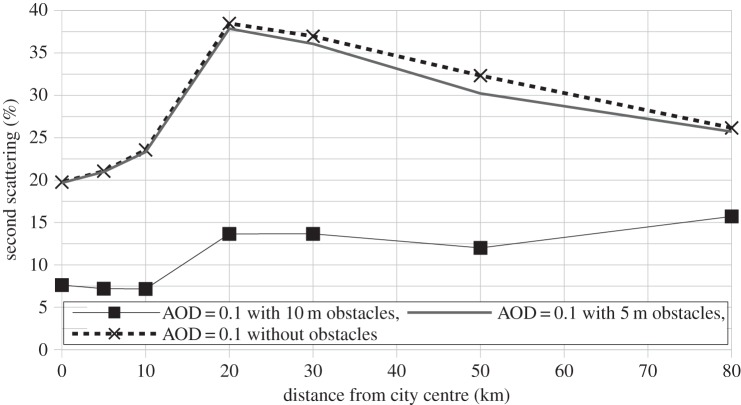
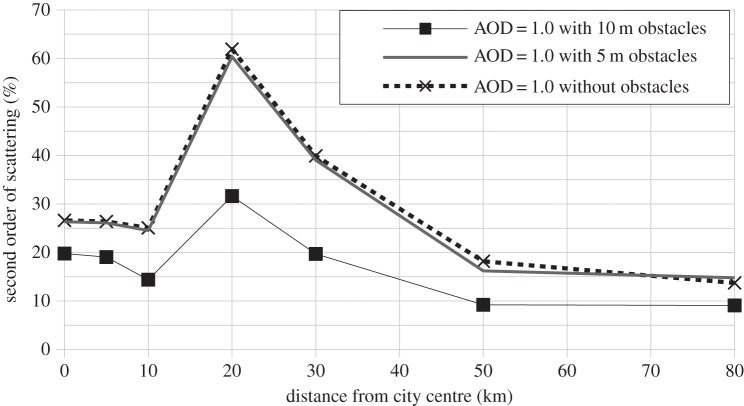
This study shows that the importance of the second order of scattering is highly dependent on the presence of blocking obstacles that are taller than light fixtures. This is consistent with the idea that obstacles block the light reaching the zenith line of sight in a remote site. Indeed, the light is more likely to reach this line of sight after one scattering process than it is directly. Figures 6 and 7 show, respectively, how the percentage contribution of the second order of scattering to the radiance varies with distance for AOD = 0.1 and AOD = 1.0. The curve with the black squares in figure 6 corresponds to our standard parameter set (table 1). Note that for both figures 6 and 7, the cases without obstacles and with obstacles lower than the light fixtures show very similar behaviour.
Figure 6.
Contribution of the second order of scattering to total radiance as a function of distance from the city centre with AOD = 0.1 (clear).
Figure 7.
Contribution of the second order of scattering to total radiance as a function of distance from the city centre with AOD = 1.0 (polluted).
For low aerosol loadings (AOD = 0.1), the contribution of the second order of scattering is generally lower inside the city perimeter (approx. 7% with obstacles), but this percentage increases rapidly when exiting the city. The maximum contribution of the second order of scattering is obtained near the city limit, where it can reach 38% without the blocking effect generated by obstacles. By adding obstacles that are taller than light fixtures, this contribution drops to 14%. In any case, the contribution of the second order of scattering is not negligible and must be taken into consideration. When the AOD rises, the percentage of the second order of scattering next to the city limits increases (compare figure 7 with figure 6). In figure 7, the percentages obtained are 62% without obstacles taller than light fixtures, and 32% with obstacles taller than light fixtures. The importance of the second order of scattering decreases more rapidly with distance for highly polluted atmospheres.
Luginbuhl et al. [21] showed that omitting the effect of light blocking by objects, such as buildings and vegetation, could lead to an overestimation of the sky brightness by a factor of more than two. This discrepancy is more important for larger zenith angles. In their study, they tried two methods to correct for obstacle blocking: the first one was to define new upward intensity distributions with the help of lighting simulation software, and the second method was to consider blocking as a process of extinction and as a function of distance (air mass).
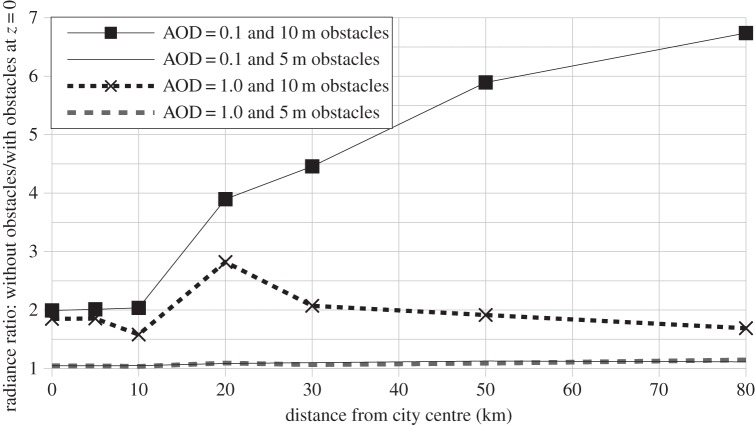
As part of this study, the relative importance of the presence of obstacle blocking for AOD = 0.1 and AOD = 1.0 as a function of the distance from the city centre for the zenith radiance was inferred. Two obstacle heights were tested: 5 m and 10 m which were, respectively, smaller and taller than light fixtures (7 m). This experiment is illustrated in figure 8 which shows that inside the city perimeter the radiance without obstacles is almost twice the radiance with the obstacles when these are taller than the light fixtures. This result is consistent with the findings of Lughinbuhl et al. [21]. When obstacles are smaller than the light fixtures, their impact is very low (a ratio slightly above unity is observed). This latter case corresponds to most suburban regions. At AOD = 0.1 (figure 8, black squares), the radiance without obstacles rapidly increases outside the city compared with the radiance with obstacles taller than the light fixtures, and is still increasing 80 km from the city centre. When AOD = 1.0 (dotted line), the ratio without/with obstacles is maximal when exiting the city, and then decreases with distance, meaning that obstacles are many times more efficient in reducing sky brightness far from cities under a clear atmosphere.
Figure 8.
Ratio of zenith radiance without obstacles over zenith radiance with obstacles as a function of distance from the city centre.
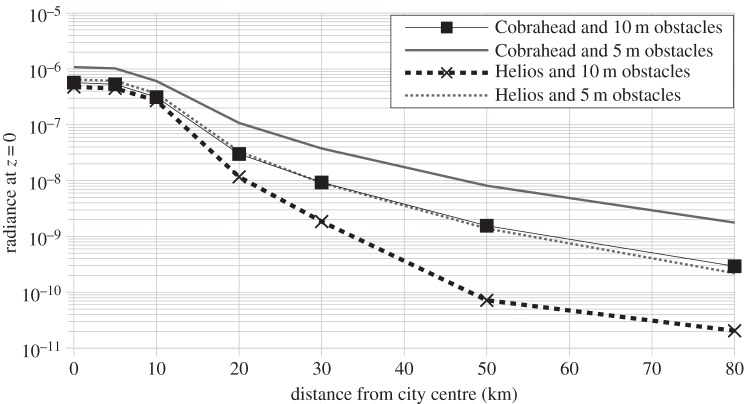
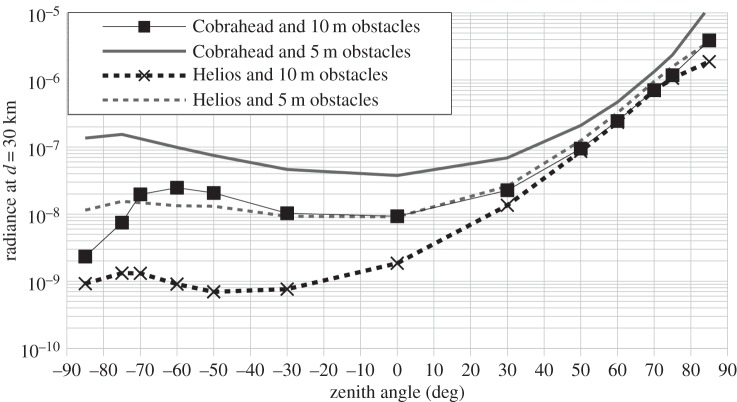
Figures 9 and 10 show, respectively, the impact of having tall and small obstacles for various zenith angles at 30 km from the city centre for an AOD of 0.1 and 1.0. The case without obstacles at AOD = 0.1 (figure 9, dotted curve) is very similar to Garstang's [35] results. Garstang's data are plotted as grey circles in figure 9; his original data were normalized to equal data at z = 0 without obstacles because of the different light power per unit of ground elements used. In Garstang's calculations, Denver was assimilated as a circular city of 15 km radius and the results are for a distance of 40 km from the city centre, both of which are different from our standard parameter set (r = 10 km and d = 30 km), and thus one should be careful with this comparison. Illumina is, however, in good agreement with Garstang's model between z = −30° and z = 40°. Garstang's calculations show lower values of the sky radiance at large zenith angles. This can be explained, in part, by the difference in LOP used by Garstang who employed a much greater upward light output ratio (ULOR) of 15% compared with the LOPs used in this study which have ULOR = 1% (Helios) and ULOR = 7% (Cobrahead). A larger ULOR produces less variation at z = 0 compared with high zenith angle radiances (see figure 12 below).
Figure 9.
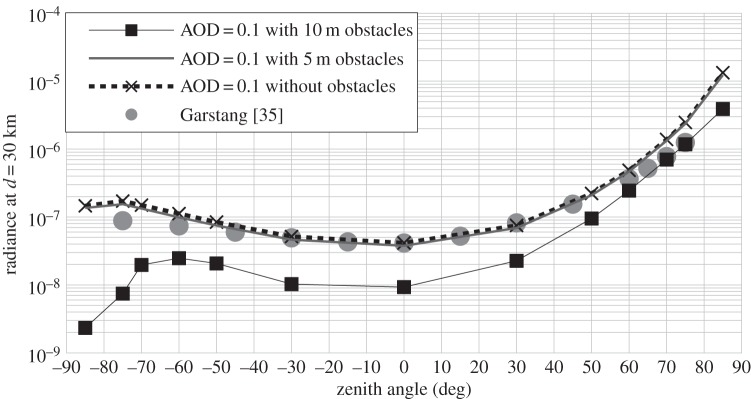
569 nm sky radiance with AOD = 0.1 as a function of the zenith angle at 30 km from the city centre.
Figure 10.
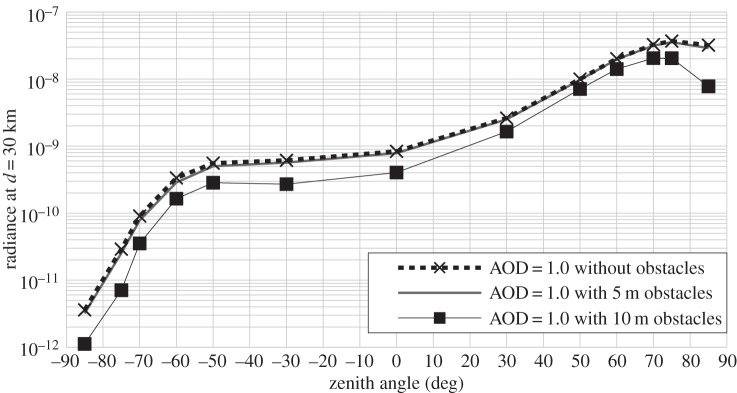
569 nm sky radiance with AOD = 1.0 as a function of the zenith angle at 30 km from the city centre.
Figure 12.
569 nm zenith sky radiance as a function of distance from the city centre with two different light fixtures (Cobrahead ULOR = 7% and Helios ULOR = 1%) at AOD = 0.1.
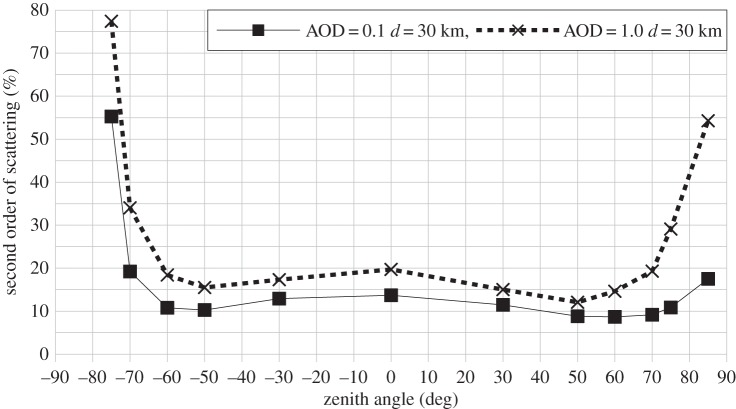
The first feature of the angular dependence of figure 9 is that, under a standard parameter set, the minimum radiance is obtained at reverse angles near the zenith. But the most striking feature is the inflection of the curve at high reverse zenith angles (z ≤−50°). Note that when z > 0, the observer looks toward the city (forward angles). Without obstacles, this inflection is small, but occurs around z = −75°. With the obstacles, the inflection occurs at z = −60° and is more important. This inflection is caused, in a large part, by the blocking of light by obstacles. According to the height and distance between obstacles that were used (10 m and 15 m, respectively), the upward light with |z| > 57° does not reach the upper layers of the atmosphere at 30 km from city centre, hence reducing the sky's radiance. In addition, a significant part of the origin of the inflection is explained by the extinction of light that increases with increasing zenith angles. Indeed, if you look at figure 10 (AOD = 1.0), the inflection in the curve is more prominent than in figure 9 (AOD = 0.1), and it also occurs toward the city (at z = 75°). The relative importance of the second order of scattering coincides with the inflection in the curve (as shown in figure 11), but actually this feature is probably a consequence of the blocking of a part of the direct upward light by obstacles taller than light fixtures. Basically to have obstacles taller than light fixtures is more or less equivalent to a reduction of the net ULOR of the lamp. Note that in figure 9, when the obstacles are smaller than light fixtures, the inflection almost vanished. Also, figure 15 below, which shows the impact of changing the ULOR of the lamps, indicates that the inflection is more important when the ULOR decreases.
Figure 11.
Contribution of the second order of scattering to total radiance as a function of the zenith angle at 30 km from city centre with AOD = 0.1 (clear) and AOD = 1.0 (polluted).
Figure 15.
569 nm sky radiance at 30 km from the city centre as a function of zenith angle with two different light fixtures (Cobrahead ULOR = 7% and Helios ULOR = 1%) at AOD = 0.1.
(c). Impact of light output pattern
This section addresses the impact of the angular distribution of light exiting the light fixture for obstacles taller and smaller than the light fixtures. As has been widely recognized by the dark sky protection community, the ULOR is of critical importance for generation of anthropogenic sky brightness. The fraction of light travelling near the horizon has also been historically identified as having a significant impact on sky brightness, especially for remote observers. Many of these concerns were identified with simplified models that had a very basic implementation of the second order of scattering. Moreover, the models did not account for blocking by obstacles or topography.
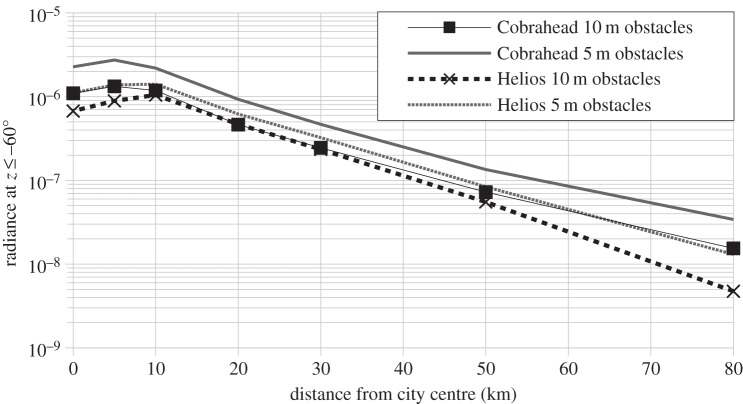
In 2007, Aubé [27] showed that light travelling near a horizon was not as critical as previously thought. Luginbuhl et al. [21] later confirmed this assertion. In 2011, Falchi [36] found that direct light (i.e. ULOR) was the main contributor to the zenith artificial sky brightness, at least for the sampled sites and that direct light contributes 75% of the artificial sky brightness. This paper explores the impact of the LOP, especially the difference in ULOR, while using the files provided by the manufacturers in the format defined by the Illuminating Engineering Society of North America. The two light fixtures used are very common in Canada: the Cooper Cobrahead fixture with type III distribution (IES file RY15H3AL.IES) and the Lumec-Schreder Helios type III fixture (IES file A210S2.IES). Basically, the Helios fixture has ULOR < 1%, while the Cobrahead has ULOR ∼ 7%. Figures 12–14 show the distance relationships obtained at z = 0 and z = 60° and for obstacle heights of 5 m and 10 m. As expected, Cobrahead fixtures generally produce more sky brightness than Helios when obstacles are smaller than light fixtures, but obstacle height also plays an important role. As an example, when obstacles are taller than light fixtures, the Cobrahead becomes almost identical to the Helios because the Cobrahead ULOR is concentrated near the horizon and this part of the flux is efficiently blocked by obstacles. Figure 14 shows that the radiance ratio of Cobrahead over Helios is near unity in the city, but can increase by one order of magnitude away from the city's border.
Figure 13.
569 nm sky radiance at z ≤−60° as a function of the distance from the city centre with two different light fixtures (Cobrahead ULOR = 7% and Helios ULOR = 1%) at AOD = 0.1.
Figure 14.
Ratio of radiance with Cobrahead over radiance with Helios as a function of distance from city centre for three different zenith angles.
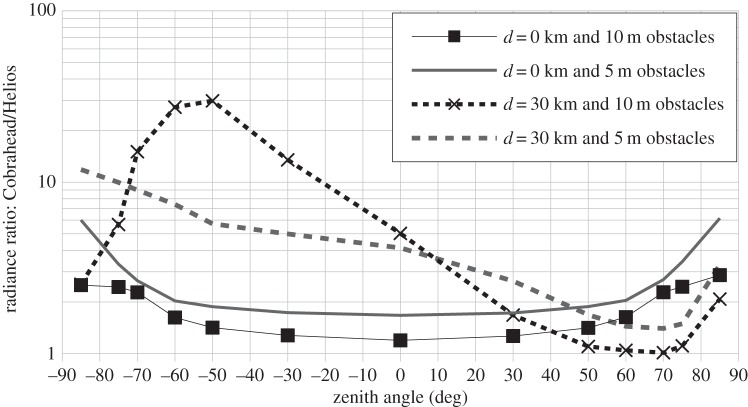
Figures 15 and 16 show similar results, but as a function of the zenith angle. The Cobrahead/Helios radiance ratio is given for two distances from the city centre (figure 16). As seen in figure 16, outside the city when obstacles are taller than light fixtures, one impact of having a larger ULOR is to have a radiance between five and 30 times higher between z = 0 and z = −70° (opposite to the city centre). When obstacles are smaller than light fixtures, a larger ULOR produces four- to eightfold a radiance increase for the same zenith angle interval and same observer position. In the direction of the city, the ULOR increase has a lower impact on the sky's radiance.
Figure 16.
Ratio of zenith radiance with Cobrahead over radiance with Helios as a function of zenith angle for two different distances from the city centre.
For an observer located in the city centre (figure 16, black squares and grey line), the ULOR increase produces a more important radiance increase at large zenith angles (z > 60° and z < −60°). This is true for both obstacle heights. At z = 85°, a change from Helios to Cobrahead increases the sky brightness by a factor of approximately three (10 m obstacles) to approximately six (5 m obstacles), but by between one and two at the zenith.
(d). Impact of terrain masking
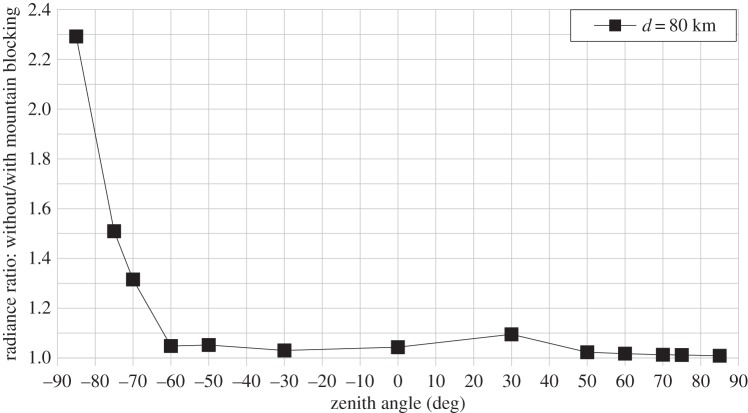
In 2001, Cinzano et al. [37] showed that the screening effect of mountains can influence significantly the sky brightness only when the mountain is near the observer. To infer the impact of masking by terrain in the present study, a mountain 2000 m high was placed eastward from the city. The summit of the mountain is located 30 km away from the city centre. Then, the observer was placed 80 km from the city centre at both sides of the city so that for the eastern observer, the mountain completely blocked the direct light from the city. The ratio of the radiance without blocking by the mountain over the radiance with blocking by the mountain as a function of the zenith angle is given in figure 17. This figure tells us that for most viewing angles, the terrain blocking only slightly reduces the sky's radiance. The radiance without the mountain is only 1.03 times the radiance with the mountain on average, from z = −60° to z = 85°. This factor increases rapidly for reverse angles larger than 60° (z ≤ 60°). The highest factor, of approximately 2.3, is obtained at 85o, the highest zenith angle computed. This rapid increase can be explained by the fact that at such angles, the observer's line of sight crosses the shadow of the mountain for most of its trajectory into the atmosphere.
Figure 17.
Ratio of sky radiance without mountain blocking to radiance with mountain blocking as a function of zenith angle 80 km from the city centre.
(e). Impact of ground reflectance
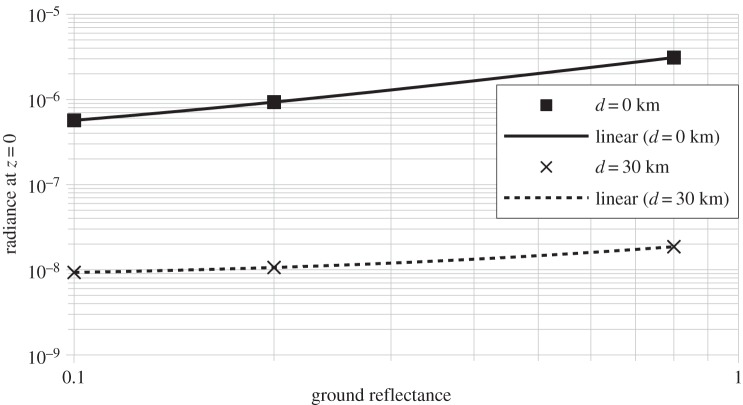
The modelling experiment was repeated for three different values of ground reflectance, from 0.1 to 0.8. The first value roughly corresponds to the usual reflectance encountered underneath light fixtures, and 0.8 corresponds to the winter ground cover dominated by snow (full snow cover has a reflectance of approx. 0.97). Ground cover dominated by snow occurs in Canada immediately after a snow storm for asphalt surfaces and almost all the wintertime for dirt roads. Normally in Canada on asphalt roads, snow is removed with salt except when the temperature is lower than approximately −23°C. In such cold conditions, snow does not melt and the snow cover can remain for many nights; the results are plotted in figure 18. The relationship between the sky's radiance at zenith and the ground reflectance is almost perfectly linear, both for the city centre and 30 km away. If one extrapolates the linear equation d = 0 km for null reflectance, a radiance of 2.07 × 10⁻⁷ is obtained, which represents the contribution of the upward flux of the light fixtures. This value is approximately 2.7 times lower than at a reflectance of 0.1 (5.68 × 10⁻⁷). In other words, the direct upward light contributes to 36% of the zenith radiance for a downtown observer when using the Cobrahead fixtures and with obstacles 10 m high. When the reflectance is 0.8 (radiance of 3.10 × 10⁻⁶), the direct contribution in the upper hemisphere represents only 6.7% of the total radiance. Similarly, 30 km away from the city centre, extrapolation at a reflectance of zero gives a radiance of 7.96 × 10⁻⁹. In that case, the upward direct light contributes to 86% of the zenith radiance at a reflectance of 0.1 (9.29 × 10⁻⁹). When the reflectance is 0.8 (radiance of 1.86 × 10⁻⁸), the direct contribution in the upper hemisphere represents 43% of the total radiance. Basically, upward emission dominates the sky zenith radiance when the observer is located far from the city, but reflected light dominates the zenith sky radiance inside the city.
Figure 18.
569 nm zenith sky radiance as a function of ground reflectance in the city centre and 30 km from the city centre.
(f). Impact of wavelength
It is well known that wavelength has a strong impact on the scattering process in the atmosphere. Thanks to the Rayleigh theory, it is known that molecules scatter light with a probability proportional to λ−4. However, aerosols, which are larger in size, scatter light with a probability proportional to λ−α with α ≈ 1, where α is the Ångstrom exponent. The Ångstrom exponent varies with the size distribution of the aerosol population. As the AOD is dependent on the wavelength, the sensitivity analysis was conducted as a function of the wavelength by setting the AOD at 546 nm to 0.1, and using an Ångstrom exponent of 1.3 to determine AOD for the four remaining key wavelengths. Then, computations of the sky's radiance at each wavelength were made, assuming that the flux emitted by the light fixture in each key wavelength was the same. This is never the case, but allowed us to better discriminate the spectral variations originating from the atmospheric and environmental effects from variations originating from the lamps' spectral distributions.
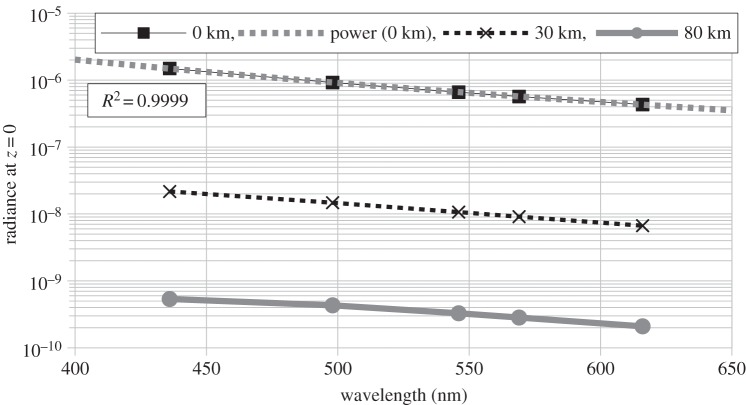
The ground reflectance was considered independently of the wavelength and a value of 0.1 was adopted. Figure 19 shows the radiance versus wavelength relationship for the three distances from the city centre (0 km, 30 km, 80 km). But the calculation was also made for all the other distances listed in table 2. Then afterward, a power function of the wavelength was fitted to each dataset. The fits showed very good correlations starting with R2 = 0.9999 for d = 0 km, to R2 = 0.9659 for d = 80 km. The power function fit of the data allowed us to track the Ångstrom exponent as a function of the distance from the city centre (figure 20). The Ångstrom exponent decreases gradually from a maximum of 3.59 at d = 0 km to 2.70 for d = 80 km. As expected, the exponent lies between the limits of the Mie and Rayleigh theories.
Figure 19.
Zenith radiance as a function of wavelength for three distances from the city centre. The grey dotted line superimposed on the black squares is a power law fit of the data with a high correlation (R2 = 0.9999).
Figure 20.
Ångstrom exponent determined by power law fits of radiance versus wavelength as a function of distance from the city centre.
4. Conclusion
To investigate the consequences of ALAN on fauna, flora and human health it is important to understand how it depends upon light levels and spectral power distributions. The aim of this paper was to identify the variables that have a significant influence on the anthropogenic radiance of the night sky. We especially wanted to determine to what extent each of these variables could affect the spectral radiance of the night sky, while establishing interactions between these variables. To achieve this goal, a simple modelling scenario comprising a circular city with constant properties plus small-scale obstacles and a mountain outside the city, was defined. The standard parameter set was also defined, which gave a starting point for the sensitivity analysis. The variables that were investigated include: ground reflectance, the height of obstacles, the blocking effect by a mountain, the AOD, the angular photometry of the light fixtures and finally the impact of wavelength of the light. The analysis was performed as a function of distance from the city centre and as a function of the zenith viewing angle in the principal plane. The main results of the sensitivity analysis are summarized below:
— With standard parameters set (AOD = 0.1, wavelength = 569 nm, reflectance = 0.1, with 10 m obstacles), the zenith radiance decreases as a 1/r3.33 function outside the city's perimeter.
— The zenith radiance is weakly dependent on AOD inside the city (R(AOD = 1)/R(AOD = 0.1) lies between 0.96 and 1.10), but is strongly dependent on AOD outside the city limits (e.g. R(AOD = 1)/R(AOD = 0.1) ≈ 0.023 at 80 km from the city centre). In other words, the zenith radiance is rapidly attenuated with distance outside the city limits under high AOD.
— The second order of scattering is very important to accurately model the sky's radiance. The second order of scattering is even more important for high AOD and when the light is blocked by obstacles. Actually, under the standard parameter set, the second order of scattering contributes to approximately 7% of the zenith radiance inside and approximately 14% outside the city. For AOD = 1.0, the second order of scattering contributes to approximately 20% of the zenith radiance inside the city, but can reach more than 30% outside. The value decreases with increases in distance.
— Inside the city's perimeter, the zenith radiance without obstacles is almost twice the radiance obtained with obstacles taller than light fixtures (i.e. 10 m high). The relative importance of the radiance without obstacles in comparison with the radiance with 10 m obstacles increases with distance to reach approximately sevenfold at 80 km from the city centre, which indicates that blocking by obstacles becomes more and more efficient in reducing the zenith sky brightness when distances are increased. The case of obstacles smaller than light fixtures (e.g. 5 m tall) is almost equivalent to the case without obstacles inside and outside the city.
— Under the standard parameter set, the radiance as a function of the zenith angle in the principal plane, is lower near the zenith at low reverse angles and increases with the zenith angle, but also shows an inflection of the curve at high reverse zenith angles (z ≤−50°). This inflection is caused by (i) the reduction of the upward flux (which can be caused by a reduction of the lamp ULOR or by blocking by obstacles) and (ii) the increasing light extinction that occurs with increased zenith angle. The last effect is more important with a larger AOD.
— Having a larger ULOR (e.g. 7% in comparison with 1%) generates larger radiances in the reverse angles for an observer located outside the city. In the direction of the city, the ULOR increase has a low impact on the sky's radiance, especially when the obstacles are taller than the light fixtures. For an observer inside the city, the increase of ULOR with tall obstacles produces a modest increase of radiance (approx. 1.2-fold at z = 0 and approx. threefold at z = 85°), but with small obstacles the increase of the radiance is greater.
— Terrain masking has a very low impact on sky brightness for most zenith angles (approx. 1.03-fold), except for very high reverse zenith angles (z ≤−70°). The low impact observed is probably an effect of the relatively great distance of the mountain in comparison with its height.
— Zenith radiance is linearly related to the ground reflectance for a fixed set of light fixtures.
— Snow cover greatly reduces the relative impact of the ULOR.
— Upward emission dominates the sky radiance at zenith when the observer is located far from the city but reflected light dominates the sky radiance at zenith inside the city.
— Zenith radiance is a power function of the wavelength, with an Ångstrom exponent ranging from approximately 3.6 in the city centre to approximately 2.7 at 80 km from the city centre. This indicates that the impact of blue light is more important at shorter distances from the city centre, but it is still large far from the city centre. This is a very important result in regard to the potential impact on biological systems. Indeed, scotopic vision is more sensitive in the blue part of the spectrum (approx. 500 nm). This is even more important for the melatonin suppression potential, because this process is more sensitive to the deep blue part of the spectrum (approx. 445 nm) [38].
Acknowledgements
Computation time on the Mammouth serial II was provided by Compute Canada.
Funding statement
This work was supported by the Fond Québécois pour la Recherche sur la Nature et les Technologie (FQRNT).
References
- 1.Longcore T, Rich C. 2004. Ecological light pollution. Front. Ecol. Environ. 2, 191–198. ( 10.1890/1540-9295(2004)002[0191:ELP]2.0.CO;2) [DOI] [Google Scholar]
- 2.Rich C, Longcore T. 2006. Ecological consequences of artificial night lighting. Washington, DC: Island Press. [Google Scholar]
- 3.Navara KJ, Nelson RJ. 2007. The dark side of light at night: physiological, epidemiological, and ecological consequences. J. Pineal Res. 43, 215–224. ( 10.1111/j.1600-079X.2007.00473.x) [DOI] [PubMed] [Google Scholar]
- 4.Buchanan BW. 2006. Observed and potential effects of artificial night lighting on Anuran amphibians. In Ecological consequences of artificial night lighting (eds Richt C, Longcore T.), pp. 192–200. Washington, DC: Island Press. [Google Scholar]
- 5.Gauthreaux SA, Belser CG. 2006. Effects of artificial night lighting on migrating birds. In Ecological consequences of artificial night lighting (eds Rich C, Longcore T.), pp. 67–93. Washington, DC: Island Press. [Google Scholar]
- 6.Kuijper DPJ, Schut J, Van Dullemen D, Toorman H, Goossens N, Ouwehand J, Limpens HJGA. 2008. Experimental evidence of light disturbance along the commuting routes of pond bats (Myotis dasycneme). Lutra 51, 37–49. [Google Scholar]
- 7.Salmon M. 2003. Artificial night lighting and sea turtles. Biologist 50, 163–168. [Google Scholar]
- 8.Nightingale B, Longcore T, Simenstad A. 2006. Artificial night lighting and fishes. In Ecological consequences of artificial night lighting (eds Rich C, Longcore T.), pp. 257–276. Washington, DC: Island Press. [Google Scholar]
- 9.Perry G, Fischer NR. 2006. Night lights and reptiles: observed and potential effects. In Ecological consequences of artificial night lighting (eds Rich C, Longcore T.), pp. 169–191. Washington, DC: Island Press. [Google Scholar]
- 10.Briggs WR. 2006. Physiology of plant responses to artificial lighting. In Ecological consequences of artificial night lighting (eds Rich C, Longcore T.), pp. 389–406. Washington DC: Island Press. [Google Scholar]
- 11.Johnson A, Phadke A, de la Rue du Cann S. 2014. Energy savings potential for street lighting in India, Lawrence Berkely National Laboratory report See http://escholarship.org/uc/item/6254f6hd.
- 12.Nordhaus W, Chen X. 2012. Improved estimates of using luminosity as a proxy for economic statistics: new results and estimates of precision. Cowles Foundation Discussion Paper No. 1857. New Haven, CT: Cowles Foundation for Research in Economics, Yale University.
- 13.Gallaway T, Olsen RN, Mitchell DM. 2010. The economics of global light pollution. Ecol. Econ. 69, 658–665. ( 10.1016/j.ecolecon.2009.10.003) [DOI] [Google Scholar]
- 14.Collison FM, Poe K. 2013. ‘Astronomical tourism’: the astronomy and dark sky program at Bryce Canyon National Park. Tour. Manage. Perspect. 7, 1–15. ( 10.1016/j.tmp.2013.01.002) [DOI] [Google Scholar]
- 15.Wanvik PO. 2009. Effects of road lighting: an analysis based on Dutch accident statistics 1987–2006. Accid. Anal. Prevent. 41, 123–128. ( 10.1016/j.aap.2008.10.003) [DOI] [PubMed] [Google Scholar]
- 16.Stevens RG. 2009. Light at night, circadian disruption and breast cancer: assessment of existing evidence. Int. J. Epidemiol. 38, 963–970. ( 10.1093/ije/dyp178) [DOI] [PMC free article] [PubMed] [Google Scholar]
- 17.Haim A, Yukler A, Harel O, Schwimmer H, Fares F. 2010. Effects of chronobiology on prostate cancer cells growth in vivo. Sleep Sci. 3, 32–35. [Google Scholar]
- 18.Fonken LK, Workman JL, Walton JC, Weil ZM, Morris JS, Haim A, Nelson RJ. 2010. Light at night increases body mass by shifting the time of food intake. Proc. Natl Acad. Sci. USA 107, 18 664–18 669. ( 10.1073/pnas.1008734107) [DOI] [PMC free article] [PubMed] [Google Scholar]
- 19.Aubé M, Franchomme-Fossé L, Robert-Staehler P, Houle V. 2005. Light pollution modelling and detection in a heterogeneous environment: toward a night time aerosol optical depth retrieval method. In Proc. SPIE 2005, vol. 5890, San Diego, California, USA. [Google Scholar]
- 20.Kocifaj M. 2007. Light-pollution model for cloudy and cloudless night skies with ground-based light sources. Appl. Opt. 46, 3013–3022. ( 10.1364/AO.46.003013) [DOI] [PubMed] [Google Scholar]
- 21.Luginbuhl CB, Duriscoe DM, Moore CW, Richman A, Lockwood GW, Davis DR. 2009. From the ground up II: sky glow and near-ground artificial light propagation in Flagstaff, Arizona. Publ. Astron. Soc. Pac. 121, 204–212. ( 10.1086/597626) [DOI] [Google Scholar]
- 22.Cinzano P, Falchi F. 2012. The propagation of light pollution in the atmosphere. Mon. Not. R. Astron. Soc. 427, 3337–3357. ( 10.1111/j.1365-2966.2012.21884.x) [DOI] [Google Scholar]
- 23.Cinzano P, Falchi F, Elvidge C. 2007. Recent progresses on a second world atlas of the night-sky brightness, LPTRAN/LPDART realistic models, tomography of light pollution, accurate validation methods and extended satellite data analysis. In Proc. Starlight 2007 Conference, La Palma, Spain, 19–20 April 2007 (eds Marin C, Jafari J.) pp. 385–400. La Palma, Spain: Starlight Initiative. [Google Scholar]
- 24.Lolkema DE, Haaima M, den Outer PN, Spoelstra H. 2011. Effects of meteorological and atmospheric parameters on night sky brightness. Report of the Netherlands National Institute for Public Health and the Environment (RIVM #680151002).
- 25.Kyba CCM, Ruhtz T, Fischer J, Hölker F. 2011. Cloud coverage acts as an amplifier for ecological light pollution in urban ecosystems. PLoS ONE 6, 3 ( 10.1371/journal.pone.0017307) [DOI] [PMC free article] [PubMed] [Google Scholar]
- 26.Aubé M. 2014. Illumina Google Code project: See https://code.google.com/p/illumina/ [accessed 1 June 2014].
- 27.Aubé M. 2007. Light pollution modelling and detection in a heterogeneous environment. In Proc. Starlight 2007 Conference, La Palma, Spain, 19–20 April 2007 (eds Marin C, Jafari J.) pp. 351–358. La Palma, Spain: Starlight Initiative. [Google Scholar]
- 28.Shettle EP, Fenn RW. 1979. Models for the aerosols of the lower atmosphere and the effects of humidity variations on their optical properties. Optical Physics Division, Air Force Geophysics Laboratory AFGL-TR-79–0214, Environmental Research Papers No. 676.
- 29.Evans BTN 1988. Dept. of National Defence, Defence Research Establishment Ottawa, 3701 Carling Avenue, Bldg 29, Ottawa, Ontario, Canada, K1A 0Z4.
- 30.Tian G, Kreidenweis SM, Moore C, Aubé M, Holben B. 2014. The effects of aerosol on night sky brightness and perception of city light domes. American Meteorological Society Meeting. In 11th Symp. on the Urban Environment, Atlanta, GA, 2–6 February 2014. [Google Scholar]
- 31.Pun CSJ, So CW. 2012. Night-sky brightness monitoring in Hong Kong: a city-wide light pollution assessment. Environ. Monit. Assess. 184, 2537–2557. ( 10.1007/s10661-011-2136-1) [DOI] [PubMed] [Google Scholar]
- 32.Wang J, Christopher S. 2003. Intercomparison between satellite-derived aerosol optical thickness and PM2.5 mass: implications for air quality studies. Geophys. Res. Lett. 30, 2095 ( 10.1029/2003GL018174) [DOI] [Google Scholar]
- 33.Aubé M. 2014. SAND project See http://cegepsherbrooke.qc.ca/aubema/index.php/Prof/SandEn [accessed 1 June 2014].
- 34.Holben BN, et al. 2001. An emerging ground-based aerosol climatology: aerosol optical depth from AERONET. J. Geophys. Res. 106, 12 067–12 098. ( 10.1029/2001JD900014) [DOI] [Google Scholar]
- 35.Garstang RH. 1986. Model for artificial night-sky illumination. Publ. Astron. Soc. Pac. 98, 364–375. ( 10.1086/131768) [DOI] [Google Scholar]
- 36.Falchi F. 2011. Campaign of sky brightness and extinction measurements using a portable CCD camera. Mon. Not. R. Astron. Soc. 412, 33–48. ( 10.1111/j.1365-2966.2010.17845.x) [DOI] [Google Scholar]
- 37.Cinzano P, Falchi F, Elvidge CD. 2001. Naked-eye star visibility and limiting magnitude mapped from DMSP-OLS satellite data. Mon. Not. R. Astron. Soc. 323, 34–46. ( 10.1046/j.1365-8711.2001.04213.x) [DOI] [Google Scholar]
- 38.Aubé M, Roby J, Kocifaj M. 2013. Evaluating potential spectral impacts of various artificial lights on melatonin suppression, photosynthesis, and star visibility. PLoS ONE 8, e67798 ( 10.1371/journal.pone.0067798) [DOI] [PMC free article] [PubMed] [Google Scholar]


