

Abstract
Artificial night-time illumination of natural habitats has increased dramatically over the past few decades. Generally, studies that assess the impact of artificial light on various species in the wild make use of existing illumination and are therefore correlative. Moreover, studies mostly focus on short-term consequences at the individual level, rather than long-term consequences at the population and community level—thereby ignoring possible unknown cascading effects in ecosystems. The recent change to LED lighting has opened up the exciting possibility to use light with a custom spectral composition, thereby potentially reducing the negative impact of artificial light. We describe here a large-scale, ecosystem-wide study where we experimentally illuminate forest-edge habitat with different spectral composition, replicated eight times. Monitoring of species is being performed according to rigid protocols, in part using a citizen-science-based approach, and automated where possible. Simultaneously, we specifically look at alterations in behaviour, such as changes in activity, and daily and seasonal timing. In our set-up, we have so far observed that experimental lights facilitate foraging activity of pipistrelle bats, suppress activity of wood mice and have effects on birds at the community level, which vary with spectral composition. Thus far, we have not observed effects on moth populations, but these and many other effects may surface only after a longer period of time.
Keywords: experimental lighting, population dynamics, daily timing, seasonal timing, cascading effects, citizen science
1. Introduction
The use of artificial illumination at night has seen a dramatic increase over the past few decades [1,2] and forms one of the major anthropogenic changes to our environment [3]. To date, knowledge on the impact of artificial light on our ecosystems is limited. With progressive urbanization and concurrent increase in the use of artificial light, a better understanding of its impact is urgently needed [4]. The disturbance of natural habitat by artificial light has been defined as ecological light pollution, and is present in virtually all ecosystems [5]. Effects of artificial light have been reported in several taxa [5,6]. These effects include mostly direct responses to existing illumination, such as attraction or deterrence. Examples are the attraction of insects to different kinds of light sources [7], and migrating diurnal birds at sea which are attracted to bright light from lighthouses, ships and oil rigs at night [8,9]. Attraction to light has in many cases directly a strong negative impact, and often leads to exhaustion or even death [7,10]. Attraction to light may also result from indirect effects, such as bat species foraging on accumulated insects around streetlights [11,12]. Deterrence by light is often much more difficult to observe, but has been found in different bat and birds species [13,14].
Many effects of artificial light include changes in behaviour and physiology. The natural light/dark cycle is the main driver for the synchronization of daily and seasonal rhythms, and disturbance of this cycle by artificial light at night may perturb the temporal organization of organisms. Indeed, in several species of birds, artificial light advances onset of dawn song [15]. Changes in other types of daily behaviour may be more straightforward, such as a switch from daily to nocturnal foraging when light is present at night in feeding habitat [16,17]. Effects of artificial light on seasonal timing of birds have also been observed [18,19]. Changes in timing may be mediated by changes in hormone regulation [20], especially by melatonin [6,21].
Over the past few years, the ecological consequences of artificial light have received an increasing amount of interest, but information on the impact of light remains limited to a few species. Moreover, many effects reported are collected in urban areas where artificial light is not the only component of anthropogenic disturbance, and where the behaviour of species in the absence of artificial light is unknown. Most importantly, very little information is present on what the eventual, long-term consequences are at the population level [22]. On many occasions, population effects may directly emerge, for example, as a result of mass mortality by direct effects of light. The eventual impact of light may, however, be much more indirect, for example by changes in behaviour and physiology of species, and hence affect several life-history traits. These may consequently adversely impact fitness, and thereby affect populations (figure 1). As a result, these effects are latent and may only emerge after a prolonged period of exposure to light. A delayed response may also originate from the effects—both direct and latent—of light on prey or predator species (‘cascading effects'). Studying those effects requires a comprehensive, ecosystem-wide and long-term approach, in a setting where other anthropogenic factors are controlled for [23].
Figure 1.
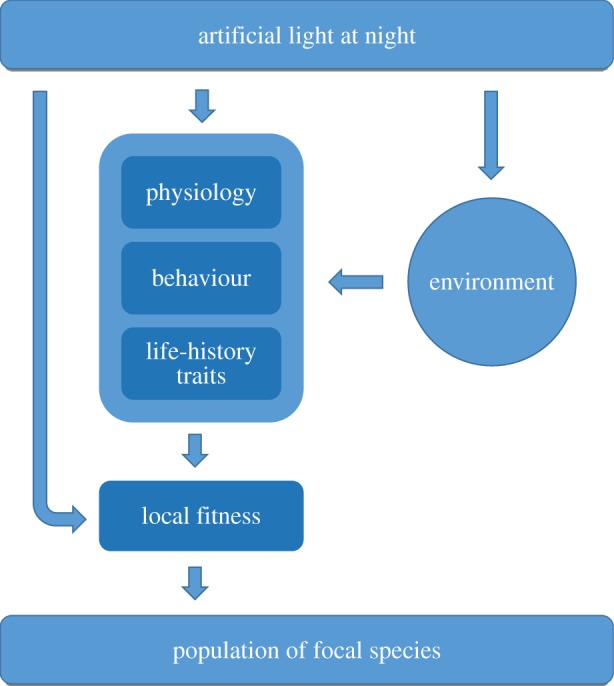
Flowchart on how artificial light may affect species at the population level. The most direct way is immediate impact on the survival of the individual (left arrow). However, light may have effects on the physiology, behaviour and life-history traits of the individual. For example, if light leads to untimely reproduction causing high juvenile mortality, fitness is affected and hence population size may decrease. Effects of light on the environment of a species may cause even more indirect effects on fitness of a species. These effects include general habitat changes, and cascading effects, for example by the availability of prey species which may themselves be affected by all possible routes shown. (Online version in colour.)
When studying the impact of artificial light, an important aspect to take into consideration is the variation in properties of different light sources which are commonly used to illuminate public space. For example, the spectral composition of light strongly varies between different lamp types. Possible effects of exposure to light result from an interaction between the spectral composition and the spectral sensitivity of organisms [24]. This complicates the interpretation of the outcome of different studies [25]. Understanding of organismal responses to differences in the spectral composition of light sources becomes ever more relevant because of the recent worldwide change to LED lighting [26,27]. Apart from economic advantages, the colour composition of LED lights can be custom designed, potentially allowing for the mitigation of impact of light on species via adaptation of the spectrum [4].
The impact of lights differing in spectral composition has rarely been studied in free-living species. One of the best examples of the reduction of impact of light by changing the spectrum is on migrating birds at sea; when the red part of the spectrum is reduced, migrating birds at night are much less disturbed by brightly illuminated oil rigs and ships [9,28], but see Evans [29]. Other examples of effects which strongly depend on spectral composition are the attraction of insects by light [30–32] and sea turtles; in both cases, attraction is reduced by light without the blue part of the spectrum [33].
The global increase of lighting, the change to LED lights and the lack of knowledge on long-term effects of light calls for an ecosystem-wide, experimental study on light at night effects, with lights with different spectral composition. In an effort to assess these effects, we established a globally unique experimental set-up, replicated eight times, designed to measure effects of long-term light exposure with different spectra on a wide range of species groups. Simultaneously, we are running in-depth experiments on moths, birds and bats to identify cascading effects, and to reveal mechanisms behind long-term effects. Here, we present the set-up of the large-scale monitoring study as well as the first results on mice, bats, birds and moths (see reference [19] for an in depth study on birds using this set-up).
2. Methods
(a). Experimental set-up
We established eight experimental field sites in forest edge habitat. At each of these sites, we placed 4 m tall lampposts in four 100 m long rows, perpendicular to the forest edge with two lampposts in the open area, one on the forest edge and two in the forest (figure 2). The distance between rows varied between 88 and 386 m (average 204 m; standard error, s.e. = 17). We used commercially available Philips Fortimo white, Clearsky green and Clearfield red light (Philips, Amsterdam, The Netherlands) for the experimental lighting. Lights were mounted in Philips Residium FGS224 (1xPL-L36W HFP) armatures. The spectral composition of lights is presented in the electronic supplementary material, figure S1. Briefly, all white, green and red lights emit full spectrum light; green lamps have an increased blue and reduced red light emission, and red lamps have an increased red and reduced blue emission. All light colours have negligible UV emission. The two-coloured spectra, with amplification and reduction of either end of the spectrum, were chosen because the lights retain a continuous and broad spectrum and enable full colour vision for humans. The green spectrum was initially designed to minimize impact on nocturnally migrating birds [9]; the red spectrum was designed to potentially minimize the impact on nocturnal species which are relatively strongly attracted to the blue part of the spectrum [30,32] or are generally sensitive to short wavelengths (bats, mice) [34,35]. The intensity of all light colours was equalized to 8.2 lux (s.e. = 0.3) at ground level beneath each lamppost. This is comparable to the light intensities used for country roads, cycle- and footpaths, and minor roads in residential areas in The Netherlands [36]. These levels are found in most other countries in northern Europe, and are ultimately based on the international CIE levels [37]. Because of differences in spectral sensitivity of the visual system and other physiological systems, different species will not experience light with different spectral composition at equal intensity. It is therefore impossible to normalize the intensity of different spectra. In our set-up, we normalized light intensity to lux, as this is the most rational choice if these light sources are installed for civil use. The lamps used have no detectable flicker rate and do not emit sound (measured up to 160 kHz). Each of the four rows at each site was randomly assigned a different light colour; one of the rows was permanently left dark.
Figure 2.
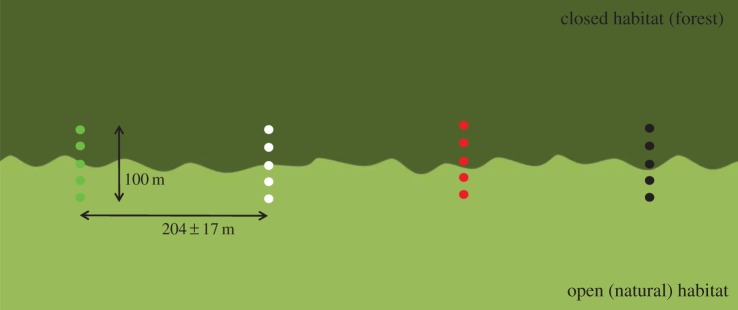
Schematic overview of set-up of a research site (replicated eight times, see electronic supplementary material, figure S2). Rows with five 4 m tall lampposts are placed in 100 m long rows, perpendicular to the forest edge. Within a site, the orientation of each row was kept constant. The distance between the rows is variable and depends on the local situation. Each row was randomly assigned a different light colour (white, red, green); one of the rows was permanently left dark. (Online version in colour.)
Seven field sites are located in the middle, and one in the north of The Netherlands (see electronic supplementary material, figure S2). In the selection of these sites, an important prerequisite was the absence of other sources of artificial light. All sites consist of forest edge, with either coniferous forest dominated by either Scots pine (Pinus sylvestris) or Douglas fir (Pseudotsuga menziesii) and an undergrowth of black cherry (Prunus serotina), blueberries (Vaccinium myrtillus) and mosses, or mixed forest with Scots pine and pedunculate oak (Quercus robur) and birch (Betula sp.) with wavy hair-grass (Deschampsia flexuosa). One site consists of deciduous forest with oak, beech (Fagus sylvatica) and alder (Alder sp.). The open areas are either heath dominated by heather (Calluna vulgaris) with purple moor grass (Molinia caerulea) and other grasses and small herbs, sandy pioneer vegetation with open lichens and grey hair-grass (Corynephorus canescens), or grassland (moist grassland with bent grasses and sedges). Forest edge habitat is relatively abundant in The Netherlands, and allows for a generic set-up with relatively high species richness and density in moths, birds, mice, bats and plants. All sites are located inside nature reserves and managed accordingly. We set up seven sites in 2011, which was kept as a dark reference year. Experimental lighting was installed in the first half of 2012, except for one site which was set up in 2012 and had lights installed in 2013 (exact data in electronic supplementary material, table S1). All lampposts are programmed to be on from sunset to sunrise, and the functionality of lights is monitored daily via the mobile phone network.
(b). Species monitoring
From early 2011 onwards, we set up a yearly assessment of birds, bats, mice, large mammals and moths (see also the electronic supplementary information on species' assessment). The monitoring of species was partially done with a citizen-science-based approach and automated where possible, and all methods were standardized [38,39]. Not all data are available yet; neither do we have data for the entire span of 4 years for all species groups. For most species groups, we therefore present data from a limited period of time; see the electronic supplementary material, table S2.
(i). Mice
The activity of mice and other small mammals was assessed with the use of camera traps (Reconyx HC500, Reconyx, Holmen, WI) aimed at concrete tiles baited with fish oil during two weeks in August and two weeks in September. All photographed species were manually identified and counted with the use of custom software (written by K.S.).
(ii). Bats
Foraging bats were recorded each year during one week in June and July, and one week in August and September. Echolocation calls were recorded with Pettersson D500x bat detectors (Pettersson Elektronik, Uppsala, Sweden) placed in the forest edge by the Dutch Mammal Society (Zoogdiervereniging), close to the middle lamppost, with the microphone directed to the open field. When triggered by a sound above 15 kHz and of sufficient amplitude and duration (see electronic supplementary material), the detector was set to automatically record sound for 5 s. Sound files were first scrubbed from falsely triggered recordings by ambient noise, and subsequently analysed with Sonobat software (Sonobat, Arcata, CA), and then calls were identified with iBatsID [40]. As we cannot identify individual bats, the number of 5 s files with echolocation call sequences per night was used as an activity measure.
(iii). Birds
Birds were surveyed by professional field ornithologists from the Dutch Centre for Field Ornithology (Sovon), who visited each site eight times during each breeding season (March—July). Whether birds were considered breeding was determined on the basis of species specific behaviour and presence during consecutive visits following standard protocols described by van Dijk & Boele [39]. In order to measure recruitment and survival of birds, birds were caught and ringed with a uniquely numbered aluminium ring during six mornings per breeding season with 50 m mist nets per transect, all done by volunteers and coordinated by the Dutch Centre for Avian Migration and Demography (Vogeltrekstation). These data will be presented elsewhere. At each transect, nine nest-boxes were put up to assess timing of breeding and reproductive success of hole-breeding passerines. Results from the first nest-box study are published in this issue; see [19].
(iv). Moths
Moths were sampled annually during five to eight nights between 1 May and 1 September with no rainfall, wind speed below 4 BFT and temperature above 8°C. Moths were caught with the use of two Heath traps (Vermandel, Hulst, The Netherlands) equipped with a small 6 W actinic lamp [41,42] right beneath the lamppost in the forest edge at each transect. The following morning all macromoths were identified to species level by volunteers and professionals of Dutch Butterfly Conservation (De Vlinderstichting) and released. Except for one site, micromoths were not identified. The aim was to assess different effects of the experimental lighting on locally present moth species, and therefore to collect representative samples of the remaining moth fauna. When collecting moths with Heath traps by attracting them to the low intensity actinic lamp underneath the much more powerful experimental lights, the samples may not be representative. For example, a low number of moths caught can be explained by the distraction of moths from the traps to the experimental lights, or as a reduction in the local moth population as a result of the long-term exposure of the local habitat to the experimental light. So, to prevent direct competition in attraction of moths to the experimental lights and the Heath traps, we kept the Heath trap light as the only light source present by switching off the experimental lights during sample nights. Most species are attracted only when in close proximity to the type of Heath traps used (less than 25 m), which makes this method suitable for local sampling [41,42].
(v). Plants
Vegetation was precisely described in 2011 by the Dutch Foundation for Botanical Research (Floron) using permanent quadrats underneath the streetlights, using the Braun–Blanquet scale. This method is detailed and allows us to monitor potential changes in the vegetation as a result of the illumination. This was repeated in 2014 (data are not yet available). For the area around the streetlights, a Tansley scale was used. This is a coarser scale suitable for characterizing larger areas. It is less suitable for monitoring changes, but serves as a description of the different locations and can be used to assess differences in habitat between sites and explain observed differences in the occurrence of animals between sites. All plant data will be published at a later stage.
(c). Statistical analysis
(i). Mice
We analysed data collected during 12 or more nights, at seven sites between 11 September and 15 November 2012. We restricted the analysis here to wood mice (Apodemus sylvaticus). To prevent bias by the presence of vegetation or vegetation height around the concrete tiles, only mice photographed on the baited concrete tiles were included in the analysis. The presence of wood mice (A. sylvaticus) was tested in a generalized linear mixed-effect model (GLMM) with Poisson error distribution. The response variable was defined as the number of mice photographed per night per camera, and treatment (i.e. light colour: white, red, green and dark control) as explanatory variable. We included site and date as random variables. In order to account for overdispersion, we added an observation-level random effect. For all species groups, significance of variables was tested using likelihood ratio tests comparing a model including the variable of interest with a model without the variable.
(ii). Bats
We have limited the analysis of bat calls collected to between 24 June and 15 July 2013, and to common pipistrelles (Pipistrellus pipistrellus), the most frequently recorded species at all sites. Calls were collected for a minimum of three consecutive nights for all light treatments at all eight sites. For statistical testing, we took the number of 5 s call sequences per night per transect. We used a GLMM with Poisson error structure with light treatment as explanatory variable, and with site and night as random variables. We added an observation-level random effect in order to account for overdispersion. To test for differences between light treatments and dark control, we used pairwise GLMMs with one light treatment and dark control, and applied a Bonferroni correction to control for the familywise error rate.
(iii). Birds
Bird data were included from five sites in 2011, seven sites in 2012 and at all eight sites in 2013.
First, we assessed the area size around the lampposts where the largest difference in species richness (Menhinick's index) was present between light treatments. Because of non-normal distribution of yearly numbers per species, we calculated the year-to-year difference in observations for each species within this area around each transect. We took this as a response variable in a GLMM with light colour treatment and year pair (2011–2012 and 2012–2013) as explanatory variables, and with site and bird species as random variables. In a second model, we included the interaction with treatment and year as an additional explanatory variable. Finally, we tested for differences between treatments post hoc with Bonferroni-corrected pairwise Student's t-tests.
(iv). Moths
Moths were surveyed on two sites in 2011, and on five sites in 2012 and 2013. Because of the low sample size in 2011, we limited our analysis to 2012 and 2013. We included only macromoth species. Owing to high variability in the number of individuals per species caught between sites, we analysed the moth data at the family level. We took the number of individuals caught per family per night as response variable, and light colour treatment as explanatory variable with site and date as random variables in a GLMM with Poisson error structure, again with an additional observation-level random effect to account for overdispersion. We also analysed the total number of moths (all individuals) caught per night, in a comparable model. Both models were compared with null models (without treatment) in log likelihood ratio tests. All tests for all of the species groups were performed in R v. 3.1.1. [43].
3. Results
(a). Mice
The camera traps produced 13 291 photographs, with nine mammal species in total. Wood mice were the most common species with 4990 photographs (37.5%). Apart from just one exception, wood mice were exclusively photographed between dusk and dawn. On average, wood mice were photographed 12.3 times per transect (two cameras per transect) per night. Exposure to light strongly reduced the number of mice photographed, the effect of light treatment was highly significant (χ2 = 67.8, d.f. = 7, p < 0.0001; figure 3).
Figure 3.
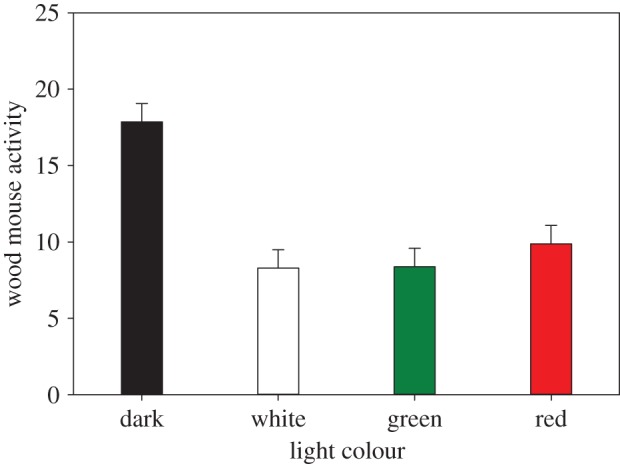
Activity of wood mice (Apodemus sylvaticus); number of photographs per night per transect (two cameras active per transect; model estimates for light treatment corrected for random variables). Error bars indicate standard error. (Online version in colour.)
(b). Bats
We collected 5410 5 s recordings of bat echolocation call sequences in total. On average, we recorded 41.1 (s.e. = 8.5) call sequences per transect per night. Light colour treatment had a significant effect on the number of call sequences (χ2 = 12.4, d.f. = 3, p < 0.01; figure 4). Generally, compared with dark control, pipistrelles appeared to be significantly more active throughout the night at the green illuminated transects (χ2 = 8.0, d.f. = 5, p < 0.05).
Figure 4.
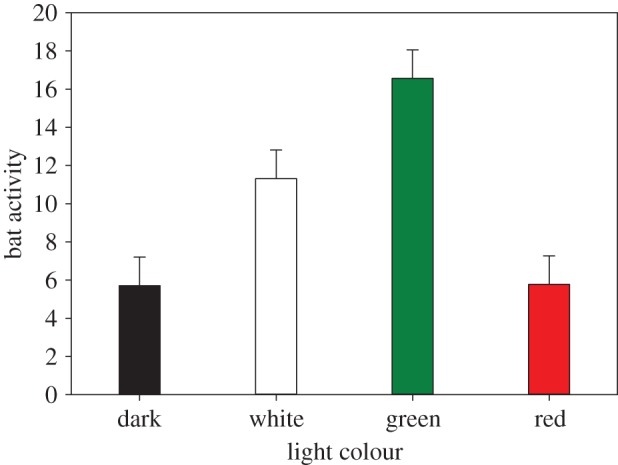
Common pipistrelle (Pipistrellus pipistrellus) activity represented by the number of call sequences per night per transect (model estimates for light treatment corrected for random variables). Error bars indicate standard error. (Online version in colour.)
(c). Birds
During the 3 years, 115 bird species were observed at and around the sites, on average 45.8 species (s.e. = 3.7) per site. Within a range of 50 m from the lampposts, the average number of species was 25 (s.e. = 2.5) per site. For all treatments, the average year-to-year observation count difference per species per transect was positive in the interval 2011–2012, i.e. on average, species were more often seen in 2012 compared with 2011 (figure 5). In contrast, in 2013, there were on average fewer observations per species per transect compared with 2012. Five common species which showed an increase relative to the dark control at the same site were Turdus merula, Aegithalos caudatus, Regulus regulus, Phylloscopus trochilus and Parus major (see the electronic supplementary material, table S3). The effect of light treatment was significant (χ2 = 11.9, d.f. = 8, p < 0.01; figure 5). The general pattern between the two intervals did not differ significantly with treatment (i.e. there was no significant interaction between treatment and year, χ2 = 4.7, d.f. = 11, p = 0.20). The average within-species difference between the interval 2011–2012 and 2012–2013 was nearly significant between dark and green (T274.5 = −2.2, p = 0.06), and significant between dark and red (T286.7 = −3.7, p < 0.005).
Figure 5.
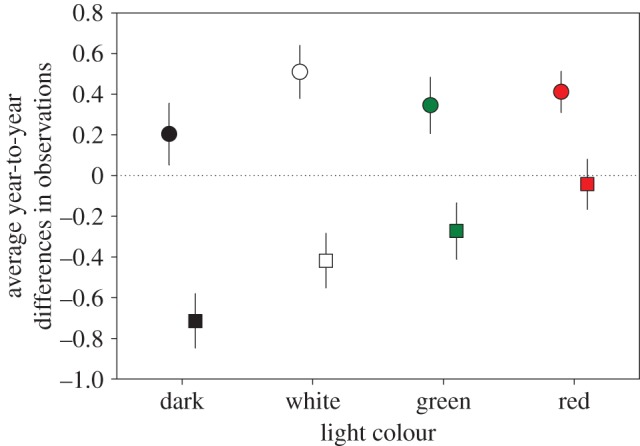
Average year-to-year differences (model estimates for light treatment corrected for random variables) in the number of birds observed per species per transect within a range of 50 m from the lampposts (or dark control dummy poles). The average difference in observations between 2011 and 2012 is indicated with circles, the difference between 2012 and 2013 is indicated with squares; error bars indicate standard error. A value above zero means that on average a species present at transects with the same treatment is observed in greater numbers in the following year, and vice versa. (Online version in colour.)
(d). Moths
In total, 354 species were observed, with on average 87 species (s.e. = 4.8) per site. In none of the models fitted, did light treatment significantly explain variance in the numbers of moths per species. When the moths are grouped in the families Erebidae, Geometridae, Noctuidae, Notodontidae and Sphingidae (figure 6) the most straightforward model—with treatment as fixed effect, and site and year as random effect—was not significant (χ2 = 1.97, d.f. = 3, p = 0.58). There were strong differences in the species composition of moths at different sites; site was a highly significant explanatory variable (χ2 = 43.23, d.f. = 4, p < 0.0001). Also, the total number of moths (irrespective of family or species) did not vary with treatment (χ2 = 0.93, d.f. = 3, p = 0.82).
Figure 6.
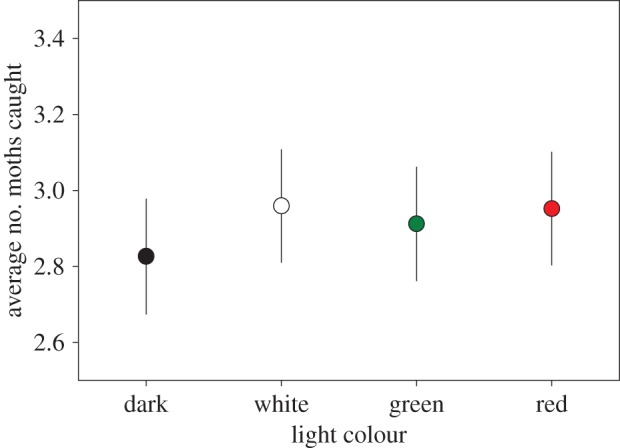
Average of the total number of moths caught per family (Erebidae, Geometridae, Noctuidae, Notodontidae and Sphingidae; model estimates for light treatment corrected for random variables) per light treatment per transect per night. Error bars indicate standard error. (Online version in colour.)
4. Discussion
To assess the effects of long-term light at night exposure on ecosystems, we have set up a replicated ecosystem-wide long-term monitoring study on the response of species to the long-term presence of light of different wavelengths, in the absence of any other anthropogenic disturbance. With the set-up of this worldwide unique study, we created the exciting possibility to study different taxa and species groups at the same location, and potentially to identify long-term population consequences and cascading effects in the ecosystem. The consequence of this generic approach is, however, that the set-up is not optimized for any of the species groups studied. Despite this fact, after 2 years we are already able to demonstrate effects of light at night and spectral composition on three species groups (mice, bats and birds), but not in the fourth group studied (moths).
(a). Mice
Wood mice show a very clear response to all light treatments. The response of rodents to moonlight has been studied extensively [44–46] and is most likely related to perceived predation risk [44,47]. It is widely known that activity of nocturnal rodents is suppressed by light [48,49], but the information on how mice react to (experimental) artificial light in the field is limited. De Molenaar et al. [50] did not find any effect of experimental light at night on mice, but Bird et al. [51] found clear effects at close range of two different spectra on foraging activity of beach mice in an experimental set-up for two different light types. Suppression of activity at night by light pulses has been shown in outdoor enclosures [52,53]. A possible attenuated response of wood mice to red light compared with white and green may be attributable to the fact that mouse eyes are less sensitive to long wavelengths [54,55], and the mice thus may experience red light as less intense and therefore evade the red-coloured light to a lesser extent than green and white. At present, it is unclear whether the reduction in activity is caused by a direct behavioural response to light, or whether there is a density effect, with a reduced abundance underneath the lampposts.
(b). Bats
The attraction of bats to light is a widely known phenomenon; however, all bat species may be avoiding light and only fly around lights to exploit accumulated insects, which are directly attracted to light. Fast flying, agile bats may be less afraid of light, while slow flying, less agile bats avoid light as they may become more vulnerable to predators [56]. Common pipistrelles are known for using street lights for foraging [12], and this is most likely what happens at the experimental sites. Close to the non-illuminated transects, hunting activity of pipistrelles is very low. Around the green and white illuminated transects, pipistrelles are much more active. The accumulation of insects around these lights may facilitate efficient foraging for species which do normally not shy away from hunting in illuminated spaces in urban habitats. However, the availability of prey species for light averse bat species is potentially reduced in this way. Further analysis of the number of prey captures may provide more insights into feeding success around the different light treatments.
(c). Birds
The light treatment has a clear effect on the year-to-year change in presence of individual species at our sites. Interestingly, the treatment effect in consecutive seasons was statistically not different between years, and the change in numbers was most positive at the illuminated transects. It is not clear what may have caused these differences. Possible explanations may, for example, be the breeding biology of species, availability of prey species, and changes in competition between species. If these trends observed during the first 2 years of the monitoring continue, this would imply that densities of birds will increase at illuminated sites. Whether the birds that breed near the lampposts do well in term of reproductive success is a different question (see reference [19]). If not, illumination may form an ecological trap when attracting birds to locations where their fitness is reduced [57].
(d). Moths
At present there are, so far, no measureable effects on moths by the experimental lights. This is unexpected, as lights—especially those with short wavelengths such as green and white—do attract moths [30,32]. The attraction may have severe fitness consequences: moths attracted into the vicinity of lights may be predated by bats hunting around the lampposts, or may not be able to deposit eggs on the local vegetation, or be affected in other life-history stages [58]. The Heath traps used attract moths only from a very close range [41,42], so we do not expect that moths attracted from further away level out differences in catches between dark control transects and transects exposed to experimental light. An explanation could be that although the experimental light affects individual moths, the effect of light at the population level is very limited and possibly only emerges after several years.
(e). Summary
In summary, we do observe direct effects on a number of species, and see emerging long-term effects. These vary with different species—the response of wood mice may be a direct behavioural response, the effects of light on pipistrelle bats are most likely mediated by the response of insects. The fact that we are unable to detect differences in moth numbers is not necessarily inconsistent with this, as we collected moths beneath the lampposts, and bats hunt in close proximity to lights. It is unclear what causes the light colour-dependent changes in the abundance of individual bird species. The future challenge, apart from more robustly establishing these effects by longer term measurements, is to identify the different causes and consequences in the changes observed (figure 1). One of the reasons for the inability to show strong effects for all species or species groups studied could be the fact that, in order to be able to study multiple species groups, we use a generic set-up, in the expectation that it will be suitable although perhaps not optimal for all species groups. However, the virtue of our approach is—in the long run—the ability to relate the effects on different species to each other and identify cascading effects. The light intensity used in this set-up may be below the threshold for both direct and indirect responses of some species. However, with the application of a higher light intensity, we would no longer be able to predict accurately the effects of lighting with commonly used light levels.
As a result of the scale of and difficulties in the run-up to the project, we were unable to collect data in the first (all dark) year on bats, mice and moths. This renders the results on these species groups correlative, and the causality of the effects identified will need to be verified by separate experiments. Additional experiments are currently being undertaken to study direct effects of light on mice, and the feeding activity of bats in relation to insect density around the lampposts, where lights are intermittently experimentally switched off.
5. Conclusion
The results presented here are the first to emerge from an ongoing assessment of ecosystem-wide changes as a result of experimental exposure to artificial light with different spectra. The first data show clear and often differential responses to light of different spectral composition. The effect of light on bat activity is a well-known effect, but in this study we have experimentally shown that lights can facilitate feeding behaviour in a habitat which is normally used less intensively by pipistrelles, a species which thrives in urban areas. We show that experimental lighting has an effect on the year-to-year change in abundance of individual bird species in close proximity to experimental lighting. The data presented for mice, bats and birds merely show quick responses to light, whereas the bird data indicate emerging long-term changes. Over a longer period of time, we expect long-term effects to become visible for all species groups.
Supplementary Material
Acknowledgements
This project hinges on data collected by NGOs and the NGO-based networks of citizen monitoring species in The Netherlands. These organizations are the Dutch Butterfly Conservation (De Vlinderstichting), the Dutch Centre for Field Ornithology (Sovon), the Dutch Mammal Society (Zoogdierverenigin), the Dutch Centre for Avian Migration and Demography (Vogeltrekstation), Reptile, Amphibian & Fish Conservation Netherlands (Ravon) and the Dutch Foundation for Botanical Research (Floron). We thank many skilled volunteers for their contribution to the collection of field data, in particular on moth species and bird demography. We thank ZIUT for the cooperation with installing experimental lighting. We are especially grateful to Dutch nature conservation organizations and terrain owners for allowing us to test the effects of experimental artificial lighting on their terrain: Staatsbosbeheer, Natuurmonumenten, the Dutch Ministry of Defence, Het Drentse Landschap, and the Municipality of Ede. We thank Dick Groenendijk, Kars Veling, Michiel Wallis de Vries, Theo Verstrael and George Wintermans for their input and discussion, and Joop Marquenie for his work in the realization of the STW project. For data collection and data processing we thank Jip Ramakers and Thomas Raap, and for the optimization of the assessment of mouse activity with camera traps we thank Rens van den Biggelaar.
Authors' contributions
This study was initiated by a grant awarded to M.E.V., E.V. and F.B. The set-up and design of the study originates from elaborate discussion between M.E.V., E.V., M.D., F.B., R.H.A.v.G. and K.S. R.H.A.v.G. and K.S. established the eight monitoring field sites. Data were processed by R.H.A.v.G., K.S., M.E.H., R.S., and analysed by K.S., M.E.V. and P.G. The paper was drafted by K.S., and all authors have commented on the manuscript.
Funding statement
This research is supported by the Dutch Technology Foundation STW, which is part of the Netherlands Organization for Scientific Research (NWO), and which is partly funded by the Ministry of Economic Affairs. The project is supported by Philips and the Dutch Oil Company (NAM).
Competing interests
M.D. is employed by Philips, the producer of the lamps used in this study and Philips provided financial support.
References
- 1.Cinzano P, Falchi PF, Elvidge CD. 2001. The first world atlas of the artificial night sky brightness. Mon. Not. R. Astron. Soc. 328, 689–707. ( 10.1046/j.1365-8711.2001.04882.x) [DOI] [Google Scholar]
- 2.Smith M. 2009. Time to turn off the lights. Nature 457, 27 ( 10.1038/457027a) [DOI] [PubMed] [Google Scholar]
- 3.Hölker F, Wolter C, Perkin EK, Tockner K. 2010. Light pollution as a biodiversity threat. Trends Ecol. Evol. 25, 681–682. ( 10.1016/j.tree.2010.09.007) [DOI] [PubMed] [Google Scholar]
- 4.Gaston KJ, Davies TW, Bennie J, Hopkins J. 2012. Reducing the ecological consequences of night-time light pollution: options and developments. J. Appl. Ecol. 49, 1256–1266. ( 10.1111/j.1365-2664.2012.02212.x) [DOI] [PMC free article] [PubMed] [Google Scholar]
- 5.Longcore T, Rich C. 2004. Ecological light pollution. Front. Ecol. Environ. 2, 191–198. ( 10.1890/1540-9295(2004)002[0191:ELP]2.0.CO;2) [DOI] [Google Scholar]
- 6.Navara KJ, Nelson RJ. 2007. The dark side of light at night: physiological, epidemiological, and ecological consequences. J. Pineal Res 43, 215–224. ( 10.1111/j.1600-079X.2007.00473.x) [DOI] [PubMed] [Google Scholar]
- 7.Frank KD. 1988. impact of outdoor lighting on moths: an assessment. J. Lepid. Soc. 42, 63–93. [Google Scholar]
- 8.Jones J, Francis CM. 2003. The effects of light characteristics on avian mortality at lighthouses. J. Avian Biol. 34, 328–333. ( 10.1111/j.0908-8857.2003.03183.x) [DOI] [Google Scholar]
- 9.Poot H, Ens B, Vries H, Donners MAH, Wernand MR, Marquenie JM. 2008. Green light for nocturnally migrating birds. Ecol. Soc. 13, 47. [Google Scholar]
- 10.Eisenbeis G, Hassel F. 2000. Zur Anziehung nachtaktiver Insekten durch Strassenlaternen. Natur und Landschaft. 75, 145–156. [Google Scholar]
- 11.Rydell J. 1992. Exploitation of insects around streetlamps by bats in Sweden. Funct. Ecol. 6, 744–750. ( 10.2307/2389972) [DOI] [Google Scholar]
- 12.Blake D, Hutson A, Racey P. 1994. Use of lamplit roads by foraging bats in southern England. J. Zool. Lond. 234, 453–462. ( 10.1111/j.1469-7998.1994.tb04859.x) [DOI] [Google Scholar]
- 13.Stone E, Jones G, Harris S. 2009. Street lighting disturbs commuting bats. Curr. Biol. 19, 1123–1127. ( 10.1016/j.cub.2009.05.058) [DOI] [PubMed] [Google Scholar]
- 14.De Molenaar JG, Sanders ME, Jonkers DA. 2006. Road lighting and grassland birds: local influence of road lighting on a black-tailed godwit population. In Ecological consequences of artificial night lighting (eds Rich C, Longcore T.), pp. 114–137. Washington, DC: Island Press. [Google Scholar]
- 15.Kempenaers B, Borgström P, Loës P. 2010. Artificial night lighting affects dawn song, extra-pair siring success, and lay date in songbirds. Curr. Biol. 20, 1735–1739. ( 10.1016/j.cub.2010.08.028) [DOI] [PubMed] [Google Scholar]
- 16.Dwyer RG, Bearhop S, Campbell HA, Bryant DM. 2013. Shedding light on light: benefits of anthropogenic illumination to a nocturnally foraging shorebird. J. Anim. Ecol. 82, 478–485. ( 10.1111/1365-2656.12012) [DOI] [PubMed] [Google Scholar]
- 17.Santos C, Miranda A, Granadeiro J. 2010. Effects of artificial illumination on the nocturnal foraging of waders. Acta Oecol. 36, 166–172. ( 10.1016/j.actao.2009.11.008) [DOI] [Google Scholar]
- 18.Dominoni D, Quetting M, Partecke J. 2013. Artificial light at night advances avian reproductive physiology. Proc. R. Soc. B 280, 20123017 ( 10.1098/rspb.2012.3017) [DOI] [PMC free article] [PubMed] [Google Scholar]
- 19.de Jong M, Ouyang JQ, Da Silva A, van Grunsven RHA, Kempenaers B, Visser ME, Spoelstra K. 2015. Effects of nocturnal illumination on life-history decisions and fitness in two wild songbird species. Phil. Trans. R. Soc. B 370, 20140128. ( 10.1098/rstb.2014.0128) [DOI] [PMC free article] [PubMed] [Google Scholar]
- 20.Dominoni DM, Quetting M, Partecke J. 2013. Long-term effects of chronic light pollution on seasonal functions of European blackbirds (Turdus merula). PLoS ONE 8, e85069 ( 10.1371/journal.pone.0085069) [DOI] [PMC free article] [PubMed] [Google Scholar]
- 21.Jones TM, Durrant J, Michaelides EB, Green MP. 2015. Melatonin: a possible link between the presence of artificial light at night and reductions in biological fitness. Phil. Trans. R. Soc. B 370, 20140122 ( 10.1098/rstb.2014.0122) [DOI] [PMC free article] [PubMed] [Google Scholar]
- 22.Gaston K, Bennie J. 2014. Demographic effects of artificial nighttime lighting on animal populations. Environ. Rev. 22, 1–8. ( 10.1139/er-2014-0041) [DOI] [Google Scholar]
- 23.Spoelstra K, Visser ME. 2013. The impact of artificial light on avian ecology. Avian Urban Ecol. 4, 21–28. [Google Scholar]
- 24.Perkin EK, Hölker F, Richardson JS, Sadler JP, Wolter C, Tockner K. 2011. The influence of artificial light on stream and riparian ecosystems: questions, challenges, and perspectives. Ecosphere 2, 1–16. ( 10.1890/ES11-00241.1) [DOI] [Google Scholar]
- 25.Gaston KJ, Bennie J, Davies TW, Hopkins J. 2013. The ecological impacts of nighttime light pollution: a mechanistic appraisal. Biol. Rev. 88, 912–927. [DOI] [PubMed] [Google Scholar]
- 26.Tan ST, Sun XW, Demir HV, DenBaars SP. 2012. Advances in the LED materials and architectures for energy-saving solid-state lighting toward ‘lighting revolution’. IEEE Photon. J. 4, 613–619. ( 10.1109/JPHOT.2012.2191276) [DOI] [Google Scholar]
- 27.Bamgartner T, Wunderlich F, Jaunich A, Sato T, Bundy G, Grießmann N, Kowalski J, Burghardt S, Hanebrink J. 2012. Lighting the way: perspectives on the global lighting market, 2nd edn. McKinsey & Co.
- 28.Wiltschko W, Wiltschko R. 1995. Migratory orientation of European robins is affected by the wavelength of light as well as by a magnetic pulse. J. Comp. Physiol. A 177, 363–369. ( 10.1007/BF00192425) [DOI] [Google Scholar]
- 29.Evans W. 2010. Response to: green light for nocturnally migrating birds. Ecol. Soc. 15, 1–2. [Google Scholar]
- 30.Langevelde F, Ettema JA, Donners M, Wallisdevries MF, Groenendijk D. 2011. Effect of spectral composition of artificial light on the attraction of moths. Biol. Conserv. 144, 2274–2281. ( 10.1016/j.biocon.2011.06.004) [DOI] [Google Scholar]
- 31.Somers-Yeates R, Hodgson D, Mcgregor PK, Spalding A, Richard H. 2013. Shedding light on moths: shorter wavelengths attract noctuids more than geometrids. Biol. Lett. 9, 20130376 ( 10.1098/rsbl.2013.0376) [DOI] [PMC free article] [PubMed] [Google Scholar]
- 32.van Grunsven RHA, Donners M, Boekee K, Tichelaar I, van Geffen KG, Groenendijk D, Berendse F, Veenendaal EM. 2014. Spectral composition of light sources and insect phototaxis, with an evaluation of existing spectral response models. J. Insect Conserv. 18, 225–231. ( 10.1007/s10841-014-9633-9) [DOI] [Google Scholar]
- 33.Witherington B. 1992. Behavioral responses of nesting sea turtles to artificial lighting. Herpetologica 48, 31–39. [Google Scholar]
- 34.Müller B, Glösmann M, Peichl L, Knop GC, Hagemann C, Ammermüller J. 2009. Bat eyes have ultraviolet-sensitive cone photoreceptors. PLoS ONE 4, e6390 ( 10.1371/journal.pone.0006390) [DOI] [PMC free article] [PubMed] [Google Scholar]
- 35.Bedrosian TA, Vaughn CA, Galan A, Daye G, Weil ZM, Nelson RJ. 2013. Nocturnal light exposure impairs affective responses in a wavelength-dependent manner. J. Neurosci. 33, 13 081–13 087. ( 10.1523/JNEUROSCI.5734-12.2013) [DOI] [PMC free article] [PubMed] [Google Scholar]
- 36.Hazenberg G, van Bochove R, van Noort M. 2011. Richtlijn voor Openbare Verlichting 2011 ROVL-2011. Nederlandse Stichting voor Verlichtingskunde (NSVV), Commissie Openbare Verlichting, The Netherlands.
- 37.International Commission on Illumination 2010. Lighting of roads for motor and pedestrian traffic. CIE 115, 2010. [Google Scholar]
- 38.Groenendijk D, Ellis WN. 2010. The state of the Dutch larger moth fauna. J. Insect Conserv. 15, 95–101. ( 10.1007/s10841-010-9326-y) [DOI] [Google Scholar]
- 39.van Dijk AJ, Boele A. Handleiding SOVON Broedvogelonderzoek. 2011. Nijmegen, The Netherlands: SOVON Vogelonderzoek Nederland. [Google Scholar]
- 40.Walters CL, et al. 2012. A continental-scale tool for acoustic identification of European bats. J. Appl. Ecol. 49, 1064–1074. ( 10.1111/j.1365-2664.2012.02182.x) [DOI] [Google Scholar]
- 41.van Grunsven RHA, Lham D, van Geffen KG, Veenendaal EM. 2014. Range of attraction of a 6-W moth light trap. Entomol. Exp. Appl. 152, 87–90. ( 10.1111/eea.12196) [DOI] [Google Scholar]
- 42.Merckx T, Slade EM. 2014. Macro-moth families differ in their attraction to light: implications for light-trap monitoring programmes. Insect Conserv. Divers. ( 10.1111/icad.12068) [DOI] [Google Scholar]
- 43.R Development Core Team 2014. R: a language and environment for statistical computing. Vienna, Austria: R Foundation for Statistical Computing. [Google Scholar]
- 44.Clarke JA. 1983. Moonlight's influence on predator/prey interactions between short-eared owls (Asio flammeus) and deermice (Peromyscus maniculatus). Behav. Ecol. Sociobiol. 13, 205–209. ( 10.1007/BF00299924) [DOI] [Google Scholar]
- 45.Brown JS, Kotler BP. 2004. Hazardous duty pay and the foraging cost of predation. Ecol. Lett. 7, 999–1014. ( 10.1111/j.1461-0248.2004.00661.x) [DOI] [Google Scholar]
- 46.Upham NS, Hafner JC. 2013. Do nocturnal rodents in the Great Basin Desert avoid moonlight? J. Mammal 94, 59–72. ( 10.1644/12-MAMM-A-076.1) [DOI] [Google Scholar]
- 47.Wilkinson EB, Branch LC, Miller DL. 2013. Functional habitat connectivity for beach mice depends on perceived predation risk. Landsc. Ecol. 28, 547–558. ( 10.1007/s10980-013-9858-0) [DOI] [Google Scholar]
- 48.Aschoff J, Daan S, Honma K-I. 1982. Zeitgebers, entrainment, and masking: some unsettled questions. In Vertebrate circadian systems (eds Aschoff J, Daan S, Groos G.), pp. 13–24. Springer: New York. [Google Scholar]
- 49.Redlin U, Mrosovsky N. 1999. Masking of locomotor activity in hamsters. J. Comp. Physiol. A 184, 429–437. ( 10.1007/s003590050342) [DOI] [PubMed] [Google Scholar]
- 50.De Molenaar JG, Braak C, van Duyne C, Hoefsloot G, Jonkers DA.2003. Wegverlichting en natuur IV. Effecten van wegverlichting op het ruimtelijk gedrag van zoogdieren. DWW rapport no. DWW-2003-012. Wageningen, The Netherlands: Alterra.
- 51.Bird BL, Branch LYNC, Miller DL. 2004. Effects of coastal lighting on foraging behavior of beach mice. Conserv. Biol. 18, 1435–1439. ( 10.1111/j.1523-1739.2004.00349.x) [DOI] [Google Scholar]
- 52.Rotics S, Dayan T, Levy O, Kronfeld-Schor N. 2011. Light masking in the field: an experiment with nocturnal and diurnal spiny mice under semi-natural field conditions. Chronobiol. Int. 24, 599–613. [DOI] [PubMed] [Google Scholar]
- 53.Rotics S, Dayan T, Kronfeld-Schor N. 2011. Effect of artificial night lighting on temporally partitioned spiny mice. J. Mammal 92, 159–168. ( 10.1644/10-MAMM-A-112.1) [DOI] [Google Scholar]
- 54.Jacobs GH, Fenwick JA, Williams GA. 2001. Cone-based vision of rats for ultraviolet and visible lights. J. Exp. Biol. 204, 2439–2446. [DOI] [PubMed] [Google Scholar]
- 55.Jacobs GH, Williams GA, Fenwick JA. 2004. Influence of cone pigment coexpression on spectral sensitivity and color vision in the mouse. Vision Res. 44, 1615–1622. ( 10.1016/j.visres.2004.01.016) [DOI] [PubMed] [Google Scholar]
- 56.Jones G, Rydell J. 1994. Foraging strategy and predation risk as factors influencing emergence time in echolocating bats. Phil. Trans. R. Soc. Lond. A 346, 445–455. ( 10.1098/rstb.1994.0161) [DOI] [Google Scholar]
- 57.Schlaepfer MA, Runge MC, Sherman PW. 2002. Ecological and evolutionary traps. Trends Ecol. Evol. 17, 474–480. ( 10.1016/S0169-5347(02)02580-6) [DOI] [Google Scholar]
- 58.van Geffen KG, van Grunsven RHA, van Ruijven J, Berendse F, Veenendaal EM. 2014. Artificial light at night causes diapause inhibition and sex-specific life history changes in a moth. Ecol. Evol. 4, 2082–2089. [DOI] [PMC free article] [PubMed] [Google Scholar]
Associated Data
This section collects any data citations, data availability statements, or supplementary materials included in this article.