

Abstract
Workers' smoking histories are not measured in many occupational cohort studies. Here we discuss the use of negative control outcomes to detect and adjust for confounding in analyses that lack information on smoking. We clarify the assumptions necessary to detect confounding by smoking and the additional assumptions necessary to indirectly adjust for such bias. We illustrate these methods using data from 2 studies of radiation and lung cancer: the Colorado Plateau cohort study (1950–2005) of underground uranium miners (in which smoking was measured) and a French cohort study (1950–2004) of nuclear industry workers (in which smoking was unmeasured). A cause-specific relative hazards model is proposed for estimation of indirectly adjusted associations. Among the miners, the proposed method suggests no confounding by smoking of the association between radon and lung cancer—a conclusion supported by adjustment for measured smoking. Among the nuclear workers, the proposed method suggests substantial confounding by smoking of the association between radiation and lung cancer. Indirect adjustment for confounding by smoking resulted in an 18% decrease in the adjusted estimated hazard ratio, yet this cannot be verified because smoking was unmeasured. Assumptions underlying this method are described, and a cause-specific proportional hazards model that allows easy implementation using standard software is presented.
Keywords: cohort studies, lung cancer, smoking
Consider the setting of a retrospective cohort study in which an investigator is interested in the association between an occupational exposure and lung cancer and has collected information on a small set of potential confounders of that association. Concern about confounding by smoking is commonplace in such studies, because cigarette smoking is an established cause of lung cancer (1). However, available information in retrospective occupational studies often is insufficient to reconstruct individual smoking histories. This poses a challenge for the interpretation of statistical estimates of the association between the occupational exposure and lung cancer, because there is an unmeasured factor that is a suspected common cause of exposure and lung cancer. Figure 1 illustrates a scenario of concern involving associations between occupational exposure E, lung cancer D, measured confounders of the association of interest (such as age, sex, and birth cohort) Z, and smoking status S. The circle around S denotes that this variable is unmeasured. In Figure 1, S is a cause of E; alternatively, S and E may be associated as a consequence of unmeasured common causes of these variables.
Figure 1.

Diagram for the effect of an exposure of interest (E) on an outcome of interest (D), with factors Z (assumed measured) and S (assumed unmeasured) that are potential common causes of E and D.
Algebraic approaches to adjusting a confounded relative risk measure by using external information on the joint distribution of the confounder and exposure, together with external information on the relative risk of disease due to the confounding factor among unexposed individuals, have been discussed since the 1950s (2, 3). Taking a similar approach, Axelson and Steenland (4) proposed an indirect method of adjusting incidence rate ratios for potential confounding by smoking in occupational cohort studies. Extensions of this method have been discussed, including Monte Carlo and Bayesian approaches to sensitivity analysis (5–7). However, in the absence of empirical data on exposure-group-specific smoking prevalence, assumptions regarding confounding scenarios are unverifiable.
In this paper, we consider an approach to this problem that draws on a negative control outcome: a response variable that is known not to be caused by the exposure. The purpose of the negative control is to reproduce a condition that cannot involve the hypothesized causal effect of the exposure of interest but is likely to involve the same sources of bias that are present in the analysis of the exposure-disease association of primary interest (8). Drawing upon previous work on negative control outcomes and extending previous work by Richardson (9) on indirect adjustment for confounding by smoking in cohort studies, we discuss some assumptions that are necessary to use negative control outcomes to detect confounding by cigarette smoking, and the additional assumptions necessary to adjust for such bias (5, 8, 9). First we describe how to detect confounding of an occupational cohort–lung cancer association by smoking using negative control outcomes. Second, we describe how to adjust for confounding by smoking of an occupational cohort–lung cancer association using negative controls. Third, we describe how, in some settings, confounding may be controlled by adjusting for a measured common cause of occupational exposure and smoking; and we suggest how the adequacy of this approach may be assessed using negative control outcomes. Each section is followed by an illustration of the approach using empirical data.
METHODS
Detecting confounding by a negative control outcome
We can use a negative control outcome to assess whether there is confounding of the exposure–lung cancer association by smoking. Figure 2 presents a causal diagram that includes a negative control outcome, N. We assume that the exposure of interest is not a cause of the negative control outcome. This is represented by the absence of an arrow between E and N in Figure 2. Furthermore, we assume that the unmeasured potential confounder(s) of the association between E and N also confound the association between E and D, but perhaps to a differing extent. In Figure 2 this is represented by S, which represents smoking, an unmeasured common cause of D and N that may be associated with E. If these 2 assumptions hold, an observed E-N association (adjusting for Z) does not reflect a causal effect of E on N but rather reflects confounding by S; in such cases, S also will confound analysis of the E-D association.
Figure 2.

Diagram for an ideal negative control outcome for detecting confounding. Exposure, E, does not cause negative control outcome N. Factors Z (assumed measured) are common causes of E, D, and/or N. S (assumed unmeasured) is a cause of D and N. There is concern that S may be a cause of E and therefore an unmeasured confounder of the E-D association.
We allow that there may be other unmeasured confounders of the E-D association that do not confound the E-N association (represented by U in Figure 3), but not unmeasured confounders of E-N. We are not focused on evaluating the complete absence of confounding of the E-D association; rather, we are focused on use of a negative control outcome to assess confounding of the E-D association by unmeasured factor S. Note that measured covariates Z allow us to adjust for other confounders of the E-N association and the E-D association. It is not important that all elements of Z confound E-N or that all elements of Z confound E-D.
Figure 3.
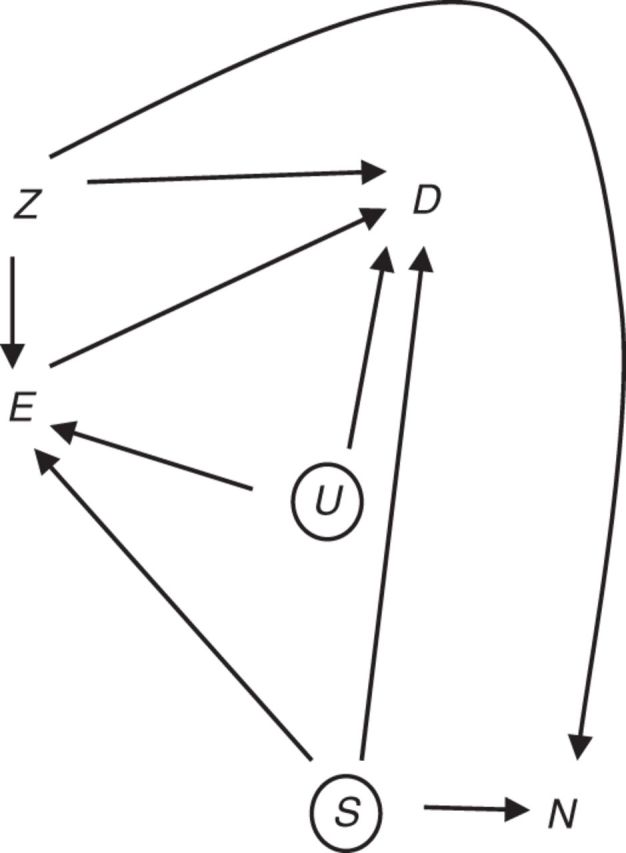
Alternative diagram for a negative control outcome for detecting confounding. Exposure, E, does not cause negative control outcome N. Factors Z (assumed measured) are common causes of E, D, and/or N. S (assumed uncontrolled) is a common cause of D and N, while U (assumed uncontrolled) represents a common cause of E and D.
An estimate of the statistical association between E and N, conditional on Z, may be obtained by fitting a regression model of the form
| (1) |
where hN0 is the estimated baseline hazard for the negative control outcome. The condition indicates absence of association between E and N, which implies absence of a confounding pathway operating through unmeasured factors S. This suggests that the E-D association also is free of confounding via the backdoor pathway E ← S → D. Rejection of a statistical test of the null hypothesis of indicates potential confounding of the E-D association by S.
Suppose that we don't have information on N in the entire study base but only have it for persons who do not experience D. This may occur, for example, in a cohort mortality study in which N and D are competing causes of death. An assessment of the association between E and N conditional on D = 0 may suffer from an induced association as a result of conditioning on D, if D is an effect of E and S (Figure 2). Therefore, while absence of association between E and N suggests absence of a confounding pathway operating through unmeasured factors S, an empirical estimate of this association could be distorted by what is termed “collider stratification bias” (10). However, the degree of bias in an estimate of the E-N association will typically be small when conditioning on the absence of a rare outcome like lung cancer (11).
Adjusting for confounding by an unmeasured factor
If there is evidence of confounding based on the assessment described above, an investigator will often want to understand the magnitude of this potential source of bias and perhaps want to adjust for it.
Suppose that for each lung cancer case, a risk set is enumerated from people who are at risk at the attained age of the case. Let hD(·) denote the lung cancer-specific hazard, let Z index risk sets defined by attained age and any other matching factors, let E denote a binary exposure of interest, and define indicator (1 = yes, 0 = no) variables as S1 = current smoker and S2 = former smoker. Assume that the lung cancer hazard conforms to a model of the form
| (2) |
where hD0(Z) is the baseline cause-specific hazard for lung cancer, the set of matching factors Z have been chosen because they are confounders of the association between E and lung cancer, and the effects of S1, S2, and E conform to a multiplicative model. The quantity exp(β1) corresponds to the desired effect measure describing the relative change in the cause-specific hazard of lung cancer with respect to E, conditional on Z, S1, and S2.
We allow that S1 and S2 may confound the association between exposure, E, and lung cancer. Let denote an estimate of the hazard ratio for the association between exposure and lung cancer in the study cohort unadjusted for smoking, obtained by fitting the reduced proportional hazards model,
| (3) |
The estimated coefficient, , may differ from β1, the parameter obtained when conditioning on S1 and S2, because of confounding by smoking. The magnitude of confounding is a function of the weighted average of the stratum-specific proportions of current and former smokers among the exposed relative to the unexposed. Let ωz denote a weight proportional to the contribution of subgroup z to the study cohort, and let π1,2,z, π1,3,z, π0,2,z, π0,3,z be the proportion of current and former smokers among the exposed and unexposed workers in covariate stratum z. The bias due to confounding by smoking is
where (8).
Assume that the negative control outcome hazard conforms to the proportional hazards model . Let be an estimate of the relative hazard for the association between E and N in the study cohort (unadjusted for smoking) as in equation 1.
The bias due to confounding by smoking is given by
where . Because we assume that there is no causal association between E and N (i.e., θ1 = 0), it follows that . Therefore, an estimate of may be obtained directly by fitting the regression model in equation 1.
The expressions for BIASβ and BIASθ are similar, except that one is a function of the smoking–negative control association (θ2 and θ3) and the other is a function of the smoking–lung cancer association (β2 and β3). Consequently, estimates of log(BIASβ) and log(BIASθ) will take similar values if and . Illustrative calculations are derived for a setting in which we take chronic obstructive pulmonary disease (COPD) as a negative control outcome. Table 1 shows BIASβ and BIASθ for various scenarios in which the prevalence of smoking among exposed workers was as high as or higher than the prevalence of smoking among unexposed workers. The difference between the true bias correction factor, log(BIASβ), and log(BIASθ) indicates the magnitude of bias in the target parameter after this adjustment for confounding by smoking. A value of 0 indicates perfect adjustment. In the scenarios considered, log(BIASβ) and log(BIASθ) take similar values. Table 1 also shows results of calculations for a setting in which we take cancers of the mouth, pharynx, larynx, and esophagus as a negative control outcome. In the scenarios considered, 90% or more of the bias due to confounding by smoking would be removed via the adjustment approach.
Table 1.
Bias Factors and the Difference Between the Natural Logarithms of These Values for Various Scenarios Concerning the Prevalence of Current Smoking (π1,2) and Former Smoking (π1,3) Among Exposed Workersa
| Negative Control Outcome and π1,2 Value | π1,3 | BIASβ | BIASθ | Log(BIASβ) − Log(BIASθ) |
|---|---|---|---|---|
| COPD | ||||
| 0.35 | 0.31 | 1 | 1 | 0 |
| 0.35 | 0.41 | 1.045 | 1.068 | −0.021 |
| 0.35 | 0.51 | 1.090 | 1.135 | −0.041 |
| 0.45 | 0.31 | 1.203 | 1.186 | 0.015 |
| 0.45 | 0.41 | 1.248 | 1.253 | −0.004 |
| 0.45 | 0.51 | 1.293 | 1.321 | −0.021 |
| 0.55 | 0.31 | 1.407 | 1.371 | 0.025 |
| 0.55 | 0.41 | 1.451 | 1.439 | 0.009 |
| 0.65 | 0.31 | 1.610 | 1.557 | 0.033 |
| Cancers of the mouth, pharynx, larynx, and esophagus | ||||
| 0.35 | 0.31 | 1 | 1 | 0 |
| 0.35 | 0.41 | 1.045 | 1.053 | −0.008 |
| 0.35 | 0.51 | 1.090 | 1.106 | −0.015 |
| 0.45 | 0.31 | 1.203 | 1.159 | 0.037 |
| 0.45 | 0.41 | 1.248 | 1.212 | 0.029 |
| 0.45 | 0.51 | 1.293 | 1.265 | 0.022 |
| 0.55 | 0.31 | 1.407 | 1.318 | 0.065 |
| 0.55 | 0.41 | 1.451 | 1.371 | 0.057 |
| 0.65 | 0.31 | 1.610 | 1.477 | 0.086 |
Abbreviation: COPD, chronic obstructive pulmonary disease.
a In all scenarios, the percentages of current and former smokers among the unexposed were 35% and 31% (i.e., π0,2 = 0.35 and π0,3 = 0.31), respectively. In all calculations, we assumed that the relative rates of lung cancer among current and former smokers were 14.6 and 4.0, respectively. For COPD, we assumed that the relative rates of COPD among current and former smokers were 14.2 and 5.8, respectively. For cancer, we assumed that the relative rates of cancers of the mouth, pharynx, larynx, and esophagus among current and former smokers were 6.7 and 2.9, respectively.
Substituting into the expression for correction of the target parameter in place of log(BIASβ) results in an indirect approach to estimating the adjusted association between exposure and lung cancer that may reduce bias due to uncontrolled confounding by smoking, (8). If E is a continuous variable, modeled for example as a linear function, then the same expression holds as long as variation in average smoking prevalence across levels of E can be appropriately modeled as a linear function of E and Z (9).
Joint estimation of the regression models shown in equations 1 and 3 provides a framework for obtaining the necessary regression parameter estimates and their covariance, and thereby deriving the appropriate standard error for an adjusted estimate obtained by taking their difference. The Appendix provides SAS code with which to estimate under a cause-specific proportional hazards model allowing for time-varying explanatory variables (12, 13). The approach uses the PHREG procedure of the SAS statistical package (version 9.2) (SAS Institute, Inc., Cary, North Carolina) (14).
The proposed approach indirectly adjusts for confounding of the hazard ratio due to unmeasured S, as in Figure 3. However, in the absence of confounding by S, a regression model estimate of β1 may still differ from ; the reason is noncollapsibility of the hazard ratio across strata of a risk factor for lung cancer (15, 16). The indirect adjustment procedure aims to address bias due to confounding but does not address changes in proportional hazards parameter estimates due to noncollapsibility. In settings with rare outcomes, differences in estimates due to noncollapsibility will be small.
Blocking the association between smoking and occupational exposure
Suppose we posit that the only reason smoking is associated with exposure, E, is because they share a common cause J, such as job category or socioeconomic status (Figure 4). If J is measured, then we could fit a regression model that would block this confounding path. It is reasonable to consider whether occupational exposure is associated with the negative control outcome conditional on adjustment for J.
Figure 4.
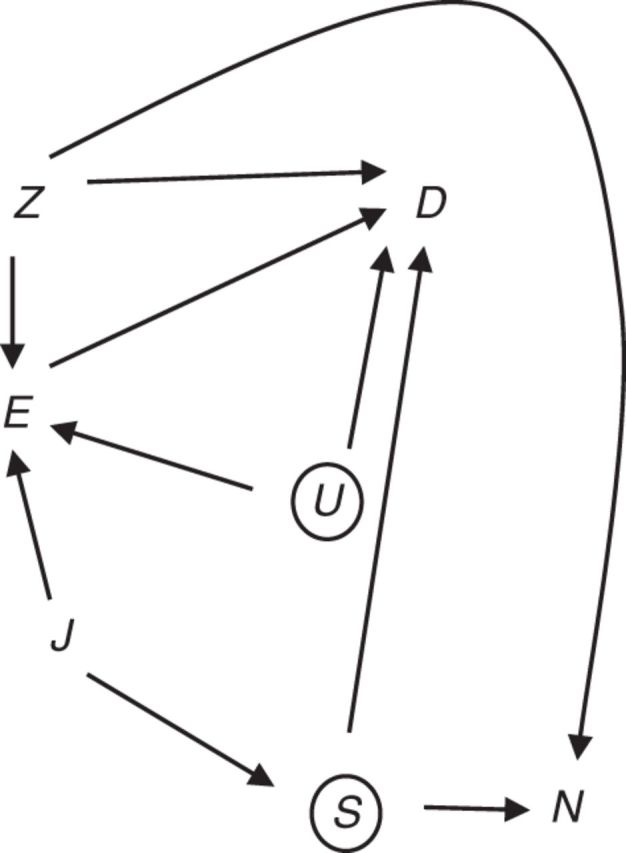
Alternative diagram for a negative control outcome for detecting confounding. Exposure, E, does not cause negative control outcome N. Factors Z (assumed measured) are common causes of E, D, and/or N. S (assumed unmeasured) is a cause of D and N, while U (assumed unmeasured) represents a common cause of E and D. The association between E and smoking (S, unmeasured) is due to a common cause, J.
The proposed use of a negative control outcome offers an approach to evaluating whether confounding of the association of interest by smoking may be handled by adjustment for measured common causes of smoking and exposure, J. The adequacy of this approach can be assessed using a negative control outcome by subsequently applying the model shown in equation 1 to detect confounding or by jointly estimating the regression models shown in equations 1 and 3 to obtain an indirectly adjusted estimate.
To illustrate the approach of assessing uncontrolled confounding of an occupational exposure–lung cancer association by smoking, we used data on a cohort of 3,379 white male underground uranium miners employed on the Colorado Plateau between January 1, 1950, and December 31, 1960, with follow-up through December 31, 2005 (17). We used death due to COPD, defined on the basis of underlying cause of death, as a negative control outcome. Cumulative radon progeny exposure, a time-varying factor expressed in working-level months (WLM) and lagged 10 years, was computed for each worker as the product of the length of employment at each job in a year and the estimated rate of radon exposure for that job. Smoking status was determined from a 1985 worker survey and was treated here as a fixed variable at baseline. To assess evidence of confounding using the proposed approach, we fitted Cox proportional hazards regression models for the association between cumulative WLM and COPD with age as the time scale, matching on 5-year categories of year of birth. Given the availability of information on individual smoking history, we evaluated our conclusion regarding confounding by smoking by comparing estimates of radon–lung cancer associations obtained with and without direct adjustment for a 4-level indicator of final smoking status (never smoker, former smoker, current smoker of <1 pack/day, current smoker of ≥1 pack/day).
To further illustrate the methods described in this paper for assessing and indirectly adjusting for confounding by smoking, we used data from a cohort of 51,348 white male workers employed in the French nuclear industry between January 1, 1950, and December 31, 1994 (18) with follow-up through December 31, 2004. Lung cancer mortality and death due to COPD were defined on the basis of underlying cause of death. Cumulative external radiation dose, a time-varying variable expressed in millisieverts (mSv) and lagged 10 years, was based on personal dosimetry information. To assess evidence of confounding, we fitted Cox proportional hazards regression models for the association between cumulative radiation dose and COPD with age as the time scale and risk sets matched on 5-year categories of year of birth. To illustrate the indirect adjustment approach, we fitted a standard Cox model for the radiation–lung cancer association, and we fitted a cause-specific Cox model for associations between cumulative radiation dose and lung cancer and COPD. Finally, we assessed whether, via adjustment for a 5-level indicator of socioeconomic status, we could block the association between occupational exposure and cigarette smoking.
To assess evidence of residual confounding by smoking after adjustment for socioeconomic status, we fitted a proportional hazards regression model for the association between cumulative radiation dose and COPD, with adjustment for age, category of year of birth, and socioeconomic status (based on job title at the time of hire). We fitted a Cox model for the association between cumulative radiation dose and lung cancer with adjustment for socioeconomic status, and we fitted a cause-specific Cox model for associations between cumulative radiation dose and lung cancer and COPD with adjustment for socioeconomic status.
RESULTS
Using the Colorado Plateau data (17), we assessed evidence of confounding by cigarette smoking. The cohort included 616 deaths due to lung cancer and 183 deaths due to COPD. Analysis of the association between cumulative WLM and COPD yielded an estimate of (standard error, 0.0061; relative rate (RR) = 1.00, 95% confidence interval (CI): 0.99, 1.01), suggesting little or no confounding of the cumulative WLM–lung cancer association by smoking, as evidenced by the negative control outcome. Because smoking history was measured in the study cohort, we could evaluate this conclusion by comparing the estimate of the association between cumulative WLM and lung cancer unadjusted for smoking (at 100 WLM, RR = 1.018, 95% CI: 1.015, 1.021) with the estimate adjusted for smoking status (at 100 WLM, RR = 1.018, 95% CI: 1.014, 1.021). The similarity of the results obtained with and without direct adjustment for smoking is consistent with the conclusion derived from the negative control analysis that smoking was not a confounder of the association between radon and lung cancer in this cohort.
Using the French nuclear worker study (18), we assessed and indirectly adjusted for confounding by smoking. The cohort included 585 deaths due to lung cancer and 69 deaths due to COPD. Analysis of the association between cumulative radiation dose and COPD yielded an estimate of (standard error, 0.255; RR = 1.19, 95% CI: 0.73, 1.97), suggesting confounding, as evidenced by the negative control outcome. Next we fitted a model for the association between radiation and lung cancer (unadjusted for smoking): The relative rate for a 100-mSv increment in exposure (RR(100 mSv)) was 1.214 (95% CI: 1.018, 1.448). A joint model for the association between radiation and lung cancer and COPD was fitted, yielding an indirectly adjusted estimate of association between cumulative radiation dose and lung cancer of RR(100 mSv) = 1.017 (95% CI: 0.599, 1.728), which is substantially smaller than the estimate obtained from the Cox model with no adjustment for confounding by unmeasured smoking. The large change in the estimate reflects either the failure of an assumption or evidence of a positive bias due to confounding of the radiation–lung cancer association by unmeasured cigarette smoking.
Finally, we assessed whether, via adjustment for socioeconomic status, we could minimize potential confounding of the association of interest by cigarette smoking. After adjustment for a 5-level indicator of socioeconomic status, analysis of the association between cumulative radiation dose and COPD yielded (standard error, 0.2813; RR = 1.00, 95% CI: 0.57, 1.73), suggesting little or no confounding. We fitted a model for the association between radiation and lung cancer adjusted for socioeconomic status and obtained an RR(100 mSv) of 1.066 (95% CI: 0.882, 1.288). A joint model for the association between radiation and lung cancer and COPD yielded an indirectly adjusted estimate of association between cumulative radiation dose and lung cancer, adjusted for socioeconomic status, of RR(100 mSv) = 1.071 (95% CI: 0.599, 1.918). There was little evidence of confounding by smoking status after adjusting for age, birth cohort, and socioeconomic status.
DISCUSSION
We have described a method for assessing confounding by smoking using negative control outcomes. Standard sensitivity analysis methods for confounding by smoking require investigators to posit unverifiable assumptions about smoking prevalence conditional on strata of sociodemographic factors and exposure (6). Use of negative control outcomes to detect confounding by smoking also requires deploying some unverifiable assumptions. The first of these is that the exposure of interest does not cause the negative control outcome. This is a strong assumption, and great care should be taken if there is uncertainty about it. The validity of this assumption depends upon the investigator's appropriate choice of a negative control outcome. Suppose an investigator is uncertain that the E-N association is precisely null. Perhaps, in our example using the Colorado Plateau data, the investigator is concerned that radon causes COPD. Such an association has been suggested in a study of domestic radon but not shown in studies of associations between radon and nonmalignant respiratory disease among uranium miners (after excluding deaths due to silicosis and pneumoconiosis) (17, 19, 20). The expression for bias adjustment given a non-null association between E and A becomes , where the last term reflects the effect of exposure on the negative control outcome.
A second assumption is that any unmeasured common cause of exposure and the negative control outcome also causes lung cancer. Ideally, smoking is the only uncontrolled confounder of the association between exposure and the negative control outcome. However, if there are other, unmeasured confounders of the exposure–negative control outcome association (and these factors also cause lung cancer), then the proposed approach to bias detection remains useful. Suppose, in our example using the Colorado Plateau data, that an investigator is concerned that smoking and silica dust are both unmeasured confounders of the radon–lung cancer association. If smoking and silica dust both cause lung cancer and COPD, then the validity of our conclusion that smoking is unlikely to confound the estimated association between radon and lung cancer holds. Absence of an association between radon and COPD signals that confounding is not likely to operate through paths tested by negative control outcome. The latter conclusion is useful, given the absence of individual estimates of silica dust exposure for members of our illustrative cohorts.
To indirectly adjust for confounding (but not to test for its presence), we must assume that the associations between the unmeasured confounder S and lung cancer (D) and the negative control outcome (N) are similar in magnitude. While the association between cigarette smoking and lung cancer is quite large in magnitude, outcomes including COPD, emphysema, and cancers of the mouth, pharynx, larynx, and esophagus also exhibit large magnitudes of association with cigarette smoking (21, 22). As Table 1 illustrates, this is an important assumption, but it can be relaxed somewhat without substantial loss of utility of the proposed method.
The indirect adjustment strategy proposed herein is well justified when background knowledge is available about the nature of the unobserved confounder, mainly smoking behavior, and previously published estimates of its association with the primary outcome and the negative control outcome, respectively. Often such background information about unmeasured confounders may not be available, in which case the proposed strategy might not be as compelling. Interestingly, in the context of Cox regression analysis, indirect adjustment of the exposure log hazard ratio for the primary outcome—obtained simply by subtracting the estimated log hazard ratio for the negative control outcome—is sometimes formally justified, provided that the unobserved confounder U is continuous and provided that the relationship between U and N and the relationship between U and the potential outcome (for D) when unexposed are monotonic at the individual level. This result suggests that under this monotonicity assumption, the simple adjustment technique used here may in fact continue to be sound even if the association between U and N is quite distinct from that between U and D, and that background information about the confounder may not be needed to justify the approach under such assumptions. For settings in which little background information about the unobserved confounder is available, the recently proposed control outcome calibration approach may be adopted in the context of linear or logistic regression with a valid negative control outcome; however, to date, the control outcome calibration approach has not been extended to a Cox regression framework for using the French nuclear worker study data censored survival outcomes (23).
As our example illustrates, there is often good reason to believe that by conditioning on determinants of cigarette smoking, such as sex, age, birth cohort, and social class, the potential for substantial confounding by smoking is reduced (24). While in a crude analysis smoking may be differentially distributed between exposure categories, within strata of these factors large systematic differences in smoking prevalence between occupational exposure groups are less likely (Figure 4). In our example, we observed that when we adjusted for socioeconomic status, the resultant estimate of the radon–lung cancer association was similar in magnitude to the estimate of this association obtained with indirect adjustment for confounding by smoking. Consequently, our example supports prior advice that it is generally reasonable to believe that by conditioning on factors such as sex, age, birth cohort, and social class, there is often low potential for substantial confounding of occupational exposure–disease associations by smoking status (25).
Estimation of adjusted effects (and associated confidence intervals) is facilitated by the proposed cause-specific proportional hazards models, which can be fitted using standard statistical software. The variance for the indirectly adjusted estimate obtained from our proposed joint model will tend to be larger than that for the covariate-adjusted Cox model. One might assess evidence of uncontrolled confounding by smoking (i.e., assessing the exposure–negative control outcome association) first to determine whether confounding is likely to be operating through paths assessed with the negative outcome control. This is appealing, because evidence of a null association may lead to the conclusion that no indirect adjustment is necessary. Of course, if using such a 2-stage procedure, one should account for the uncertainty due to the first-stage test.
In conclusion, occupational epidemiologists often draw upon cohort studies to inform their understanding of occupational causes of lung cancer. Information on smoking history is rarely available in occupational cohort studies; consequently, it is usually not possible to directly address concerns about confounding by smoking through techniques such as restriction, stratification, matching, or statistical adjustment. In these situations, the use of negative control outcomes to detect confounding by smoking may help in the interpretation of effect estimates. The proposed approach can be used in conjunction with other approaches to assess confounding by smoking (6, 26) and may offer a valuable complement to those approaches.
ACKNOWLEDGMENTS
Author affiliations: Department of Epidemiology, School of Public Health, University of North Carolina at Chapel Hill, Chapel Hill, North Carolina (David B. Richardson, Stephen R. Cole); Laboratory of Epidemiology, Institute for Radiation Protection and Nuclear Safety, Fontenay-aux-Roses, France (David B. Richardson, Dominique Laurier); Division of Surveillance, Hazard Evaluations, and Field Studies, National Institute for Occupational Safety and Health, Cincinnati, Ohio (Mary K. Schubauer-Berigan); and Department of Biostatistics, Harvard University, Boston, Massachusetts (Eric Tchetgen Tchetgen).
The French study of nuclear workers has been completed, with partial support from AREVA Nuclear Cycle and Electricité de France, within the European Commission Fifth Framework Programme.
The findings and conclusions in this report are those of the authors and do not necessarily represent the views of the National Institute for Occupational Safety and Health.
Conflict of interest: none declared.
APPENDIX
Consider a cohort study with the following key variables: each person's age at entry into the study (age_entry), age at exit from the study (age_exit), exposure information (E), other covariates (Z), and binary indicators of lung cancer (ulung) and a negative control outcome (ucopd). To fit the cause-specific hazards model, we create a new outcome variable (eventtype) with 3 levels (0 = event of interest did not occur, 1 = lung cancer occurred, 2 = negative control outcome occurred). Next, we create a data set with 2 records for each person and 2 new variables in that expanded data set: a variable for observation type (f_type) which takes a value of 0 for the first record for a person and a value of 1 for the second record for that person; and a binary indicator of any event (which takes a value of 1 if eventtype=1 and f_type=0, a value of 0 if eventtype ^=1 and f_type=0, a value of 1 if eventtype=2 and f_type=1, and a value of 0 if eventtype^=2 and f_type=1). A cause-specific hazards model may be fitted using standard software from Cox regression, simultaneously estimating the associations between exposure and lung cancer and the negative control outcome. In the example code below, we use the PHREG procedure of the SAS statistical package (version 9.2) (14); standard errors and confidence intervals for the differences in the estimated associations between exposure and lung cancer and exposure and the negative control outcome are directly obtained using a “contrast” statement.
data source2; set final;
t= age_exit; eventtype=0; if ulung=1 then eventtype=1; if ucopd=1 then eventtype=2; run;
data augment; set source2 source2; run;
proc sort data=augment; by id ; run;
data augment1; set augment; by id;
if first.id then do; ftype=0; if eventtype=1 then status=1; if eventtype^=1 then status=0; end;
if first.id^=1 then do; ftype=1; if eventtype=2 then status=1; if eventtype^=2 then status=0; end;
proc phreg data=augment1 nosummary;
model age_exit*status(0) = cumdose_L cumdose_C / ties=efron entry=age_entry rl;
strata ftype cohort ; array ds{55} d1-d55;
year_rs=year(age_exit + birthdate) -1949;
cumdose= ds{ Year_RS }; cumdose_C= cumdose*ftype; cumdose_L= cumdose*(1-ftype);
contrast ‘diff’ cumdose_L 1 cumdose_C -1 / estimate = both; run;
REFERENCES
- 1.Schottenfeld D, Fraumeni JF. Cancer Epidemiology and Prevention. New York, NY: Oxford University Press; 2006. [Google Scholar]
- 2.Cornfield J, Haenszel W, Hammond EC, et al. Smoking and lung cancer: recent evidence and a discussion of some questions. J Natl Cancer Inst. 1959;221:173–203. [PubMed] [Google Scholar]
- 3.Miettinen OS. Components of the crude risk ratio. Am J Epidemiol. 1972;962:168–172. [DOI] [PubMed] [Google Scholar]
- 4.Axelson O, Steenland K. Indirect methods of assessing the effects of tobacco use in occupational studies. Am J Ind Med. 1988;131:105–118. [DOI] [PubMed] [Google Scholar]
- 5.Gail MH, Wacholder S, Lubin JH. Indirect corrections for confounding under multiplicative and additive risk models. Am J Ind Med. 1988;131:119–130. [DOI] [PubMed] [Google Scholar]
- 6.Steenland K, Greenland S. Monte Carlo sensitivity analysis and Bayesian analysis of smoking as an unmeasured confounder in a study of silica and lung cancer. Am J Epidemiol. 2004;1604:384–392. [DOI] [PubMed] [Google Scholar]
- 7.Kriebel D, Zeka A, Eisen EA, et al. Quantitative evaluation of the effects of uncontrolled confounding by alcohol and tobacco in occupational cancer studies. Int J Epidemiol. 2004;335:1040–1045. [DOI] [PubMed] [Google Scholar]
- 8.Lipsitch M, Tchetgen Tchetgen E, Cohen T. Negative controls: a tool for detecting confounding and bias in observational studies. Epidemiology. 2010;213:383–388. [DOI] [PMC free article] [PubMed] [Google Scholar]
- 9.Richardson DB. Occupational exposures and lung cancer: adjustment for unmeasured confounding by smoking. Epidemiology. 2010;212:181–186. [DOI] [PubMed] [Google Scholar]
- 10.Cole SR, Platt RW, Schisterman EF, et al. Illustrating bias due to conditioning on a collider. Int J Epidemiol. 2010;392:417–420. [DOI] [PMC free article] [PubMed] [Google Scholar]
- 11.Greenland S. Quantifying biases in causal models: classical confounding vs collider-stratification bias. Epidemiology. 2003;143:300–306. [PubMed] [Google Scholar]
- 12.Lunn M, McNeil N. Applying Cox regression to competing risks. Biometrics. 1995;512:524–532. [PubMed] [Google Scholar]
- 13.Lau B, Cole SR, Gange SJ. Competing risk regression models for epidemiologic data. Am J Epidemiol. 2009;1702:244–256. [DOI] [PMC free article] [PubMed] [Google Scholar]
- 14.SAS Institute Inc. SAS OnlineDoc® 9.2. Cary, NC: SAS Institute Inc.; 2007. http://support.sas.com/documentation/92/ Accessed March 18, 2014. [Google Scholar]
- 15.Greenland S. Absence of confounding does not correspond to collapsibility of the rate ratio or rate difference. Epidemiology. 1996;75:498–501. [PubMed] [Google Scholar]
- 16.Hernán MA. The hazards of hazard ratios. Epidemiology. 2010;211:13–15. [DOI] [PMC free article] [PubMed] [Google Scholar]
- 17.Schubauer-Berigan MK, Daniels RD, Pinkerton LE. Radon exposure and mortality among white and American Indian uranium miners: an update of the Colorado Plateau cohort. Am J Epidemiol. 2009;1696:718–730. [DOI] [PubMed] [Google Scholar]
- 18.Metz-Flamant C, Laurent O, Samson E, et al. Mortality associated with chronic external radiation exposure in the French combined cohort of nuclear workers. Occup Environ Med. 2013;709:630–638. [DOI] [PubMed] [Google Scholar]
- 19.Turner MC, Krewski D, Chen Y, et al. Radon and COPD mortality in the American Cancer Society Cohort. Eur Respir J. 2012;39:1113–1119. [DOI] [PMC free article] [PubMed] [Google Scholar]
- 20.Kreuzer M, Sogl M, Brüske I, et al. Silica dust, radon and death from non-malignant respiratory diseases in German uranium miners. Occup Environ Med. 2013;7012:869–875. [DOI] [PubMed] [Google Scholar]
- 21.Jacob S, Boveda S, Bar O, et al. Interventional cardiologists and risk of radiation-induced cataract: results of a French multicenter observational study. Int J Cardiol. 2013;1675:1843–1847. [DOI] [PubMed] [Google Scholar]
- 22.Doll R, Peto R, Boreham J, et al. Mortality in relation to smoking: 50 years' observations on male British doctors. BMJ. 2004;3287455:1519. [DOI] [PMC free article] [PubMed] [Google Scholar]
- 23.Tchetgen Tchetgen E. The control outcome calibration approach for causal inference with unobserved confounding. Am J Epidemiol. 2014;1795:633–640. [DOI] [PMC free article] [PubMed] [Google Scholar]
- 24.Axelson O. Confounding from smoking in occupational epidemiology. Br J Ind Med. 1989;468:505–507. [DOI] [PMC free article] [PubMed] [Google Scholar]
- 25.Blair A, Steenland K, Shy C, et al. Control of smoking in occupational epidemiologic studies: methods and needs. Am J Ind Med. 1988;131:3–4. [DOI] [PubMed] [Google Scholar]
- 26.Steenland K, Beaumont J, Halperin W. Methods of control for smoking in occupational cohort mortality studies. Scand J Work Environ Health. 1984;103:143–149. [DOI] [PubMed] [Google Scholar]