

Background: Multiple substrates generate acetyl-CoA used in heart citric acid cycle.
Results: We observed unexpected metabolite labeling in hearts perfused with labeled substrates.
Conclusion: A double substrate cycle operates between triose-phosphates, glucose 6-phosphate, and glycogen; a metabolic tunnel operates between pyruvate dehydrogenase and carnitine acetyltransferase.
Significance: This metabolomic + mass isotopomer strategy can be used to better characterize heart metabolism in disease models.
Keywords: Acetoacetate, Acetyltransferase, Cell Compartmentalization, Glycolysis, Metabolomics, Acetyl Coenzyme A (Acetyl-CoA), Acetylcarnitine, Citric Acid Cycle, Metabolic Channeling, Substrate Cycling
Abstract
We developed an isotopic technique to assess mitochondrial acetyl-CoA turnover (≈citric acid flux) in perfused rat hearts. Hearts are perfused with buffer containing tracer [13C2,2H3]acetate, which forms M5 + M4 + M3 acetyl-CoA. The buffer may also contain one or two labeled substrates, which generate M2 acetyl-CoA (e.g. [13C6]glucose or [1,2-13C2]palmitate) or/and M1 acetyl-CoA (e.g. [1-13C]octanoate). The total acetyl-CoA turnover and the contributions of fuels to acetyl-CoA are calculated from the uptake of the acetate tracer and the mass isotopomer distribution of acetyl-CoA. The method was applied to measurements of acetyl-CoA turnover under different conditions (glucose ± palmitate ± insulin ± dichloroacetate). The data revealed (i) substrate cycling between glycogen and glucose-6-P and between glucose-6-P and triose phosphates, (ii) the release of small excess acetyl groups as acetylcarnitine and ketone bodies, and (iii) the channeling of mitochondrial acetyl-CoA from pyruvate dehydrogenase to carnitine acetyltransferase. Because of this channeling, the labeling of acetylcarnitine and ketone bodies released by the heart are not proxies of the labeling of mitochondrial acetyl-CoA.
Introduction
The goal of the present project was to develop and exploit a multitracer technique to measure in the same perfused rat hearts; (i) the total turnover of mitochondrial acetyl-CoA, i.e. citric acid cycle (CAC)2 flux and (ii) the absolute contribution(s) of one or two sources of acetyl-CoA to total acetyl-CoA turnover. The relative contributions of glucose and a fatty acid to the CAC can be measured by using a pair of labeled substrates that generate single-labeled (M1)3 and double-labeled (M2) acetyl-CoA. Such substrate pairs could be [13C6]glucose + [1-13C]palmitate or [1-13C]glucose + [1,2-13C2]palmitate. The M1 and M2 enrichments of mitochondrial acetyl-CoA can be measured either (i) by cleaving citrate with ATP-citrate lyase + CoA and measuring the mass isotopomer distributions (MID) of acetyl-CoA thus generated by LC-MS/MS (1) or (ii) by measuring the labeling of C-4 and C-5 of glutamate by NMR (2). To convert these relative contributions of glucose and fatty acid to acetyl-CoA to absolute fluxes of acetyl-CoA from these substrates would require the simultaneous tracing of total CAC flux with a tracer that does not perturb the productions of acetyl-CoA from glucose and fatty acids. Total CAC flux has been estimated by perfusing hearts with a high concentration of [13C2]acetate (2–11 mm) and modeling the labeling patterns of CAC intermediates measured by NMR (2, 3). Because the heart has a high activity of acetyl-CoA synthetase (4, 5), such protocols affect the generation of acetyl-CoA from other substrates than [13C2]acetate.
In experiments with, for example [13C6]glucose + [1-13C]palmitate, one would need a method to generate a known amount of acetyl-CoA heavier than M2, and this only in mitochondria. We hypothesized that this can be achieved by (i) infusing a low concentration of [13C2,2H3]acetate (M5) in the inflowing perfusate (Scheme 1), (ii) measuring the uptake of the tracer, (iii) measuring the labeling of tissue acetyl-CoA, and (iv) dividing the uptake of [13C2,2H3]acetate by the m5 enrichment of heart acetyl-CoA. Because rat heart acetyl-CoA synthetase is present only in mitochondria (6, 7), the uptake of [13C2,2H3]acetate should be equal to the amount of M5 acetyl-CoA formed in mitochondria. We also hypothesized that in perfusions with [13C6]glucose, the measurement of the MID of glucose-6-P and lactate would allow calculating the contributions of glycogen to glycolysis and to the CAC. Lastly, we wanted to test the hypotheses that the concentrations and labeling patterns of acetylcarnitine and/or ketone bodies released by the heart could be used as (i) nondestructive proxies of the labeling pattern of mitochondrial acetyl-CoA and (ii) an index of the production of acetyl-CoA in excess of the rate of citrate synthesis. We conducted this study on non-working Langendorff-perfused hearts, in anticipation to extending it to the working heart preparation.
SCHEME 1.

Main sources and fates of acetyl-CoA in rat heart. The M5 acetate tracer is [13C2,2H3]acetate. Note that in heart the activation of acetate is only mitochondrial. BHB, (R)-β-hydroxybutyrate; CPT, carnitine-palmitoyl transferase system; TPS, triose phosphates.
EXPERIMENTAL PROCEDURES
Materials
General chemicals, aniline, sodium [13C2,2H3]acetate, sodium [13C2]acetate, [13C6]glucose, [1,2-13C2]palmitic acid, sodium [2H3]propionate, [2H9]pentanoic acid, and [2H9]carnitine were purchased from Sigma (Isotec). 1-(3-Dimethylaminopropyl)-3-ethylcarbodiimide hydrochloride was bought from Acros Organics. A reference standard for the MID of [13C2,2H3]acetyl-CoA was synthesized by reacting [13C2,2H3]acetate with ATP + CoA + Mg2+ + acetyl-CoA synthetase from yeast. ATP-citrate lyase was prepared from the livers of rats that had been starved for 2 days then (re)fed for 3 days with a high glucose diet. The enzyme, isolated from the Bio-Gel column (8), was precipitated with 50% ammonium sulfate, and aliquots of the suspension (2 units/0.1 ml) were kept frozen at −80 °C. Before use, the enzyme was dissolved in 1 ml of 250 mm Tris-HCl (pH 8.7) containing 5 mm dithiothreitol.
Isolated Rat Heart Perfusions
The Institutional Animal Care and Use Committee of Case Western Reserve University approved all animal experiments. Hearts from ad libitum-fed male Sprague-Dawley rats (300–350 g) were perfused in the Langendorff mode at 37 °C with non-recirculating bicarbonate buffer (119 mm NaCl, 4.8 mm KCl, 1.3 mm CaCl2, 1.2 mm KH2PO4, 1.2 mm MgSO4, 25 mm NaHCO3, 0.05 mm l-carnitine) containing 11 mm glucose and equilibrated with 95% O2 + 5% CO2. The perfusate was pumped at a constant flow (12 ml/min) through a 0.22-μm Millipore filter and a water-jacketed heating coil (Radnoti LLC, Monrovia, CA) equipped with a bubble trap before entering the aortic cannula. The hearts beat spontaneously throughout the perfusion.
After a 15-min equilibration, the perfusions were switched for 30 min to bicarbonate buffer containing 3% dialyzed bovine serum albumin (fraction V, fatty acid-free; InterGen) and the concentrations of substrates and tracers in the 8 groups of perfusions listed in (Fig. 2). Each group of perfusions included 5 hearts. At the end of the experiments the hearts were quick-frozen and stored at −80 °C until analysis. Another group of hearts was perfused for 30 s to clear the blood and quick-frozen to measure baseline glycogen concentrations.
FIGURE 2.

Rates of acetyl-CoA turnover in rat hearts perfused with different mixes of unlabeled and labeled substrates (indicated at the bottom of the bars. G1, G2 … G8 represent perfusion groups 1, 2 … 8 with various substrates indicated on the x-axis legend, where the concentrations of substrates in each group were 11 mm glucose, 40 μm acetate, 100 microunits of insulin, 0.4 mm palmitate, 0.1 mm octanoate, and 2 mm dichloroacetate (DCA), respectively. Each full bar indicates the total rate of acetyl-CoA turnover. Colored sections indicate the contributions of exogenous and endogenous fuels to acetyl-CoA turnover. The bottom beige sections refer to untraced endogenous, unlabeled substrates. Note that G1–3 were perfused with the same substrates but differently labeled. G6–7 were perfused with another set of the same substrates but differently labeled. Data are presented as mean ± S.D. (n = 5 in all groups). dw, dry weight.
Analytical Procedures
Some samples of perfusate were treated with NaBH4 to reduce unstable pyruvate and acetoacetate to stable (RS)-lactate and (RS)-β-hydroxybutyrate (9). The concentrations and MID of perfusate acetate, lactate, and β-hydroxybutyrate were assayed by ammonia negative chemical ionization GC-MS of the pentafluorobenzyl derivatives (10–12), with internal standards of [2H3]propionate, 3-hydroxypropionate, and [2H9]pentanoate. The MID of glucose in perfusate and in glycogen-glucose was assayed as the pentaacetyl derivative (13). Heart glycogen was precipitated from heart perchloric acid extracts with ethanol, rinsed twice with ethanol, and spiked with an internal standard of sorbitol before acid hydrolysis and derivatization with acetic anhydride (13). The MID of acetyl-CoA, acetylcarnitine, and glucose-6-P (as aniline derivative prepared with 1-(3-dimethylaminopropyl)-3-ethylcarbodiimide-HCl) were assayed by LC-MS/MS (14, 15). The M1 or/and M2 labeling of the acetyl moiety of heart citrate, a probe of mitochondrial acetyl-CoA, was assayed by cleaving citrate with ATP-citrate lyase isolated from rat liver (8) and analyzing acetyl-CoA by LC-MS/MS (1).
Calculations
All metabolic calculations are based on concentrations and/or labeling patterns of metabolites in perfusate and freeze-clamped heart tissue. Raw MID were corrected for natural enrichments with the Isocor software (16). Note that in the following equations, mass isotopomers are identified as M1, M2 … M5, whereas the mol fractions of individual mass isotopomers are expressed as m1, m2 … m5.
 |
 |
In the denominator of Equation 2, terms: −m5Ac-CoA(m4acetate/m5acetate) and −m5Ac-CoA(m3acetate/m5acetate) correct the m4 and m3 enrichments of acetyl-CoA for the m4 and m3 components already present in tracer [13C2,2H3]acetate. The corrected m4 and m3 enrichments of acetyl-CoA compensate for the partial loss of 2H from M5 and M4 acetyl-CoA via enolization by citrate synthase (see “Results”).
 |
 |
 |
 |
 |
 |
 |
 |
Statistics
The statistical difference between groups of data were tested using a paired t test (GraphPad Prism 3.0). The exponential fitting was performed using Origin 9.1.
RESULTS
Testing the Concept Underlying the Measurement of Total Acetyl-CoA Flux in Rat Heart
We first perfused a group of hearts with 0.04 mm [13C2]acetate and 11 mm unlabeled glucose (Group 1). The uptake of M2 acetate was 0.71 ± 0.15 μmol·min−1·g dry wt−1 (Fig. 1, Group 1). We measured the m2 enrichments of (i) acetyl-CoA in the heart extract (10.6 ± 1.2%) and (ii) the acetyl moiety of citrate (9.8 ± 1.7%, not significant). The m2 enrichment ratio (acetyl moiety of citrate)/acetyl-CoA) was 0.92 ± 0.06; n = 5). Because the acetyl moiety of citrate derives directly from mitochondrial acetyl-CoA, we took the measured m2 enrichment of tissue acetyl-CoA as the enrichment of mitochondrial acetyl-CoA. The acetyl-CoA turnover, calculated by dividing the uptake of M2 acetate by the m2 enrichment of heart acetyl-CoA, was 6.9 ± 1.4 μmol·min−1·g dry wt−1 (Fig. 2, Group 1). This rate was compatible with the measured O2 uptake of the same hearts, i.e. 22.8 ± 3.7 μmol·min−1·g dry wt−1, given that the oxidation of 1 μmol of acetyl requires 3 μmol of O2 (17, 18). Tracer [13C2]acetate (infused at 0.04 mm into the perfusion line) contributed ∼10% to total acetyl-CoA turnover. We took the above data as demonstrating the feasibility of measuring acetyl-CoA turnover in the perfused heart with a tracer of M2 [13C2]acetate.
FIGURE 1.

Uptake of acetate tracers by the perfused hearts. G1, G2 … G8 represent perfusion groups 1, 2 … 8 with various substrates indicated on the x-axis legend, where the concentrations of substrates in each group were 11 mm glucose, 40 μm acetate, 100 microμnits of insulin, 0.4 mm palmitate, 0.1 mm octanoate, and 2 mm dichloroacetate (DCA). In G1, the tracer was M2 [13C2]acetate; in G2–8, the tracer was M5 [13C2,2H3]acetate. The uptakes were measured in samples of effluent and influent perfusate collected just before and just after quick-freezing the hearts at the end of 30 min perfusions with tracer. Data are presented as the mean ± S.D. (n = 5 in all groups). dw, dry weight.
Labeling Patterns of Heart Acetyl-CoA Labeled from [13C2,2H3]Acetate
Initial heart perfusion experiments with 0.04 mm [13C2,2H3]acetate and 11 mm unlabeled glucose (Fig. 2, Group 2) revealed three unexpected features and constraints of our strategy to measure acetyl-CoA turnover. The four panels of Fig. 3 show the MID of (i) acetate in the inflowing perfusate, (ii) acetate in the outflowing perfusate, (iii) acetyl-CoA synthesized in vitro from M5 acetate with acetyl-CoA synthetase, and (iv) acetyl-CoA in the heart extract. The vertical scales of the four panels were adjusted to equalize the visual heights of the M5 enrichment bars in all panels.
FIGURE 3.

Relative distributions of labeled mass isotopomers of acetate and acetyl-CoA in hearts perfused with 0.04 mm [13C2,2H3]acetate + 11 mm unlabeled glucose (Group 2). Panel A, inflowing acetate. Panel B, outflowing acetate. Panel C, acetyl-CoA synthesized in vitro from [13C2,2H3]acetate + acetyl-CoA synthetase (for comparison to tissue acetyl-CoA). Panel D, tissue acetyl-CoA. The vertical scales of the four panels were adjusted to equalize the visual heights of the M5 enrichment bars in all panels. Data are presented as the mean ± S.D. (n = 5).
First, although we infused pure tracer [13C2,2H3]acetate at a rate calculated to induce a 0.04 mm concentration of tracer in the inflowing perfusate, the total (M4 + M5) enrichment of acetate in the inflowing perfusate was only 43% (Fig. 3A). This results from the unavoidable contamination of distilled, deionized water (used to prepare the perfusate and reagents for the acetate assay) with ubiquitous traces of unlabeled acetate (10, 19, 20). An unknown component of this dilution is the blank of the assay of acetate concentration and enrichment. As a result, the actual total acetate concentration in the inflowing perfusate was not 0.04 mm but between 0.04 and 0.04/0.43 ≈ 0.09 mm. This concentration range is similar to the 0.1 mm physiological acetate concentration in plasma (19). The contamination does not affect the assay of the uptake of labeled acetate calculated using the mass spectrometric areas of M5 acetate and of the [2H9]pentanoate internal standard.
Second, comparison between the MID of inflowing and outflowing perfusates revealed a 1.4-fold isotopic dilution of M5 enrichment without change in the M4/M5 labeling ratio (Fig. 3, A and B). Thus, the perfused hearts released unlabeled (or minimally labeled) acetate, presumably from acetyl-CoA hydrolysis. The occurrence of cycling between acetyl-CoA and acetate in mammalian cells is well known (21, 22).
Third, the MID of tissue acetyl-CoA (Fig. 3D) was very different from the MID of perfusate acetate (Fig. 3, A and B) and of acetyl-CoA synthesized in vitro from [13C2,2H3]acetate and acetyl-CoA synthetase (Fig. 3C). Tissue acetyl-CoA showed substantial proportions of the M4, M3, and M2 mass isotopomers compared with M5. Thus, some process occurred after [13C2,2H3]acetate activation that resulted in partial multiple losses of 2H from mitochondrial [13C2,2H3]acetyl-CoA, presumably initially mostly M5 labeled, as in Fig. 3C. This evoked the process of acetyl-CoA enolization on citrate synthase described in 1965 by Eggerer (23). When [3H]acetyl-CoA was incubated with citrate synthase, the specific activity of acetyl-CoA decreased with time. Enolization of acetyl-CoA, a step in the citrate synthase reaction, results in the exchange of 3H from the methyl group of [3H]acetyl-CoA with H+ from water.
We conducted a detailed in vitro study of the enolization of [13C2,2H3]acetyl-CoA on citrate synthase and on ATP-citrate lyase (see the abstract in Li et al. (24)). The first part of the study demonstrated multiple cycles of enolization of [13C2,2H3]acetyl-CoA on citrate synthase, resulting in (i) time-dependent losses of 2H atoms from acetyl-CoA and (ii) formation of citrate isotopomers with 0, 1, and 2 2H atoms (in addition to 2 13C atoms). The second part of the study demonstrated that the cleavage of deuterated citrate with ATP-citrate lyase is accompanied by enolization and de-deuteration of acetyl-CoA generated in the reaction. In our perfused heart experiments, enolization of [13C2,2H3]acetyl-CoA resulted only in partial loss of 2H because of the simultaneous citrate synthesis. Because of the two enolization processes, we could not use the labeling of the acetyl moiety of citrate as a proxy of the labeling of mitochondrial acetyl-CoA in experiments with [13C2,2H3]acetate. This is because the M2 isotopomer of the acetyl-CoA derived from citrate cleavage would have two sources: (i) a fuel precursor (e.g. [13C6]glucose or [1,2-13C2]palmitate) and (ii) the complete de-deuteration (by ATP-citrate lyase during analysis) of the acetyl moiety of citrate labeled from the [13C2,2H3]acetate tracer. Thus, to calculate acetyl-CoA production from [1-13C]octanoate, [1,2-13C2]palmitate, or [13C6]glucose (in the presence of [13C2,2H3]acetate tracer; Groups 3–8), we used the M1 or M2 enrichment of acetyl-CoA in the heart extract as the MID of mitochondrial acetyl-CoA labeled from these substrates. In all experiments conducted with [13C2,2H3]acetate tracer (Groups 2–8), the total acetyl-CoA production was calculated from Equation 2. The very small proportion of M2 mass isotopomer in acetyl-CoA from hearts perfused with [13C2,2H3]acetate (Fig. 3C) shows that a very small fraction of the [13C2,2H3]acetyl-CoA formed in heart mitochondria had lost all their 2H atoms. Therefore, to calculate the turnover of acetyl-CoA, we used a composite enrichment of tissue acetyl-CoA, i.e. m5 + the increases in m4 and m3 enrichments resulting from partial loss of 2H from M5 acetyl-CoA via enolization (see Equation 2 in “Calculations” under “Experimental Procedures”).
Measuring the Turnover of Heart Acetyl-CoA with [13C2,2H3]Acetate
We calculated the total turnover of acetyl-CoA in 7 groups of hearts perfused with [13C2,2H3]acetate and with a variety of labeled and unlabeled substrates (Fig. 2; Groups 2–8). Note that similar total acetyl-CoA turnover in (i) hearts from Groups 1, 2, and 3 were perfused with 0.04 mm acetate + 11 mm glucose differently labeled, and (ii) hearts from Groups 6 and 7 were perfused with 0.04 mm [13C2,2H3]acetate + 11 mm glucose + 0.4 mm palmitate differently labeled. The rates of O2 uptake were similar in Fig. 2 (Groups 1–3). The rates of acetyl-CoA turnover we measured were similar to values obtained with other techniques (18).
In the bars of Fig. 2, the lighter section at the bottom of each bar correspond to sources of acetyl groups that were not traced with a labeled glucose or a labeled fatty acid (palmitate or octanoate). This includes the conversion of traces of unlabeled acetate from the perfusate (the “Labeling Patterns of Heart Acetyl-CoA Labeled from [13C2,2H3]Acetate” under “Results”). The contribution of unlabeled acetate should be at most equal to that of labeled acetate if all unlabeled acetate was in the perfusate (rather than in the blank of the acetate assay; this is unlikely). In Fig. 2 the top section of each bar represents the contribution of perfusate labeled acetate to the generation of acetyl groups used in the CAC (∼10%). In Fig. 2, where [13C6]glucose was present in the perfusate (Groups 3, 4, 5, 6, and 8), the green and red represent the contributions of glucose and glycogen to the acetyl groups used in the CAC (see below), respectively. In Groups 7 and 8, the dark blue and light blue sections represent the contributions of palmitate and octanoate, respectively.
Fig. 4 shows the complete MID of acetyl-CoA in hearts perfused with tracer [13C2,2H3]acetate + 11 mm 100% labeled [13C6]glucose + 0.1 mm [1-13C]octanoate (Group 8). The M0 acetyl-CoA derived from unlabeled endogenous sources. The M1 and M2 acetyl-CoA derived from [1-13C]octanoate and [13C6]glucose, respectively. The M5, M4, and M3 acetyl-CoA derived from tracer [13C2,2H3]acetate. This figure demonstrates the feasibility of measuring in the same hearts the total turnover of acetyl-CoA (≈CAC cycle) as well as the contributions to acetyl-CoA of two labeled substrates and of total endogenous unlabeled substrates. Note that in this case only one of the four acetyl-CoAs derived from [1-13C]octanoate was labeled. Therefore, to calculate the contribution of [1-13C]octanoate to acetyl-CoA turnover, one must multiply the M1 enrichment of acetyl-CoA by four (Equation 9). Likewise, to calculate the contribution of [1,2-13C2]palmitate to acetyl-CoA turnover (Fig. 4, Group 8), one must multiply the M2 enrichment of acetyl-CoA by eight (Equation 8).
FIGURE 4.

MID of acetyl-CoA in hearts perfused with tracer M5 acetate + 11 mm 100% labeled [13C6]glucose + 0. 1 mm [1-13C]octanoate (Group 8). Data are presented as mean ± S.D. (n = 5).
Labeling of Glucose-6-P and Glycogen from [13C6]Glucose
We assayed the concentration of glycogen in hearts perfused for 30 min with [13C6]glucose (Fig. 5, Groups 3, 4, 5, 6, and 8). At the zero time control, we assayed the glycogen concentration in hearts perfused for 30 s with 11 mm glucose before freeze-clamping (Fig. 5, left bar). In 3 of the 5 groups of hearts perfused for 60 min with 11 mm [13C6]glucose, there was statistically significant net accumulation of glycogen (1.8–2 μmol of glucose·min−1·g dry wt−1). This increase occurred in hearts perfused with insulin, as expected from the known effect of insulin in the heart (25). This increase also occurred in the presence of 0.4 mm palmitate, which contributed 85% to acetyl-CoA turnover (Fig. 2, Group 7) and spared glucose catabolism (Fig. 2, Group 6) compared with perfused without palmitate (Fig. 2, Group 3).
FIGURE 5.

Concentrations of glycogen in hearts at the end of the perfusions. The control group is an additional group of hearts perfused for only 30 s with buffer containing 11 mm unlabeled glucose. G3, G4, G5, G6, and G8 represent perfusion groups 3, 4, 5, 6, and 8 with various substrates indicated on the x-axis legend, where the concentrations of substrates in each group were 11 mm glucose, 40 μm acetate, 100 microunits of insulin, 0.4 mm palmitate, 0.1 mm octanoate, and 2 mm dichloroacetate (DCA), respectively. Data are presented as the mean ± S.D. (n = 5 in all groups).
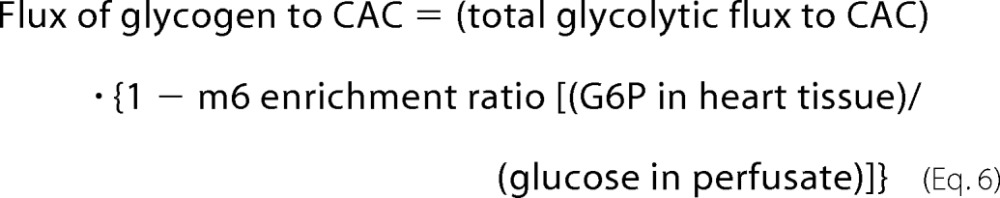
In perfusions with 40% or 100% [13C6]glucose, we measured the MID of G6P and glucose from glycogen in attempts to calculate (i) the contributions of glycogen to glycolysis and to acetyl groups used in the CAC and (ii) the contribution of perfusate glucose to tissue glycogen. We reasoned that a lower M6 enrichment of G6P compared with perfusate glucose would reflect a glycogenolytic flux because the tissue glycogen was unlabeled at the beginning of the perfusions. Also, the presence of M6 isotopomer in glucose from glycogen would reflect some degree of glycogen synthesis from perfusate glucose.
Fig. 6 shows the MID of inflowing perfusate glucose, tissue G6P, and glucose from tissue glycogen. Note that the first four groups (Groups 3–6) shown in each mass isotopomer cluster were perfused with 40% [13C6]glucose, whereas the last group (Group 8) was perfused with 100% [13C6]glucose. The small M5 components in perfusate glucose result from the presence of ∼1% 12C in 13C used to synthesize commercial [13C6]glucose. This explains why the M5 isotopomer of glucose is ∼6–7% that of the M6 isotopomer.
FIGURE 6.

Comparisons of the MID of glucose in inflowing perfusate (A), tissue G6P (B), and tissue glycogen glucose (C). The MID of glucose in the effluent perfusate (not shown) was identical with that of the influent perfusate. Note the presence of M3 mass isotopomers in B and C, insets). Data are presented as the mean ± S.D. (n = 5 in all groups).
In two groups there were significant decreases in the proportion of the M6 isotopomer of G6P compared with perfusate glucose (Fig. 6B, Groups 6 and 8). Also in Group 8 (perfused with 100% [13C6]glucose), 20% of G6P was unlabeled, whereas there was no unlabeled glucose in the perfusate (Fig. 6A). The data reflect substantial glycogenolysis concomitant with net glycogen accretion (Fig. 5). The latter was confirmed by the presence of M6 isotopomer in glucose from glycogen (Fig. 6C). Such cycling between glucose and glycogen had been previously described in perfused hearts (25). However unexpectedly, we detected small proportions of M3 isotopomers in G6P and in glycogen (Fig. 6, B and C, insets), whereas there was no detectable M3 isotopomer in perfusate glucose (influent (Fig. 6A, inset) or effluent (not shown)). We interpret the data as reflecting the occurrence of two substrate cycles linking at G6P: G6P → triose phosphates → G6P → glycogen → G6P (see “Discussion”).
Rates of Glycolysis
Because we could not measure the single-pass uptake of glucose across the heart, we estimated rates of glycolysis in perfusions with [13C6]glucose from the sum of (i) release of unlabeled + labeled lactate + pyruvate and (ii) the rate of glucose conversion to acetyl-CoA (Fig. 7). This slightly underestimates glycolysis because we could not estimate the rate of carboxylation of glucose-derived pyruvate in hearts perfused with [13C6]glucose. The enrichment ratio (m3 lactate in final effluent perfusate)/(m6 G6P in heart) was within 5–10% of unity in all cases (not shown). This ratio was barely increased when the m2 and m1 enrichments of lactate were included in the numerator of the labeling ratio. Thus, as expected, glucose and glycogen were the only substantial sources of lactate. Also, there was very low cycling between pyruvate, oxaloacetate, and phosphoenolpyruvate (as reflected by the presence of M2 and M1 isotopomers of lactate). Fig. 7 shows the distribution of the calculated rates of glycolysis between lactate release and conversion to acetyl-CoA. The calculated rates of glycolysis (Fig. 7) varied up to 5-fold between the groups as expected; the lowest rate occurred in the presence of 0.4 mm palmitate.
FIGURE 7.

Distribution of the rates of glycolysis between lactate + pyruvate production and conversion to acetyl-CoA in 5 groups of hearts perfused with [13C6]glucose. G3, G4, G5, G6, and G8 represent perfusion groups 3, 4, 5, 6, and 8 with various substrates indicated on the x-axis legend, where the concentrations of substrates in each group were 11 mm glucose, 40 μm acetate, 100 microunits of insulin, 0.4 mm palmitate, 0.1 mm octanoate, and 2 mm dichloroacetate (DCA), respectively. Data are presented as the mean ± S.D. (n = 5 in all groups). dw, dry weight.
Testing for Non-CAC Fates of Acetyl-CoA
Our calculation of the CAC flux assumes that the only fate of heart mitochondrial acetyl-CoA is oxidation in the CAC. Potential other fates of mitochondrial acetyl groups are releases as acetylcarnitine and ketone bodies, i.e. β-hydroxybutyrate + acetoacetate (Scheme 1). Such releases would occur through the reversible reactions catalyzed by (i) carnitine acetyl transferase (CrAT) and (ii) (S-3)-hydroxyacyl-CoA dehydrogenase + 3-oxoacid-CoA transferase + (R)-3-hydroxybutyrate dehydrogenase. This raises the question, Do the releases of acetyl carnitine and ketone bodies represent substantial losses of the [13C2,2H3]acetate label and/or of total acetyl-CoA turnover in the hearts? To answer this question we measured the release of acetyl carnitine and ketone bodies. The loss of label via acetylcarnitine and ketone bodies amount to at most 0.1% and 0.9%, respectively, of the uptake of acetate tracer (not shown). The total release of acetyl groups from the hearts (labeled + unlabeled) as acetylcarnitine + ketone bodies ranged from 0.17 to 2.3% of the acetyl-CoA turnover (not shown). Thus, the release of acetyl groups by hearts perfused under our conditions does not substantially underestimate calculations of acetyl-CoA turnover.
Labeling Pattern of Acetylcarnitine and Ketone Bodies Released by the Hearts
We tested whether the labeling pattern of acetylcarnitine and/or ketone bodies released by the perfused heart could be used as a continuous proxy of the labeling pattern of acetyl-CoA in hearts perfused with labeled substrates precursors of M1 or M2 acetyl-CoA ([1-13C]octanoate, [1,2-13C2]palmitate, [13C6]glucose, or [13C2]acetate). Fig. 8A shows that the isotopomer labeling ratios (mx acetyl carnitine)/(mx acetyl-CoA) varied over a 30-fold range between groups (from 0.18 to 5.7). We concluded that the labeling pattern of effluent acetylcarnitine is not a proxy of the labeling pattern of mitochondrial acetyl-CoA in the heart. Because of the instability of acetoacetate, the samples of effluent perfusate were treated with NaBH4 to convert acetoacetate to stable (RS)-β-hydroxybutyrate (9). Thus, the MID of ketone bodies was assayed as the MID of total β-hydroxybutyrate. Because ketone body molecules contain two acetyl groups, we observed, as expected, M2 + M4 or M1 + M2 isotopomers from substrates generating M2 or M1 acetyl-CoA, respectively. We calculated an approximate average enrichment of the acetyls of ketone bodies by dividing the enrichment of the lower mass ketone body isotopomer by two. This was only an approximation because of the incomplete isotopic equilibration of the two acetyls of AcAc-CoA by AcAc-CoA thiolase in heart (Ref. 26, originally described in liver by Huth et al. (27)). We then compared this estimate of ketone body acetyl enrichment with the corresponding enrichment of acetyl-CoA. In fact, the enrichment ratio (acetyl of ketone bodies)/acetyl-CoA) was lower than 1.0 in most cases (Fig. 8B). We concluded that the labeling pattern of effluent ketone bodies is not a proxy of the labeling pattern of mitochondrial acetyl-CoA in the heart. However, the labeling patterns of acetylcarnitine and ketone bodies provide useful information on the mechanisms by which excess acetyl groups generated in heart mitochondria are disposed (see “Discussion”).
FIGURE 8.
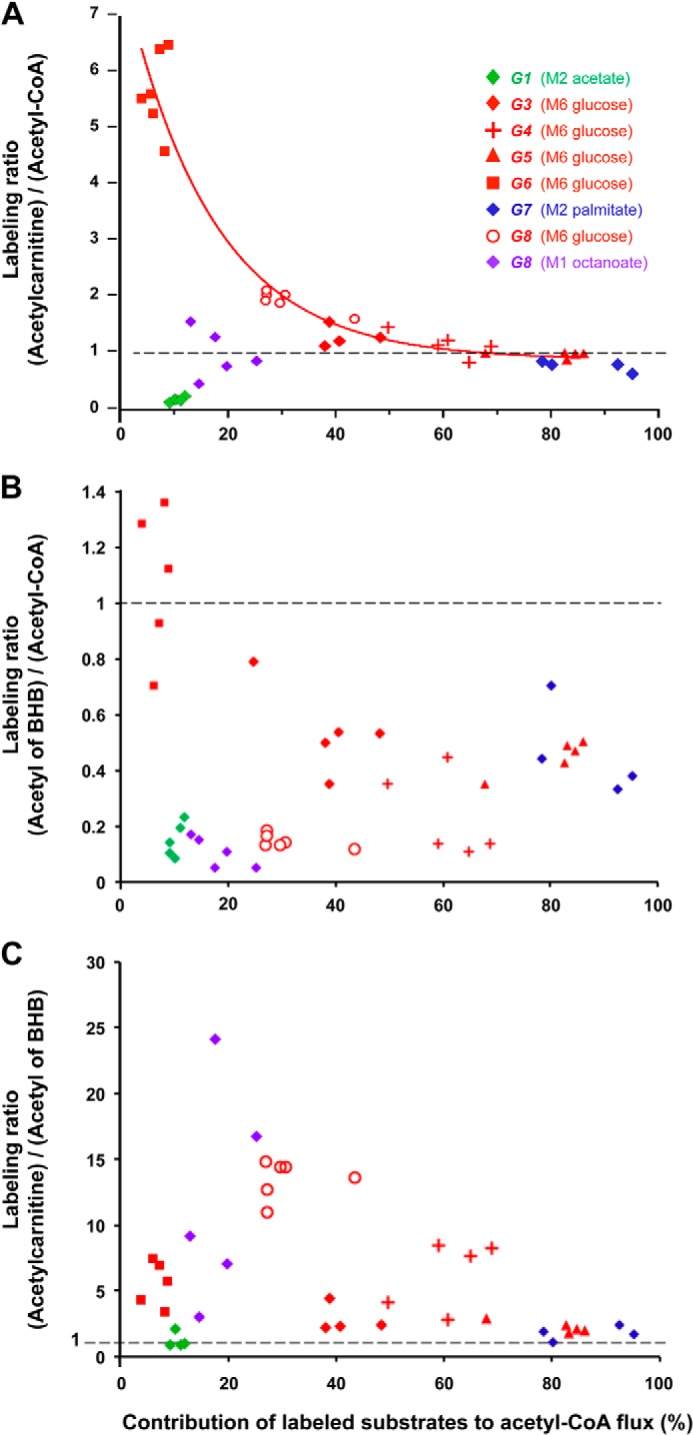
Labeling pattern of acetylcarnitine and ketone bodies released by the hearts in relation to the labeling of mitochondrial acetyl-CoA. A, labeling ratio (acetylcarnitine)/(acetyl-CoA). B, labeling ratio (average acetyl of ketone bodies)/(acetyl-CoA). C, labeling ratio (acetylcarnitine)/(average acetyl of ketone bodies). Groups are identified by numbers (1–8). Colors reflect the substrates generating labeled acetyl-CoA: [13C6]glucose (red), [1,2-13C2]acetate (green), [13C2]palmitate (blue), [1-13C]octanoate (red and purple). Note that Group 8 generated 2 clusters of points because it was perfused with [13C6]glucose + [1-13C]octanoate, which generated M2 and M1 acetyl-CoA, respectively. In panel A data from all 5 groups perfused with [13C6]glucose (red symbols) were fitted to a decaying exponential (y = 0.89 + 7.0exp(−0.061x%); r2 = 0.93).
DISCUSSION
Substrate Cycling between Trioses-P, G6P, and Glycogen
The presence of M3 isotopomers of G6P ((1–3%) Fig. 6, B and C, insets) in hearts perfused with 40% [13C6]glucose reveals a partial isotopic equilibration between G6P and triose phosphates. Because perfusate glucose is 40% M6 and 60% M, the MID of triose phosphates should be ∼40% M3 and 60% M. This is compatible with the measured MID of lactate in the effluent perfusate (not shown). If there were total isotopic equilibration between G6P and triose phosphates, the M, M3, and M6 enrichments of G6P would be 36, 48, and 16%, respectively. This is not the case (Fig. 6B). The limited isotopic equilibration of G6P and triose phosphates must occur via substrate cycling between fructose 6-phosphate and fructose 1,6-diphosphate, coupled to some degree of reversibility of the fructose-1,6-diphosphate aldolase reaction. Because this cycling involves two reactions, one of which uses ATP, this process is a true substrate cycle, not a simple partial isotopic equilibration via reversible reactions (28, 29). The cycling between fructose 6-phosphate and fructose 1,6-diphosphate would not in itself lead to the formation of M3 G6P were it not coupled to some degree of reversibility of fructose-1,6-diphosphate aldolase.
The same considerations apply to the presence of M3 and M6 isotopomers of glucose in heart glycogen (Fig. 6C). The M6 isotopomer of glycogen glucose and the decrease in the M6 enrichment of G6P compared with inflowing glucose reflect a substrate cycle between G6P and glycogen. The M3 isotopomer in glycogen reflects the coupling of the G6P/glycogen cycle to the G6P/triose phosphates cycle. Thus, our data demonstrate substrate cycling between triose phosphates and glycogen at the cost of two ATP per cycle.
Channeling of Acetyl Groups from Pyruvate Dehydrogenase (PDH) to CrAT
We had hoped that the labeling pattern of acetylcarnitine released by hearts could be used as a continuous proxy of the labeling pattern of acetyl-CoA in hearts perfused with labeled substrates as precursors of M1 or M2 acetyl-CoA ([1-13C]octanoate, [1,2-13C2]palmitate, [13C6]glucose, or [13C2]acetate). This was a reasonable expectation because (i) acetyl-CoA is the direct precursor of acetylcarnitine via a rapid reversible reaction (30), (ii) with all labeled substrates we used, labeled acetyl-CoA is formed in mitochondria, (iii) there is essentially no CrAT in the cytosol of rat heart (31), (iv) the non-recirculating perfusate contained 0.05 mm carnitine to prevent carnitine depletion of the perfused hearts, and (v) the hearts were perfused under steady state conditions. However, in half the groups, the isotopomer labeling ratios (mx acetylcarnitine)/(mx acetyl-CoA) were very different from 1.0 (Fig. 8A). Also, for a given substrate mix (e.g. glucose + palmitate), the M2 labeling ratio was different when the M2 label derived from [13C6]glucose versus [1,2-13C2]palmitate ((5.7 versus 0.74) Fig. 8, Groups 6 and 7)). Fig. 8 (red symbols) shows that in the 5 groups of hearts perfused with M6 glucose under different steady state conditions, the (M2 acetylcarnitine)/(M2 acetyl-CoA) ratio decreased from 5.7 to 1.0 when the contribution of M6 glucose to acetyl-CoA increased from 10 to 80%. The data points were well fitted to a decaying exponential with an extrapolated ratio of 7.9 at zero glucose contribution to acetyl-CoA turnover. Thus, at low PDH flux, labeled acetyl-CoA derived from M6 glucose via PDH is preferentially channeled to CrAT, and acetylcarnitine is more labeled than the total pool of mitochondrial acetyl-CoA. As the contribution of PDH to acetyl-CoA increases, there is a progressive isotopic equilibration between acetylcarnitine and acetyl-CoA labeled from M6 glucose.
In Fig. 8A, the data points in green, purple, and blue show the labeling ratios (mx acetylcarnitine)/(mx acetyl-CoA) in perfusions with [13C2]acetate (Group 1), [1-13C]octanoate (Group 8), and [1,2-13C2]palmitate (Group 7) as a function of the contributions of these substrates to total acetyl-CoA turnover. When 80–95% of the label derived from M2 palmitate (Group 7), there was incomplete isotopic equilibration between acetylcarnitine and acetyl-CoA. Even under these conditions, the low flux of unlabeled acetyl-CoA derived from PDH was still preferentially channeled to CrAT. In addition, when the tracer was M2 acetate (green symbols), which contributed only ≈10% to the acetyl-CoA flux, the (M2 acetylcarnitine)/(M2 acetyl-CoA) was ∼0.2. Thus, the labeling of acetylcarnitine from M2 acetate was much less than the contribution of acetate to acetyl-CoA. This is the opposite of what was observed with M6 glucose (red symbols). Thus, although the streaming to CrAT of acetyl-CoA formed from M2 acetate was impeded, the streaming of acetyl formed from M6 glucose was favored.
We view these data as evidence of metabolic channeling of acetyl groups from PDH to CrAT. The concept of metabolic channeling was developed by Srere (32, 33). Metabolic channeling results from associations of enzyme molecules forming a metabolic tunnel (or metabolon) through which the product of one enzymatic reaction is transmitted to the active site of a second enzyme in a sequence.
Schroeder et al. (34) perfused rat hearts with non-recirculating bicarbonate buffer containing 11 mm glucose + 2.5 mm unlabeled pyruvate. The latter was twice transiently replaced for 2-min periods by 2.5 mm hyperpolarized [2-13C]pyruvate. The authors monitored by NMR the labeling kinetics of acetylcarnitine and of citrate. The labeling of citrate was taken as a proxy of the labeling of acetyl-CoA. From the kinetics of acetylcarnitine and citrate labeling, they concluded that under large PDH flux, about one-half of acetyl groups derived from PDH were transiently stored as acetylcarnitine before being re-converted to acetyl-CoA and irreversibly incorporated in citrate. The authors carefully acknowledged that their rate constants “reflect the rate of 13C accumulation in each metabolite pool, not necessarily the overall amount of production of each metabolite.” We view their data on apparent return of label of acetyl groups from acetylcarnitine to acetyl-CoA as reflecting a continuous isotopic exchange rather than a net flux. Schroeder et al. (34) data illustrate that even under a supra-physiological supply of acetyl-CoA via PDH, the CrAT reaction is reversible. The reversibility of the CrAT reaction presumably spared the pool of carnitine in these hearts perfused without carnitine. These non-steady state isotopic hyperpolarization NMR experiments allowed a glimpse into the CrAT kinetics of the intact heart perfused under metabolic steady state conditions. Our steady state isotopic data show that preferential labeling of acetylcarnitine via PDH occurs in the absence of pyruvate overload and especially at low PDH flux. Thus, Schroeder et al. (34) experiments and our experiments provide complementary information on the channeling of acetyl groups through the PDH-CrAT metabolic tunnel.
We did not find in the literature-specific reports on the association of PDH and CrAT molecules in mitochondria. However, the following reports point to interplay between CrAT and PDH. First, chronic carnitine treatment stimulates the PDH complex in human muscle mitochondria (35). Second, muscle-specific deletion of CrAT in mice and human myocytes decreases glucose tolerance and metabolic flexibility (36). Third, obesity and lipid stress inhibit PDH and CrAT in muscle mitochondria (37). Very active enzymes that catalyze reversible reactions are generally not viewed as regulating carbon flux through pathways. However, as a component of a metabolic tunnel with irreversible PDH, CrAT may contribute to the regulation of glucose metabolism in heart as we have shown and possibly in muscle.
Labeling of Ketone Bodies Released by the Perfused Hearts
The average labeling of acetyl groups of ketone bodies released by the hearts was, in most cases, lower than the labeling of acetyl-CoA (Fig. 8B). This, although the acetyl-CoA and ketone body pools are linked by the reversible reactions catalyzed by AcAc-CoA thiolase and OAT. This results from the dilution of AcAc-CoA labeling by the β-oxidation of endogenous unlabeled fatty acids (Scheme 1). Also, the β-oxidation of [1,2-13C2]palmitate forms unlabeled AcAc-CoA after six cycles of β-oxidation, the first of which releases labeled acetyl-CoA. A second cause is the incomplete isotopic equilibration of the two acetyls of AcAc-CoA via the thiolase (26, 27). For these reasons, the labeling of ketone bodies released by the perfused heart cannot be used as a proxy for the labeling of mitochondrial acetyl-CoA.
Release of Acetyl Groups from the Perfused Hearts in Excess of CAC Flux
The perfused hearts release small amounts of acetyl groups in the form of ketone bodies and acetylcarnitine. This release amounts to at most 2% of the turnover of acetyl-CoA (not shown). We view this release as a double “bleeding valve” of acetyl groups, which are produced in slight excess of the CAC flux. This is akin to the safety valve on a steam engine. The release of acetyl groups reflects the slight excess of (i) the rate of production of mitochondrial acetyl-CoA from all sources over (ii) the irreversible flux through the citrate synthase reaction. The latter flux is directly linked to the respiratory chain flux. Note that the equilibrium position of the CrAT reaction is close to 1.0 (37). In addition, the equilibrium constant of the OAT reaction is far toward acetoacetate (38). Also, the heart is the mammalian organ with the highest OAT activity (48 units/g in the direction AcAc-CoA to acetoacetate (39)). Thus, the CrAT and OAT reactions can rapidly dispose of any acetyl-CoA generated in excess of the citrate synthase flux. By this mechanism, any excess acetyl is disposed of without CoA trapping, which could perturb many metabolic processes (40).
One could view the mechanisms of acetyl group release via CrAT and OAT as parallel. The channeling of acetyl from PDH to CrAT would dispose of excess carbohydrate carbon, and the OAT reaction would dispose of excess fatty acid carbon. In fact, our data (panels A, B, and C of Fig. 8) reveal an integrated and flexible mechanism of acetyl release via CrAT and OAT. Even when labeled acetyl groups generated from M6 glucose via PDH are channeled to CrAT, ketone bodies are labeled (Fig. 8B). Conversely, labeled acetyl groups generated from [1-13C]octanoate or [13C2]palmitate are found in ketone bodies and in acetylcarnitine (Fig. 8). The link between the two mechanisms of excess acetyl group disposal is the reversible reaction catalyzed by acetoacetyl-CoA thiolase (Scheme 1). Thus, the three reversible reactions catalyzed by CrAT, OAT, and AcAc-CoA thiolase dispose of excess acetyl available to the CAC while sparing CoA.
Because the hearts were perfused with nonrecirculating buffer containing zero ketone bodies, the small release of ketone bodies we report represents a small net ketogenesis. However, in vivo there are always some ketone bodies in plasma. These are taken up by muscle and heart. If the pool of muscle or heart AcAc-CoA becomes labeled from an exogenous fatty acid, the organ releases labeled ketone bodies while being a net sink of labeled + unlabeled ketone bodies (26). By the same isotopic exchange we have called pseudoketogenesis (26, 41, 42), the muscle OAT reaction dilutes the enrichment of infused labeled ketone bodies, leading to an artifactual overestimation of ketogenesis (41).
Because the acetylcarnitine concentration in heart is ∼20 times greater than that of acetyl-CoA, the pool of acetylcarnitine is often viewed as a buffer of acetyl groups. Note, however, that the size of the acetylcarnitine pool in live rat hearts (0.9 μmol·g dry wt−1 (34)) is small compared with the rate of acetyl-CoA turnover (4.5 to 7 μmol·min−1·g dry wt−1 (Fig. 2)). Thus, although the release of acetylcarnitine from the heart is a valve on acetyl production, the flux through this valve is limited by the pool of carnitine in the heart. In contrast, the release of acetyl groups as ketone bodies is not limited and is favored by the equilibrium of the OAT.
We acknowledge that physiological citrate cataplerosis (not measured in this study) contributes somewhat to the release of acetyl groups from the heart (up to 2% of CAC flux in perfused working rat hearts (43). Total cataplerosis in live pig hearts amounts to ∼2% that of CAC turnover (44). Because the rat hearts we perfused were in steady state of beats/min and O2 uptake, we assume that cataplerosis was compensated by anaplerosis from pyruvate (44). Similarly, cataplerosis affects the rates of total acetyl-CoA flux calculated by others from the production of labeled CO2 (45).
In conclusion, the association of targeted metabolomics and mass isotopomer analysis has allowed us to estimate the rate of CAC flux in the perfused heart and the contributions of fuels to energy. It also led to the identification of substrate cycles between triose phosphates glucose-6-P and glycogen. Furthermore, it identified a metabolic channeling between PDH and CrAT. Lastly, it characterized physiological bleeding valve mechanisms on the supply of acetyl groups to the CAC. Although this study has been conducted in nonworking hearts, its protocol can be adapted to the working hearts. This will allow in depth studies of metabolic interconnections in disease models.
Acknowledgments
We thank the Case Mouse Metabolic and Phenotyping Center (MMPC) for helping with the heart perfusion experiments and analytical studies.
This work was supported, in whole or in part, by National Institutes of Health Roadmap Grant R33DK070291 and Case Mouse Metabolic and Phenotyping Center (MMPC) Grant U24DK76174 (to H. B.). This work was also supported by American Heart Association Grant 12GRNT12050453 (to G.-F. Z.) and by funds from the Cleveland Mt. Sinai Health Care Foundation.
Mass isotopomers are designated as M, M1, M2 … Mn, where n is the number of heavy atoms in the molecule. Mol fractions of mass isotopomers are designated as m, m1, m2 ….
- CAC
- citric acid cycle
- MID
- mass isotopomer distribution
- CrAT
- carnitine acetyltransferase
- G6P
- glucose 6-phosphate
- OAT
- 3-oxoacid-CoA transferase
- PDH
- pyruvate dehydrogenase
- AcAc
- acetoacetate.
REFERENCES
- 1. Bian F., Kasumov T., Thomas K. R., Jobbins K. A., David F., Minkler P. E., Hoppel C. L., Brunengraber H. (2005) Peroxisomal and mitochondrial oxidation of fatty acids in the heart, assessed from the 13C labeling of malonyl-CoA and the acetyl moiety of citrate. J. Biol. Chem. 280, 9265–9271 [DOI] [PubMed] [Google Scholar]
- 2. Burgess S. C., Carvalho R. A., Merritt M. E., Jones J. G., Malloy C. R., Sherry A. D. (2001) 13C isotopomer analysis of glutamate by J-resolved heteronuclear single quantum coherence spectroscopy. Anal. Biochem. 289, 187–195 [DOI] [PubMed] [Google Scholar]
- 3. Chatham J. C., Forder J. R., Glickson J. D., Chance E. M. (1995) Calculation of absolute metabolic flux and the elucidation of the pathways of glutamate labeling in perfused rat heart by 13C NMR spectroscopy and nonlinear least squares analysis. J. Biol. Chem. 270, 7999–8008 [DOI] [PubMed] [Google Scholar]
- 4. Bian F., Kasumov T., Jobbins K. A., Minkler P. E., Anderson V. E., Kerner J., Hoppel C. L., Brunengraber H. (2006) Competition between acetate and oleate for the formation of malonyl-CoA and mitochondrial acetyl-CoA in the perfused rat heart. J. Mol. Cell Cardiol. 41, 868–875 [DOI] [PMC free article] [PubMed] [Google Scholar]
- 5. Ballard F. J. (1972) Supply and utilization of acetate in mammals. Am. J. Clin. Nutr. 25, 773–779 [DOI] [PubMed] [Google Scholar]
- 6. Fujino T., Kondo J., Ishikawa M., Morikawa K., Yamamoto T. T. (2001) Acetyl-CoA synthetase 2, a mitochondrial matrix enzyme involved in the oxidation of acetate. J. Biol. Chem. 276, 11420–11426 [DOI] [PubMed] [Google Scholar]
- 7. Randle P. J., England P. J., Denton R. M. (1970) Control of the tricarboxylate cycle and its interactions with glycolysis during acetate utilization in rat heart. Biochem. J. 117, 677–695 [DOI] [PMC free article] [PubMed] [Google Scholar]
- 8. Linn T. C., Srere P. A. (1979) Identification of ATP citrate lyase as a phosphoprotein. J. Biol. Chem. 254, 1691–1698 [PubMed] [Google Scholar]
- 9. Des Rosiers C., Montgomery J. A., Desrochers S., Garneau M., David F., Mamer O. A., Brunengraber H. (1988) Interference of 3-hydroxyisobutyrate with measurements of ketone body concentration and isotopic enrichment by gas chromatography-mass spectrometry. Anal. Biochem. 173, 96–105 [DOI] [PubMed] [Google Scholar]
- 10. Tomcik K., Ibarra R. A., Sadhukhan S., Han Y., Tochtrop G. P., Zhang G. F. (2011) Isotopomer enrichment assay for very short chain fatty acids and its metabolic applications. Anal. Biochem. 410, 110–117 [DOI] [PMC free article] [PubMed] [Google Scholar]
- 11. Hazey J. W., Yang D., Powers L., Previs S. F., David F., Beaulieu A. D., Puchowicz M. A., Potter J. L., Palmquist D. L., Brunengraber H. (1997) Tracing gluconeogenesis with deuterated water: measurement of low deuterium enrichments on carbons 6 and 2 of glucose. Anal. Biochem. 248, 158–167 [DOI] [PubMed] [Google Scholar]
- 12. Hachey D. L., Patterson B. W., Reeds P. J., Elsas L. J. (1991) Isotopic determination of organic keto acid pentafluorobenzyl esters in biological fluids by negative chemical ionization gas chromatography/mass spectrometry. Anal. Chem. 63, 919–923 [DOI] [PubMed] [Google Scholar]
- 13. Gu L., Zhang G. F., Kombu R. S., Allen F., Kutz G., Brewer W. U., Roe C. R., Brunengraber H. (2010) Parenteral and enteral metabolism of anaplerotic triheptanoin in normal rats. II. Effects on lipolysis, glucose production, and liver acyl-CoA profile. Am. J. Physiol. Endocrinol. Metab 298, E362–E371 [DOI] [PMC free article] [PubMed] [Google Scholar]
- 14. Zhang G. F., Kombu R. S., Kasumov T., Han Y., Sadhukhan S., Zhang J., Sayre L. M., Ray D., Gibson K. M., Anderson V. A., Tochtrop G. P., Brunengraber H. (2009) Catabolism of 4-hydroxyacids and 4-hydroxynonenal via 4-hydroxy-4-phosphoacyl-CoAs. J. Biol. Chem. 284, 33521–33534 [DOI] [PMC free article] [PubMed] [Google Scholar]
- 15. Yang W. C., Sedlak M., Regnier F. E., Mosier N., Ho N., Adamec J. (2008) Simultaneous quantification of metabolites involved in central carbon and energy metabolism using reversed-phase liquid chromatography-mass spectrometry and in vitro 13C labeling. Anal. Chem. 80, 9508–9516 [DOI] [PubMed] [Google Scholar]
- 16. Millard P., Letisse F., Sokol S., Portais J. C. (2012) IsoCor: correcting MS data in isotope labeling experiments. Bioinformatics 28, 1294–1296 [DOI] [PubMed] [Google Scholar]
- 17. Malloy C. R., Jones J. G., Jeffrey F. M., Jessen M. E., Sherry A. D. (1996) Contribution of various substrates to total citric acid cycle flux and anaplerosis as determined by 13C isotopomer analysis and O2 consumption in the heart. MAGMA 4, 35–46 [DOI] [PubMed] [Google Scholar]
- 18. Chance E. M., Seeholzer S. H., Kobayashi K., Williamson J. R. (1983) Mathematical analysis of isotope labeling in the citric acid cycle with applications to 13C NMR studies in perfused rat hearts. J. Biol. Chem. 258, 13785–13794 [PubMed] [Google Scholar]
- 19. David F., Beylot M., Reider M. W., Anderson V. E., Brunengraber H. (1994) Assay of the concentration and 13C enrichment of acetate and acetyl-CoA by gas chromatography-mass spectrometry. Anal. Biochem. 218, 143–148 [DOI] [PubMed] [Google Scholar]
- 20. Powers L., Osborn M. K., Yang D., Kien C. L., Murray R. D., Beylot M., Brunengraber H. (1995) Assay of the concentration and stable isotope enrichment of short-chain fatty acids by gas chromatography/mass spectrometry. J. Mass Spectrom. 30, 747–754 [Google Scholar]
- 21. Crabtree B., Gordon M. J., Christie S. L. (1990) Measurement of the rates of acetyl-CoA hydrolysis and synthesis from acetate in rat hepatocytes and the role of these fluxes in substrate cycling. Biochem. J. 270, 219–225 [DOI] [PMC free article] [PubMed] [Google Scholar]
- 22. Leighton F., Bergseth S., Rørtveit T., Christiansen E. N., Bremer J. (1989) Free acetate production by rat hepatocytes during peroxisomal fatty acid and dicarboxylic acid oxidation. J. Biol. Chem. 264, 10347–10350 [PubMed] [Google Scholar]
- 23. Eggerer H. (1965) On the mechanism of the biological transformation of citric acid. VI. Citrate synthetase is an acetyl Co A-enolase. Biochem. Z. 343, 111–138 [PubMed] [Google Scholar]
- 24. Li Q., Anderson V. E., Brunengraber H., Zhang G. F. (2013) Multiple cycles of acetyl-CoA enolization catalyzed by citrate synthase (CS) and ATP-citrate lyase (ACL). Faseb J. 27, Abst. 794-3 [Google Scholar]
- 25. Henning S. L., Wambolt R. B., Schönekess B. O., Lopaschuk G. D., Allard M. F. (1996) Contribution of glycogen to aerobic myocardial glucose utilization. Circulation 93, 1549–1555 [DOI] [PubMed] [Google Scholar]
- 26. Fink G., Desrochers S., Des Rosiers C., Garneau M., David F., Daloze T., Landau B. R., Brunengraber H. (1988) Pseudoketogenesis in the perfused rat heart. J. Biol. Chem. 263, 18036–18042 [PubMed] [Google Scholar]
- 27. Huth W., Dierich C., von Oeynhausen V., Seubert W. (1973) On the mechanism of ketogenesis and its control. I. On a possible role of acetoacetyl-CoA thiolase in the control of ketone body production. Hoppe-Seyler's Z. Physiol. Chem. 354, 635–649 [DOI] [PubMed] [Google Scholar]
- 28. Challiss R. A., Arch J. R., Crabtree B., Newsholme E. A. (1984) Measurement of the rate of substrate cycling between fructose 6-phosphate and fructose 1,6-bisphosphate in skeletal muscle by using a single-isotope technique. Biochem. J. 223, 849–853 [DOI] [PMC free article] [PubMed] [Google Scholar]
- 29. Challiss R. A., Arch J. R., Newsholme E. A. (1984) The rate of substrate cycling between fructose 6-phosphate and fructose 1,6-bisphosphate in skeletal muscle. Biochem. J. 221, 153–161 [DOI] [PMC free article] [PubMed] [Google Scholar]
- 30. Fritz I. B., Schultz S. K., Srere P. A. (1963) Properties of partially purified carnitine acetyltransferase. J. Biol. Chem. 238, 2509–2517 [PubMed] [Google Scholar]
- 31. Abbas A. S., Wu G., Schulz H. (1998) Carnitine acetyltransferase is not a cytosolic enzyme in rat heart and, therefore, cannot function in the energy-linked regulation of cardiac fatty acid oxidation. J. Mol. Cell Cardiol. 30, 1305–1309 [DOI] [PubMed] [Google Scholar]
- 32. Ovádi J., Srere P. A.(1996) Metabolic consequences of enzyme interactions. Cell Biochem. Funct. 14, 249–258 [DOI] [PubMed] [Google Scholar]
- 33. Srere P. A. (1987) Complexes of sequential metabolic enzymes. Annu. Rev. Biochem. 56, 89–124 [DOI] [PubMed] [Google Scholar]
- 34. Schroeder M. A., Atherton H. J., Dodd M. S., Lee P., Cochlin L. E., Radda G. K., Clarke K., Tyler D. J. (2012) The cycling of acetyl-coenzyme A through acetylcarnitine buffers cardiac substrate supply: a hyperpolarized 13C magnetic resonance study. Circ. Cardiovasc. Imaging 5, 201–209 [DOI] [PMC free article] [PubMed] [Google Scholar]
- 35. Uziel G., Garavaglia B., Di Donato S. (1988) Carnitine stimulation of pyruvate dehydrogenase complex (PDHC) in isolated human skeletal muscle mitochondria. Muscle Nerve 11, 720–724 [DOI] [PubMed] [Google Scholar]
- 36. Muoio D. M., Noland R. C., Kovalik J. P., Seiler S. E., Davies M. N., DeBalsi K. L., Ilkayeva O. R., Stevens R. D., Kheterpal I., Zhang J., Covington J. D., Bajpeyi S., Ravussin E., Kraus W., Koves T. R., Mynatt R. L. (2012) Muscle-specific deletion of carnitine acetyltransferase compromises glucose tolerance and metabolic flexibility. Cell Metab. 15, 764–777 [DOI] [PMC free article] [PubMed] [Google Scholar]
- 37. Seiler S. E., Martin O. J., Noland R. C., Slentz D. H., DeBalsi K. L., Ilkayeva O. R., An J., Newgard C. B., Koves T. R., Muoio D. M. (2014) Obesity and lipid stress inhibit carnitine acetyltransferase activity. J. Lipid Res. 55, 635–644 [DOI] [PMC free article] [PubMed] [Google Scholar]
- 38. Hersh L. B., Jencks W. P. (1967) Coenzyme A transferase: kinetics and exchange reactions. J. Biol. Chem. 242, 3468–3480 [PubMed] [Google Scholar]
- 39. Beis A., Zammit V. A., Newsholme E. A. (1980) Activities of 3-hydroxybutyrate dehydrogenase, 3-oxoacid CoA-transferase and acetoacetyl-CoA thiolase in relation to ketone-body utilisation in muscles from vertebrates and invertebrates. Eur. J. Biochem. 104, 209–215 [DOI] [PubMed] [Google Scholar]
- 40. Mitchell G. A., Gauthier N., Lesimple A., Wang S. P., Mamer O., Qureshi I. (2008) Hereditary and acquired diseases of acyl-coenzyme A metabolism. Mol. Genet. Metab. 94, 4–15 [DOI] [PubMed] [Google Scholar]
- 41. Des Rosiers C., Montgomery J. A., Garneau M., David F., Mamer O. A., Daloze P., Toffolo G., Cobelli C., Landau B. R., Brunengraber H. (1990) Pseudoketogenesis in hepatectomized dogs. Am. J. Physiol. 258, E519–E528 [DOI] [PubMed] [Google Scholar]
- 42. Landau B. R. (1986) A potential pitfall in the use of isotopes to measure ketone body production. Metabolism 35, 94–95 [DOI] [PubMed] [Google Scholar]
- 43. Comte B., Vincent G., Bouchard B., Des Rosiers C. (1997) Probing the origin of acetyl-CoA and oxaloacetate entering the citric acid cycle from the 13C labeling of citrate released by perfused rat hearts. J. Biol. Chem. 272, 26117–26124 [DOI] [PubMed] [Google Scholar]
- 44. Panchal A. R., Comte B., Huang H., Kerwin T., Darvish A., des Rosiers C., Brunengraber H., Stanley W. C. (2000) Partitioning of pyruvate between oxidation and anaplerosis in swine hearts. Am. J. Physiol. Heart Circ. Physiol. 279, H2390–H2398 [DOI] [PubMed] [Google Scholar]
- 45. Broderick T.L., Quinney H. A., Lopaschuk G. D. (1992) Carnitine stimulation of glucose oxidation in the fatty acid perfused isolated working rat heart. J. Biol. Chem. 267, 3758–3763 [PubMed] [Google Scholar]