

Background: RBCs produce H2S but, lacking mitochondria, are devoid of the canonical sulfide oxidation pathway.
Results: RBCs utilize methemoglobin to catalyze H2S oxidation producing thiosulfate and polysulfide.
Conclusion: In the presence of NADPH and a reductase, ferric sulfide hemoglobin is converted to oxyhemoglobin, completing the sulfide oxidation cycle.
Significance: We describe a novel mechanism for H2S oxidation that may be pertinent to other hemeproteins.
Keywords: Heme, Hemoglobin, Hydrogen Sulfide, Oxidation-Reduction (Redox), Sulfur, Hemoglobin
Abstract
A cardioprotectant at low concentrations, H2S is a toxin at high concentrations and inhibits cytochrome c oxidase. A conundrum in H2S homeostasis is its fate in red blood cells (RBCs), which produce H2S but lack the canonical mitochondrial sulfide oxidation pathway for its clearance. The sheer abundance of RBCs in circulation enhances the metabolic significance of their clearance strategy for H2S, necessary to avoid systemic toxicity. In this study, we demonstrate that H2S generation by RBCs is catalyzed by mercaptopyruvate sulfurtransferase. Furthermore, we have discovered the locus of sulfide oxidation in RBCs and describe a new role for an old protein, hemoglobin, which in the ferric or methemoglobin state binds H2S and oxidizes it to a mixture of thiosulfate and hydropolysulfides. Our study reveals a previously undescribed route for the biogenesis of hydropolysulfides, which are increasingly considered important for H2S-based signaling, but their origin in mammalian cells is unknown. An NADPH/flavoprotein oxidoreductase system restores polysulfide-carrying hemoglobin derivatives to ferrous hemoglobin, thus completing the methemoglobin-dependent sulfide oxidation cycle. Methemoglobin-dependent sulfide oxidation in mammals is complex and has similarities to chemistry reported for the dissolution of iron oxides in sulfidic waters and during bioleaching of metal sulfides. The catalytic oxidation of H2S by hemoglobin explains how RBCs maintain low steady-state H2S levels in circulation, and suggests that additional hemeproteins might be involved in sulfide homeostasis in other tissues.
Introduction
Biotic sulfide oxidation is an important limb of the global sulfur cycle and may have influenced early symbiotic relationships in the evolution of the eukaryotic lineage (1). However, the bacterially derived sulfide oxidation pathway that resides in mitochondria is missing in RBCs, which as producers of H2S must rely on an alternative strategy for its clearance. This problem is magnified by the sheer abundance of RBCs in circulation, which in the absence of an H2S clearance mechanism, would lead to certain death due to the buildup of toxic levels of H2S and its facile permeation across lipid bilayers (2, 3). As a signaling molecule, H2S elicits profound physiological effects ranging from cardioprotection to being an anti-inflammatory mediator and a neuromodulator (4, 5). Three enzymes, cystathionine β-synthase (CBS),2 γ-cystathionase (CSE), and mercaptopyruvate sulfurtransferase (MST) are primarily responsible for cellular H2S biogenesis, and their relative contributions vary in a tissue-specific manner (6, 7). Sulfide homeostasis is contributed in part by its proficient removal via enzymes in the mitochondrial sulfide oxidation pathway, which convert it to thiosulfate and sulfate, the primary forms of sulfur excreted from the body. Circulating levels of H2S in plasma are low (∼150 nm) (8) and are expected to be critically influenced by sulfide metabolism in red blood cells (RBCs), which number ∼5 billion/milliliter of blood in a normal adult. In principle, RBCs might influence blood vessel tension by regulating local H2S levels, which in turn, regulate their own microcirculation. However, little is known about H2S homeostasis in RBCs, i.e. which enzymes contribute to its production and how H2S is removed. Although MST activity in RBCs was determined with its true substrate, 3-mercatopyruvate (9), the activity of CSE was measured with the substrate analog β-chloroalanine (10), which also reacts with other pyridoxal phosphate-containing enzymes, making the reported CSE activity in RBCs uncertain.
Because the toxicity of H2S results from its inhibition of cytochrome c oxidase (11), organisms have developed strategies for averting a buildup of H2S. An obvious candidate for sulfide oxidation in RBCs is hemoglobin (Hb) present at an intracellular concentration of ∼5 mm. Several lines of evidence support the feasibility of Hb-dependent sulfide oxidation, which could be important, in addition to the canonical mitochondrial sulfide oxidation pathway (12). The reaction of sulfide with Hb was first reported in 1863 under conditions that led to the formation of sulfhemoglobin, with a characteristic green color (13). This reaction is observed with oxyferrous Hb, results in covalent modification of the tetrapyrrole (14), and is not pertinent to catalytic sulfide oxidation. Stoichiometric binding of H2S to ferric or methemoglobin (MetHb) to give sulfide-MetHb was first reported in 1933 (15). MetHb is formed by auto-oxidation of ferrous Hb and represents ∼1–3% of total Hb. Methemoglobinemia protects against sulfide toxicity and a ratio of ∼3 mol of H2S inactivated per mol of MetHb heme has been reported, suggesting turnover rather than simply sulfide binding by heme (16). Free hemin converts sulfide to thiosulfate under aerobic conditions in an ∼50% yield (17). Some invertebrates living in sulfide-rich environments use Hb as a sulfide carrier to deliver H2S to symbiotic bacteria that use it as an energy source (18). Spectroscopic and structural studies on Hb suggest that several factors control the reactivity of H2S with Hb including the orientation of side chains and the dielectric constant in the vicinity of the distal ligand (19). Collectively, these observations provide evidence for heme-dependent sulfide chemistry, albeit a role for Hb in catalytic sulfide oxidation in higher organisms has not been considered. In this study, we report that sulfide homeostasis in RBCs involves its generation by MST and its oxidative removal by MetHb, resulting in the production of thiosulfate and hydropolysulfides (hereafter referred to as polysulfides).
EXPERIMENTAL PROCEDURES
Materials
Human RBCs, obtained from normal healthy volunteers, were kindly provided by Dr. David A. Fox (University of Michigan). Human MetHb and sickle cell HbS (ferrous form), Na2S nonahydrate, 2,3-diphosphoglycerate, inositol hexaphosphate, iodoacetamide, cysteine and d,l-homocysteine, and Clostridium kluyveri diaphorase were purchased from Sigma. The following reagents were obtained from the indicated vendors: monobromobimane (FluoroPure grade, Molecular Probes, Grand Island, NY), 3-mercaptopyruvate (Research Organics, Cleveland, OH), and DTT (Gold Biotechnology, St. Louis, MO). Recombinant human CBS (20, 21), CSE (22, 23), MST (23), and methionine synthase reductase (MSR) (24) were purified as described previously.
Production of RBC Samples
RBC were washed three times by resuspension in 3 volumes of PBS containing 5 mm glucose and centrifuged for 10 min at 2000 × g at 4 °C. The packed cells were diluted in 9 volumes of PBS containing 5 mm glucose and immediately used in experiments. For lysate preparation, RBCs were washed with and then resuspended in an equal volume of PBS. The suspension was mixed with 4 volumes of distilled water to give a final 1:9 dilution of RBC lysate. The lysate was kept frozen at −80 °C until use. To prepare the cytoplasmic and membrane fractions of RBCs, 1 ml of packed cells was mixed with 4 ml of distilled water and placed on ice for 2 min. Then, 4 ml of distilled water was added, and the mixture was centrifuged at 3200 × g for 10 min at 4 °C. The supernatant (8 ml) was carefully aspirated, mixed with 0.8 ml of 1 m HEPES, pH 7.4, and centrifuged again to remove remaining RBC ghosts and membranes. The supernatant obtained after the second centrifugation represents the cytoplasmic fraction of RBC diluted 1:9 in 100 mm HEPES buffer, pH 7.4. The sediment of RBC ghosts obtained after centrifugation of RBC lysates (1 ml) was diluted with 8 ml of distilled water and centrifuged at 3,200 × g for 10 min at 4 °C. The supernatant was removed, distilled water was added to a total volume of 9 ml, and 1 ml of 1 m HEPES, pH 7.4, was added. This mixture represents RBC membrane fraction corresponding to a 1:9 dilution of RBC with 100 mm HEPES buffer, pH 7.4. Cytoplasmic and membrane fractions of RBC were used immediately or were stored at −80 °C until further use.
Production of RBCs Containing MetHb
A suspension of RBCs (10% (v/v in PBS containing 5 mm glucose) was incubated with NaNO2 (20 mm for 60 min or 50 mm for 10 min) at 25 °C. Then, RBC suspension was diluted by the addition of 20 volumes of PBS followed by centrifugation (10 min at 2000 × g). The washing procedure was repeated three times resulting in an NaNO2 concentration of <6 μm. The RBCs were resuspended in PBS containing 5 mm glucose (to give 10% v/v) and used for anaerobic H2S clearance analysis at 25 °C. A solution of NaNO2 (5 μm) in PBS was used as a blank.
H2S Production by RBC Lysate
The rate of H2S production by RBC lysate was monitored as described previously (25). Briefly, 100 μl of RBC lysate was incubated with the chosen substrate in a total volume of 0.5 ml of 100 mm HEPES, pH 7.4, in a 20-ml polypropylene syringe barrel. The syringe was sealed with a plunger. The syringe headspace was flushed five times with N2 using an attached three-way stopcock and then filled with N2 to a total volume (liquid + gas) of 20 ml. The syringe then was incubated at 37 °C with rocking. At the desired time points, 200-μl aliquots were collected from the gas phase and injected into a gas chromatograph equipped with a model 355 sulfur chemiluminescence detector (Agilent) for H2S analysis as described (25). The reaction mixture contained 10 mm cysteine for CSE activity (26), 10 mm cysteine + 10 mm d,l-homocysteine for CBS activity (26), and 0.5 mm 3-mercaptopyruvate + 20 mm DTT to monitor MST activity (23).
Western Blot Analysis of H2S-producing Enzymes in RBCs
Expression of CBS, CSE, and MST in RBC was assessed by Western blot analysis using custom-made primary antibodies as described previously (26).
Sulfide Clearance Assay
The kinetics of H2S clearance was monitored as described previously (25). Briefly, 0.5 ml of the sample (RBC lysate, RBC cytoplasmic or membrane fraction, or MetHb solution) was placed inside a 20-ml polypropylene syringe barrel, and the syringe was sealed with a plunger. For anaerobic assays, the syringe headspace was flushed five times with N2 and then filled with N2 to a total volume (liquid + gas) of 10 ml. Then, 10 ml of 40 ppm H2S in N2 was added to the syringe to give a final volume of 20 ml. For aerobic assays, the syringe headspace was filled with air to a total volume (liquid + gas) of 10 ml, and 10 ml of 40 ppm H2S in N2 was added, using a three-way stopcock, to give a final volume of 20 ml. The syringes were incubated at 25 °C with rocking, and 200-μl aliquots were collected from the gas phase and injected into the gas chromatograph at the desired times. The concentration of MetHb in 100 mm HEPES buffer, pH 7.4, was determined spectrophotometrically (ϵ405 nm = 179 m−1 cm−1).
Stopped-flow Spectroscopy
The kinetics of interaction between H2S and MetHb under anaerobic conditions were performed using an Applied Photophysics stopped-flow spectrophotometer (SX.MV18) placed inside an anaerobic chamber (Vacuum Atmospheres Co., Hawthorne, CA) filled with N2 containing ∼0.2–0.5 ppm O2. A solution of MetHb (2 μm before mixing in 100 mm HEPES buffer, pH 7.4) was mixed rapidly with various concentrations of Na2S in the same buffer. The pH dependence of the reaction was monitored under aerobic conditions using a Hi-Tech Scientific stopped-flow spectrophotometer (SF-61DX). MetHb (2.5 μm), prepared in 100 mm buffers with pH values ranging from 5.5 to 9.0, was rapidly mixed with 2 mm Na2S solutions prepared in the same buffers. Borate, Tris, HEPES, and citrate buffers were used for pH 9.0, 8.0, 7.4, and 6.0, respectively. Citrate was also used for pH 5.5. The kinetics of absorbance changes at 405 nm was monitored at 25 °C. The data were fitted to a single exponential function.
Product Analysis
MetHb (25 μm in 100 mm HEPES buffer, pH 7.4) was incubated at 25 °C under aerobic (air) or strictly anaerobic (N2) conditions in an anaerobic chamber (Vacuum Atmospheres Co.) in closed sample tubes with liquid:gas phase at 2:1. Samples lacking MetHb were used as controls. Na2S in 100 mm HEPES buffer, pH 7.4, was added to give the desired concentration (∼400–1600 μm), and samples were removed at the desired time points for HPLC or cyanolysis analyses as described below. Approximately 5–7% of the sample comprised thiosulfate and sulfite. At the end of the incubation, the low molecular weight fraction of the reaction mixture was separated using 0.5-ml centrifugal filters with a 10-kDa cutoff (Millipore), centrifuged for 6 min at 10,000 × g, and the filtrate was collected and used for cyanolysis analysis.
For HPLC analysis of products, the samples (45 μl) were mixed with 2.5 μl of 1 m Tris and 2.5 μl of 60 mm monobromobimane in dimethyl sulfoxide and incubated for 10 min at 25 °C. Then, 100 μl of metaphosphoric acid solution (16.8 mg/ml) was added, the sample was stirred and centrifuged (3 min at 13,000 × g), and the supernatant was separated and frozen until use. The samples were protected from light during the derivatization procedure. Samples were separated using a Zorbax Eclipse XDB-C18 column (5 μm, 4.6 × 150 mm, Agilent) with the following gradient and a flow rate of 1 ml min−1. Solution A contained 100 mm ammonium acetate, pH 4.75, and 10% methanol and Solution B contained 100 mm ammonium acetate, pH 4.75, and 90% methanol. The percentage of B increased as follows in the gradient: 0–10 min, linear 0 to 20%; 10–15 min, linear 20 to 50%; 15–20 min, isocratic 50%; 20–22 min, 50 to 100%; 22–27 min, isocratic 100%; 27–29 min, linear 100 to 0%; 29–35 min, isocratic 0%. Peaks were detected using excitation at 390 nm and fluorescence emission at 490 nm. The column was calibrated with known concentrations of sodium sulfide, sodium sulfite, and sodium thiosulfate.
Hot and cold cyanolysis was used to detect other catenated sulfur products (27). Briefly, for cold cyanolysis 0.5 ml of sample was mixed with 0.25 ml of solution containing 62.5 mm potassium cyanide and 125 mm ammonium hydroxide, and the mixture was incubated for 45 min at 25 °C. Then, 0.75 ml of Goldstein's reagent was added, the mixture was vortexed and centrifuged for 3 min at 13,000 × g, and absorbance of the supernatant was measured at 460 nm. Goldstein's solution is prepared by dissolving 1.25 g of Fe(NO3)3·9H2O in 12.5 ml water to which 13.1 ml of concentrated HNO3 and water to a final volume of 50 ml are added. A calibration curve was prepared using sodium thiocyanate of known concentrations.
For hot cyanolysis, the sample (0.5 ml) was mixed with 0.25 ml of a solution containing 200 mm potassium cyanide and 1 m ammonium hydroxide, and the mixture was incubated for 40 min at 99 °C. Then, the samples were centrifuged for 3 min at 13,000 × g, and the supernatant was mixed with an equal volume of ferric nitrate reagent (made by dissolving 5 g of Fe(NO3)3·9H2O in 15 ml water to which 10 ml of concentrated HNO3 and water to a final volume of 50 ml are added). The absorbance was measured at 460 nm. Solutions of sodium thiosulfate processed in the same way as samples were used for calibration. The sensitivity of the hot and cold cyanolysis method is ∼10 μm, and the assay was linear from 0.01 to 1 mm.
To probe the role, if any, of free cysteines in MetHb for sulfide oxidation, they were blocked with iodoacetamide by mixing MetHb (250 μm) in 100 mm Tris buffer, pH 8.0, and 10 mm iodoacetamide (prepared in the same buffer) followed by incubation for 1 h at 25 °C in the dark. Then, the sample was applied to a PD-10 desalting column (GE Healthcare), and MetHb was eluted with 100 mm HEPES buffer, pH 7.4. Iodoacetamide-treated MetHb was diluted to a concentration of 25 μm with 100 mm HEPES buffer, pH 7.4, and incubated aerobically for 1 h with 800 μm Na2S at 25 °C. Then, the level of cyanolyzable sulfur was measured using the cold cyanolysis method.
O2 Consumption Assay
O2 consumption was measured using an O2 electrode. For this assay, MetHb (25 μm) in 100 mm HEPES buffer, pH 7.4, at 25 °C was placed in a 1.5-ml Gilson-type chamber equipped with a Clark-type oxygen electrode and a magnetic stirrer. After stabilization of the background signal, a solution of Na2S in the same buffer was injected into the chamber, and O2 consumption was recorded using a chart recorder.
EPR Spectroscopy
Samples for EPR spectroscopy were prepared under both aerobic and strictly anaerobic conditions (in an anaerobic chamber) at 25 °C. Na2S was added to a 50 μm solution of MetHb in 100 mm HEPES buffer, pH 7.4, to give a final sulfide concentration of 1.2 mm. The reaction mixture (400 μl) was placed in an EPR tube and sealed with a rubber stopper. After 5 min, the sample was frozen in liquid N2. The EPR spectra were recorded at 14 K on a Bruker ESP 300E spectrometer equipped with an Oxford ITC4 temperature controller using the following settings: 5.00 G modulation amplitude, 100 kHz modulation frequency, 3500 G sweep width (centered at 2500 G), 9.387 GHz microwave frequency, and 0.104-milliwatt microwave power. A 10 mm copper sulfate solution was used as a standard to determine the concentration of low-spin ferric ion in samples.
MetHbS Preparation
Human HbS was dissolved in 100 mm sodium phosphate buffer, pH 7.4, to a final concentration of 250 μm. Sodium ferricyanide was added to a final concentration of 2 mm to fully convert the sample to the MetHbS form as confirmed by a shift in the Soret peak from 415 to 405 nm and broadening of the α and β peaks. Excess ferricyanide was removed by gel filtration using a Superdex 200 column, and the sample was then used for monitoring reactivity with sulfide as described above for normal MetHb.
Mass Spectrometric Analysis
Mass spectrometric analysis of low molecular weight fractions obtained after incubation of MetHb with sulfide was performed at a core facility (Department of Chemistry, University of Michigan). The samples were run on an Agilent 6520 Q-TOF LCMS system with a dual ESI ion source in the negative ion mode. A mobile phase containing 70% acetonitrile, 30% water and 0.1% formic acid was used with a flow rate was 0.4 ml min−1. The m/z range was 50 to m/z 3200, with a scan rate of 2 spectra per sec.
RESULTS
H2S Turnover in Human RBCs
To assess H2S production by RBCs, we examined the presence and activity of CBS, CSE, and MST. When human RBC lysates were exposed to the H2S-generating substrates for CBS (cysteine + homocysteine) or CSE (cysteine) (21, 22), H2S production was not observed. In contrast, in the presence of the MST substrate 3-mercaptopyruvate (3-MP in Equation 1, in which DTTred and DTTox are reduced and oxidized DTT, respectively), a robust rate of H2S production (10.8 ± 1.5 mmol h−1 (liter cells)−1) at 37 °C was observed.
Western blot analysis of RBC lysates revealed the presence of MST (Fig. 1A), which co-migrated with recombinant human MST. Although the upper band seen in RBC lysates is also observed in extracts from human cell lines (e.g. HepG2 and HEK293, not shown), the lower band is only seen in RBC lysate, and its identity is currently not known. In contrast, CBS and CSE were not detected in RBC lysates (Fig. 1A). These results establish the capacity of human RBCs to produce H2S via MST and raise the obvious question as to how it is cleared, which was examined next.
FIGURE 1.
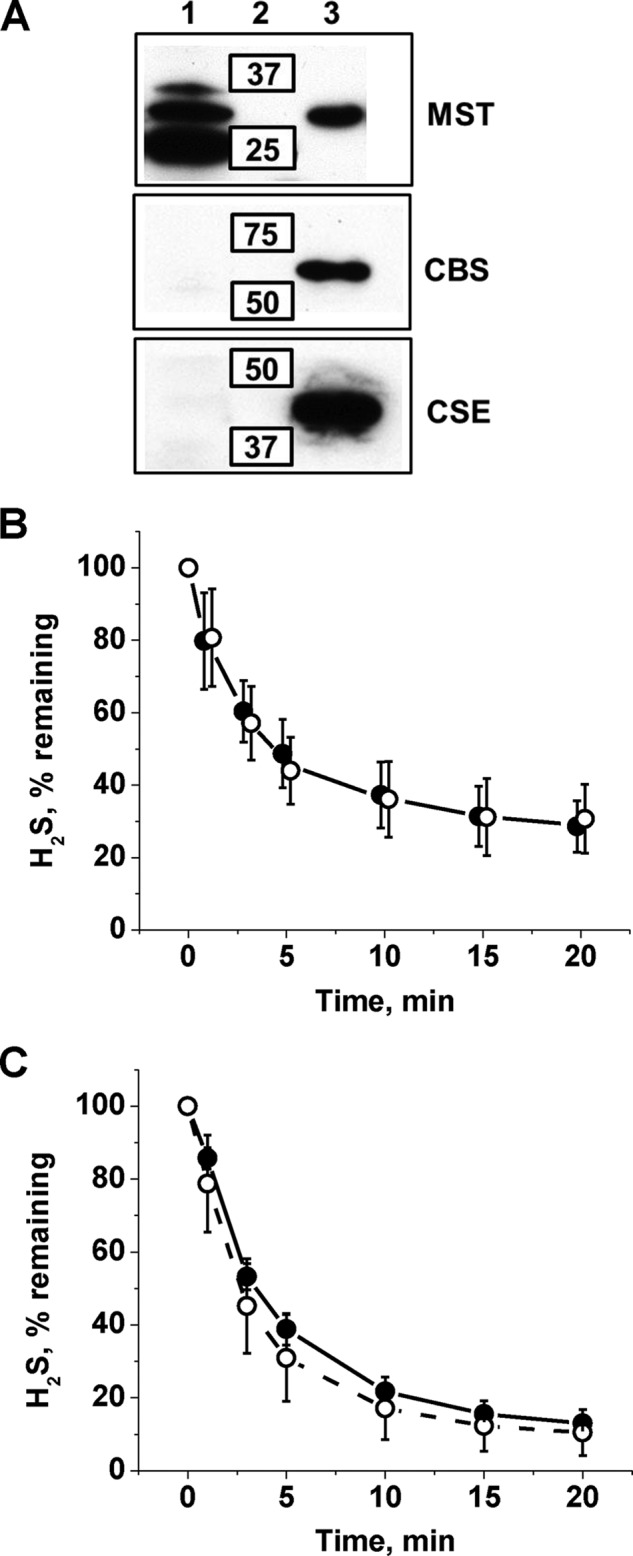
H2S metabolism in human RBCs. A, Western blot analysis of RBC samples (200 μg of Hb/lane) and human recombinant MST, CBS, and CSE standards indicate the presence of MST but not the other two H2S-generating enzymes. Lanes 1, 2, and 3 contain samples, molecular weight standards, and purified proteins, respectively. B and C, kinetics of H2S clearance by a 10% (v/v) suspension of human RBCs in PBS, pH 7.4, 25 °C (B) and by human MetHb (0.5 mg ml−1) in 100 mm HEPES, pH 7.4, 25 °C (C) under aerobic (–●–) or anaerobic conditions (–○–). The data presented in B and C represent the mean ± S.D. of three independent experiments.
The addition of H2S to a 10% (v/v) suspension of human RBCs resulted in its rapid disappearance under aerobic and anaerobic conditions (Fig. 1B) with a t½ of ∼14 s (normalizing for undiluted cell mass) and a rate constant of ∼3.0 min−1. Fractionation of RBC lysates into cytosolic and membrane components established that the cytosolic fraction houses the H2S clearance activity. Treatment of RBCs with sodium nitrite increased, whereas treatment with DTT decreased the H2S clearance rate (Fig. 2). Collectively, these results suggested a role for MetHb in H2S removal by RBCs. To test this hypothesis, a solution of 0.5 mg ml−1 MetHb (to simulate its presence at 1.6% of total Hb in a 10% RBC suspension) was tested and found to support an almost identical rate of H2S clearance as that of RBCs in suspension (Fig. 1C). In this experiment, the amount of sulfide (17.9 nmol) and ferric heme (16 nmol) was approximately equivalent. Hence, the observed clearance of H2S in these experiments and by RBCs in suspension is likely to represent its stoichiometric binding to MetHb.
FIGURE 2.
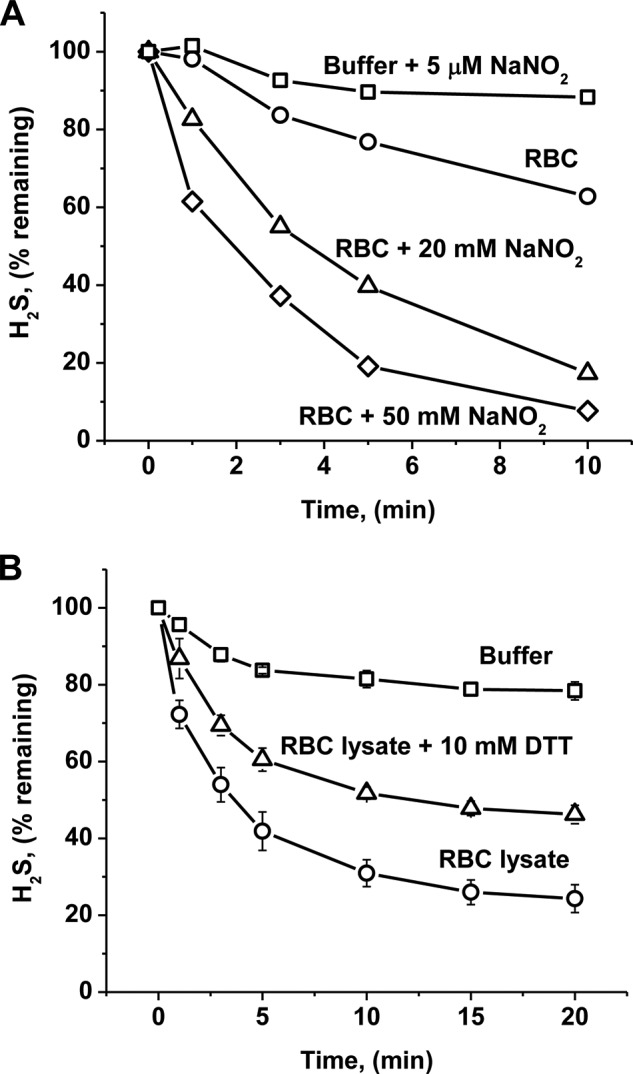
Modulation of H2S binding kinetics by sodium nitrate or DTT. A, an RBC suspension (10% (v/v) in PBS containing 5 mm glucose) was used to monitor clearance of 17.9 nmol of H2S at 25 °C under anaerobic conditions. The RBCs were untreated (○), pretreated with 20 mm NaNO2 for 60 min (▵), or with 50 mm NaNO2 for 10 min (◇). Excess NaNO2 was removed by extensive washing prior to the start of the experiment as described under “Experimental Procedures” and was present at <3 nmol in the reaction mixture. PBS with 5 μm NaNO2 was used as a blank (□). B, RBC lysate (1:9 v/v in 100 mm HEPES buffer, pH 7.4, 25 °C) was treated with 10 mm DTT at 25 °C under anaerobic conditions. The symbols represent buffer only (□), RBC lysate (○), and RBC lysate with 10 mm DTT (▵). Data are the mean ± S.D. of four independent experiments with RBCs from four different donors.
Interaction of H2S with MetHb
The binding of H2S with MetHb resulted in a red shift in the Soret band from 405 to 423 nm and the appearance of α,β absorption bands at 577 and 541 nm, respectively (Fig. 3, A and B). Identical spectral changes were observed under aerobic and anaerobic conditions. The initially formed 423 nm absorbing species was tentatively identified as ferric sulfide Hb. Its formation was dependent on sulfide concentration, yielding a KD of 14 ± 2 μm (Fig. 3C). The dependence of kobs on the total sulfide concentration (Fig. 3C, inset), yielded a kon for the association of sulfide with MetHb of 3.2 × 10³ ± 100 m−1 s−1, koff of 0.053 ± 0.008 s−1, and a KD of 17 ± 2 μm (pH 7.4 at 37 °C). The rate of formation of the 423 nm species was inversely proportional to pH, decreasing with an increasing pH between 5.5 and 9.0 (Fig. 3D). The pH dependence suggests that H2S rather than the sulfide anion (HS−) initially interacts with MetHb. The KD and kon values represent the upper limits, as the H2S concentration at pH 7.4 is ∼20% of the total sulfide concentration.
FIGURE 3.

Spectral changes associated with interaction of human MetHb with H2S. A, Na2S (40 μm) was added to 2.5 μm human MetHb (10 μm heme) in 100 mm HEPES, pH 7.4, at 25 °C under aerobic conditions, and successive spectra were recorded at 1, 2, 3, and 30 min (red line), respectively. The inset shows the α/β peaks on an expanded scale. B, spectral changes observed upon mixing 2.5 μm MetHb at heme:Na2S varying from 1:1 to 1:6. The conditions were the same as described in A, and each spectrum was recorded 3 min after the addition of Na2S. The initial MetHb spectrum has a peak at 405 nm, and the final spectra (in red) were obtained in the presence of a 4–6-fold excess of Na2S over heme and are superimposable. The inset shows the α/β peaks on an expanded scale. C, change in the absorbance of MetHb (1 μm after mixing) in 100 mm HEPES, pH 7.4, at 405 nm on the total sulfide concentration (0–200 μm after mixing) at 37 °C. The symbols and lines represent the experimental points and hyperbolic fit to the data, respectively. The inset shows the dependence of kobs on total [Na2S]. The data were obtained using stopped-flow spectrometry under anaerobic conditions. D, stopped flow kinetic analysis of the pH dependence of Na2S binding to MetHb. MetHb (2.5 μm) was prepared in buffers with different pH values as described under “Experimental Procedures” and mixed aerobically with 2 mm Na2S (before mixing) prepared in the same buffers at 25 °C. The pH values are indicated on the curves. E, long-term effects of Na2S interaction with MetHb under aerobic conditions. Na2S (60 μm final concentration) was added to MetHb (2.5 μm, black) in 100 mm HEPES, pH 7.4, at 25 °C, and the spectrum was recorded after 15 min (gray) and after 47 h (red), during which time the sample was kept in a sealed cuvette in the dark. The inset shows the α/β peaks on an expanded scale. F, conversion of the 423 nm Hb species to oxyhemoglobin (red) in the presence of recombinant human MSR (0.2 μm) and NADPH (100 μm). The 423 nm Hb species was obtained by treatment of 2.5 μm MetHb with 30 μm Na2S in 100 mm HEPES, pH 7.4, under aerobic conditions for 15 min at 25 °C. The first spectrum was obtained immediately after the addition of NADPH and MSR, and subsequent spectra were recorded after 10, 30, 60, and 120 min and 5 h. The arrows show the direction of spectral changes with time. The inset shows the α/β peaks on an expanded scale.
The 423 nm spectrum was stable for ∼1 h but changed slowly over 48 h during which the Soret band shifted to 407 nm and small changes at wavelengths of >470 nm were observed (Fig. 3E). The addition of the human diflavin MSR and NADPH to ferric sulfide Hb resulted in its conversion to oxyhemoglobin (oxy-Hb) with a Soret peak at 415 nm (Fig. 3F). A similar conversion was observed upon the addition of C. kluyveri diaphorase and NADH (not shown). H2S release was not observed during the enzymatic conversion of the 423 nm Hb species to oxy-Hb, suggesting that H2S was oxidized. These results suggest that the flavoprotein, methemoglobin reductase can also convert the 423 nm Hb species to oxy-Hb. Well known allosteric modulators of ferrous Hb that influence oxygen affinity, e.g. 2,3-diphosphoglycerate and inositol hexaphosphate, did not affect the H2S binding or clearance kinetics by MetHb (Fig. 4, A–C). However, a small decrease in the amplitude of the absorbance change at 405 nm was seen in the presence of inositol hexaphosphate (Fig. 4B), the origin of which is not known. Our results are consistent with binding of H2S to MetHb versus oxy-Hb. Similar kinetics and spectral changes were observed when the interaction of H2S with sickle cell (Fig. 4, D and E) or normal MetHb was monitored.
FIGURE 4.

Effects of 2,3-diphosphoglycerate (2,3-DPG), inositol hexaphosphate (IHP), and the sickle cell mutation, HbS, on the interaction of H2S with MetHb. A and B, kinetics of decrease in MetHb concentration in 100 mm HEPES buffer, pH 7.4, 25 °C (detected at 405 nm) after the addition of 50 μm Na2S to an aerobic solution of 2.5 μm MetHb with (red) or without (black) 5 mm 2,3-diphosphoglycerate (A) or 5 mm inositol hexaphosphate (B). C, clearance of H2S by MetHb (1 mg/ml) in aerobic 100 mm HEPES buffer, pH 7.4, in the absence (○) or presence of 5 mm 2,3-diphosphoglycerate (□) or 5 mm inositol hexaphosphate (▵) at 25 °C. The data represent the average of two experiments. D, H2S clearance by MetHbS (1 mg/ml) in 100 mm HEPES buffer, pH 7.4, at 25 °C. E, spectral changes elicited by binding of 0–60 μm Na2S to 2.5 μm MetHbS in 100 mm HEPES buffer, pH 7.4, 25 °C. The final spectrum is shown in red and does not change with additional Na2S aliquots.
Products of H2S Oxidation by MetHb
The addition of an excess of H2S to MetHb heme results in all the H2S being consumed in 30–60 min under aerobic conditions (Fig. 5A). Under these conditions, thiosulfate accumulates with similar kinetics (Fig. 5B). The presence of thiosulfate was established by HPLC analysis of the monobromobimane derivative (Fig. 6A), by hot cyanolysis of the filtrate obtained using a 10-kDa cutoff filtration device (not shown) and by mass spectrometric analyses (Fig. 6, B and C). The amount of thiosulfate recovered corresponded to ∼35% of the H2S present initially (800 μm). An additional 30–40% of the sulfur, recovered as cyanolyzable sulfur that was tightly bound to Hb, could be detected by cold cyanolysis of the entire reaction mixture (Fig. 5C) The amount of cyanolyzable sulfur varied with the H2S:heme ratio and was not observed in control samples lacking MetHb or Na2S. Cold cyanolysis of the filtrate obtained using a 10-kDa cutoff filter demonstrated the absence of free HSSH and polysulfides in the reaction mixture. To determine whether the polysulfide (i.e. cyanolyzable sulfur) was protein-bound, mass spectrometric analysis of Hb from the reaction mixture was performed. However, evidence for polysulfide (i.e. Hb-S-(S)n-SH)-modified Hb was not obtained. Furthermore, pretreatment of MetHb with iodoacetamide to block reactive and accessible cysteines did not prevent the formation of polysulfides, consistent with their formation on the heme rather than on a cysteine residue on the protein. Approximately 12% of the sulfur remained bound to the heme iron, because cold cyanolysis releases up to the penultimate sulfur atom in a chain. Thus, the thiosulfate and iron-bound polysulfide accounted for ∼77–87% of the sulfur introduced into the reaction mixture as H2S. Consumption of H2S was accompanied by O2 consumption, which was detected only after the H2S:heme stoichiometry of the sample exceeded 2:1 (Fig. 5D).
FIGURE 5.

H2S oxidation by MetHb. A and B, kinetics of H2S disappearance (A) and thiosulfate accumulation (B) following the addition of varying initial concentrations of Na2S to 100 mm HEPES buffer, pH 7.4 (filled symbols and dashed lines), or to 25 μm human MetHb at 25 °C (open symbols and solid lines) under aerobic conditions. The heme:Na2S ratios are indicated. C, kinetics of polysulfide accumulation in the reaction mixtures described in A and B. D, kinetics of O2 consumption in a solution containing 25 μm MetHb in 100 mm HEPES buffer, pH 7.4, at 25 °C following the addition of Na2S aliquots (indicated by arrows), resulting in heme:sulfide stoichiometry ranging from 1:1 to 1:3. E and F, H2S concentration remaining after a 1-h incubation of 800 μm Na2S at 25 °C in 100 mm HEPES buffer, pH 7.4, ± 25 μm MetHb (E) and concentration of sulfite and thiosulfate under anaerobic conditions (F).
FIGURE 6.

HPLC and MS analysis of sulfur-containing compounds. A, the upper chromatogram indicates the elution times for the monobromobimane derivatives of sodium sulfite (peak 1), sodium thiosulfate (peak 2), and sodium sulfide (peak 4). Peak 3 corresponds to monobromobimane. The middle chromatogram represents the control reaction mixture containing 100 mm HEPES buffer, pH 7.4, and 1 mm Na2S following a 15-min aerobic incubation at 25 °C. The bottom chromatogram was obtained following incubation of MetHb (25 μm) under the same conditions as the control sample. Note the significant decrease in the sulfide peak (4) and increase in the thiosulfate peak (2) in the presence of MetHb. B and C, ESI-mass spectrometric analysis of low molecular weight fractions of samples in 20 mm ammonium carbonate buffer, pH 7.4, containing 25 μm MetHb alone (B) or MetHb plus 1 mm Na2S (C). The peak with m/z = 112.938 (indicated by an arrow) corresponds to HS2O3−. The m/z = 134.92 peak could represent the monosodium salt of HS2O3−. The low molecular fractions were obtained by centrifugation using Amicon Ultra 0.5-ml centrifugal filters with a 10-kDa cutoff.
Under anaerobic conditions, the decrease in free H2S concentration corresponds to the heme concentration, consistent with H2S binding to the iron but not being oxidized further (Fig. 5E). A small accumulation of thiosulfate was observed under anaerobic conditions, which was accompanied by an equivalent decrease in the concentration of sulfite present as a contaminant in Na2S (Fig. 5F).
EPR Characterization of H2S Oxidation by MetHb
The EPR spectrum of MetHb shows the presence of high-spin ferric iron with g = 5.83 G (Fig. 7A). Treatment with excess H2S under aerobic conditions results in the appearance of a low-spin rhombic signal with g values of 2.51, 2.25, and 1.86 G representing 65 μm spin or ∼33% of the initial heme concentration (Fig. 7B). The closely spaced g values is typical of thiolate-ligated hemes, and the EPR spectrum is very similar to those reported for cytochrome c variants engineered to have a cysteine ligand (28). Treatment with excess H2S under anaerobic conditions also resulted in the disappearance of the high-spin signal and the appearance of the low-spin signal representing 102 μm spin concentration or 51% of the initial heme iron concentration (Fig. 7C). These results are consistent with the conversion of high-spin ferric MetHb to low-spin ferric sulfide MetHb followed by further conversion to diamagnetic species.
FIGURE 7.
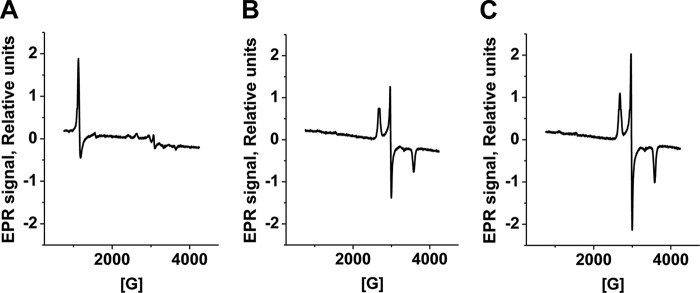
EPR spectra of MetHb treated with sulfide. Shown are EPR spectra of samples containing 50 μm MetHb in 100 mm HEPES, pH 7.4 (A), or after a 5-min incubation with 1200 μm Na2S under aerobic (B) or anaerobic (C) conditions at 25 °C. The EPR settings are described under “Experimental Procedures.”
DISCUSSION
Curiously, despite the large volume of blood (∼5 liters in an adult human) and the sheer abundance of RBCs with their potential to influence systemic H2S metabolism, the mechanism of sulfide homeostasis in the circulatory compartment is unknown. The problem is particularly intriguing in light of the capacity of RBCs for generating H2S and the absence of the canonical mitochondrial sulfide oxidation pathway in these cells. In this study, we have addressed this metabolic conundrum by establishing that RBCs produce H2S via the action of MST and clear sulfide via MetHb-catalyzed oxidation of H2S to thiosulfate and polysulfides (Fig. 8).
FIGURE 8.
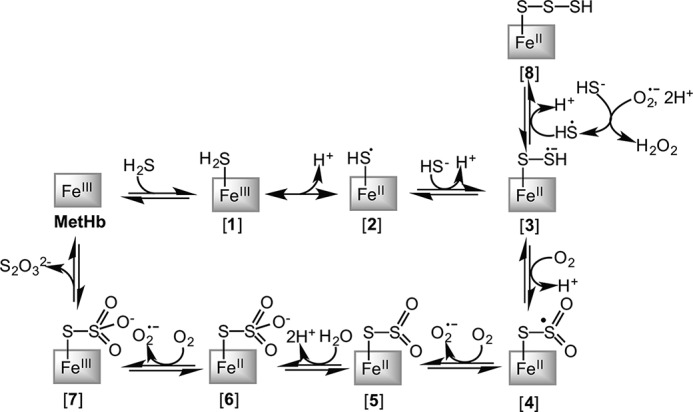
Scheme showing the postulated mechanism for the MetHb-dependent conversion of H2S to thiosulfate and heme iron-bound polysulfides.
We propose that the binding of sulfide to MetHb results in the formation of H2S-FeIII Hb (in the presence of NADPH and flavin oxidoreductases, the initially formed ferric sulfide hemoglobin is converted to oxy-Hb [1] (Fig. 8)). As observed with the Lucina pectinata ferric Hb, the rate constant for binding of H2S to human MetHb increases with decreasing pH (Fig. 3D), suggesting that H2S rather than the more abundant HS− initially binds to heme (18). We propose that [1] is in equilibrium with HS•-FeII Hb [2]. The latter is also proposed as an intermediate for the sulfide-carrying Hb from L. pectinata (29), and its feasibility is supported by model studies showing that HS− ligation to ferric porphyrinate generates the corresponding FeII derivative (30). In principle, the ferrous heme-bound HS• radical could react with O2 to form SO2⨪ (rate constant in solution is 7.5 × 10⁹ m−1 s−1 at pH 7.0 and 37 °C (31)). However, this reaction appears to be prevented in the heme pocket, because O2 consumption is not seen until the H2S:heme stoichiometry is 2:1 (Fig. 5D). Alternatively, the reaction of the second mole of sulfide with [2] might be more rapid in the heme pocket than its reaction with O2. However, in solution, the reaction of the sulfhydryl radical anion (S⨪) with sulfide anion (HS−) to generate the hydrodisulfide radical anion (HSS•2−) is also fast, with a kon = 5.4 × 10⁹ m−1 s−1 at pH 7.0 and 37 °C (32). Hence, we propose that a second mol of sulfide reacts with the HS•-FeII Hb radical [2] to generate the HSS⨪-FeII radical anion species [3]. Oxygenation of the ferrous hydrodisulfide radical anion [3] would generate the sulfur dioxide radical derivative [4], which could be oxidized to give [5] and O2⨪. Oxygenation of the outer sulfur atom of [3] would explain the need for the second equivalent of sulfide prior to oxygen consumption. As noted previously, the rate constant for oxygenation of the sulfide radical anion at pH 7.0 and 37 °C is 7.5 × 10⁹ m−1 s−1 (31). Hydrolysis of [5] yields the thiosulfate [6], which following oxidation would yield the ferric product complex [7]. Dissociation of thiosulfate from [7] regenerates MetHb.
Ferrous polysulfides [8] can be formed via recombination of the radical anion intermediate [3] with a sulfhydryl radical generated via reaction of sulfide with O2⨪. The rate constant for this oxidation reaction is 200 m−1 s−1 at pH 7.0 and 37 °C (32). The H2O2 generated in this reaction could potentially react with sulfide generating sulfenic acid (kon = 0.73 m−1 s−1 in solution (32)), which could react with [3] (estimated kon = 105 m−1 s−1 ((32)) leading to chain elongation. The stoichiometry of the cyanolyzable sulfur recovered under H2S turnover conditions indicates that the chain length increases in proportion to the H2S concentration and up to six sulfur atoms are bound to the heme iron when heme:H2S is 1:16. In studies on protection from sulfide toxicity in mice with nitrite-induced methemoglobinemia, a ratio of 3 mol of H2S were found to be inactivated per mol of MetHb heme and interpreted as evidence for H2S binding to additional non-heme sites on MetHb (16). In light of our results, the observed stoichiometry can be interpreted as evidence for a mixture of thiosulfate and polysulfide generated per mol of H2S cleared in sulfide-treated mice.
The proposed MetHb-catalyzed oxidation chemistry has precedence in the bacterial leaching of metal sulfides by catalytic ferric ion (33). The primary sulfur product formed during leaching of pyrite (FeS2) or molybdenite (MoS2) by Thiobacillus thiooxidans is thiosulfate, whereas polysulfides are generated during bioleaching of sphalerite (ZnS) and galena (PbS) (33). An intermediate ferric-thiosulfate complex is observed in support of the proposed product complex [7] in our sulfide oxidation scheme (Fig. 8). In contrast, the abiotic sulfide oxidation that accompanies reductive dissolution of iron oxides in sulfidic sediments and euxinic basins predominantly yields elemental sulfur (34). We speculate that RBCs clear H2S by converting sulfide to thiosulfate. Polysulfide products are more likely to be formed when the flux of H2S is high and/or O2 is limiting. In solution, the concentration of sulfide and O2 determine the distribution of the oxidation products; thiosulfate predominates when the sulfide concentration is low, whereas polysulfides and elemental sulfur are favored when the sulfide concentration is high (35).
At 1–3% of total Hb, MetHb is present at a concentration of ∼25–75 μm in blood (corresponding to 100–300 μm ferric heme). Because RBCs occupy ∼50% of blood volume, they are likely to play a significant role in sequestering H2S by binding and in oxidizing H2S when levels rise. As permeation of the lipid bilayer by H2S is facile and not predicted to require transporters (36), MetHb could also play an important role in clearing H2S produced by other cell types and diffusing into RBCs from blood, thus buffering H2S levels in circulation. We speculate that reducing equivalents from NADPH can be transferred via MetHb reductase to release heme iron-bound polysulfides to regenerate oxy-Hb, as demonstrated with MSR (Fig. 3F). Polysulfides, which are inherently more reactive than H2S, are increasingly considered to be important for mediating the cellular effects of H2S (37). Additionally, thiosulfate has been shown to attenuate angiotensin II-induced hypertensive cardiac disease (38) and acute lung injury (39), and a role for thiosulfate, if any, in signaling remains to be addressed. Our study demonstrates a route for Hb-dependent thiosulfate and polysulfide biogenesis in mammals and suggests the possibility that additional hemeproteins might be involved in the generation of these reactive sulfur species in other tissues.
Acknowledgments
We thank the following colleagues at the University of Michigan: Dr. David Ballou for assistance with the stopped-flow and oxygen consumption analyses; Drs. Stephen Ragsdale, Dariusz Sliwa, and Mehmet Can for help with the EPR analysis; and Dr. Carmen Gherasim for providing methionine synthase reductase.
This work was supported, in whole or in part, by National Institutes of Health Grant GM112455 (to R. B.). This work was also supported by American Heart Association Grant 14POST18760003 (to P. K. Y.).
- CBS
- cystathionine β-synthase
- H2S
- hydrogen sulfide
- CSE
- γ-cystathionase
- MetHb
- methemoglobin
- MSR
- methionine synthase reductase
- MST
- mercaptopyruvate sulfurtransferase
- oxy-Hb
- oxyhemoglobin.
REFERENCES
- 1. Theissen U., Hoffmeister M., Grieshaber M., Martin W. (2003) Single eubacterial origin of eukaryotic sulfide:quinone oxidoreductase, a mitochondrial enzyme conserved from the early evolution of eukaryotes during anoxic and sulfidic times. Mol. Biol. Evol. 20, 1564–1574 [DOI] [PubMed] [Google Scholar]
- 2. Cuevasanta E., Denicola A., Alvarez B., Möller M. N. (2012) Solubility and permeation of hydrogen sulfide in lipid membranes. PloS One 7, e34562. [DOI] [PMC free article] [PubMed] [Google Scholar]
- 3. Riahi S., Rowley C. N. (2014) Why can hydrogen sulfide permeate cell membranes? J Am. Chem. Soc. 136, 15111–15113 [DOI] [PubMed] [Google Scholar]
- 4. Kimura H. (2010) Hydrogen sulfide: from brain to gut. Antioxid. Redox Signal. 12, 1111–1123 [DOI] [PubMed] [Google Scholar]
- 5. Kabil O., Vitvitsky V., Banerjee R. (2014) Sulfur as a signaling nutrient through hydrogen sulfide. Ann. Rev. Nutr. 34, 171–205 [DOI] [PMC free article] [PubMed] [Google Scholar]
- 6. Kabil O., Banerjee R. (2014) Enzymology of H2S biogenesis, decay and signaling. Antioxid. Redox Signal. 20, 770–782 [DOI] [PMC free article] [PubMed] [Google Scholar]
- 7. Kabil O., Motl N., Banerjee R. (2014) H2S and its role in redox signaling. Biochim. Biophys. Acta 1844, 1355–1366 [DOI] [PMC free article] [PubMed] [Google Scholar]
- 8. King A. L., Polhemus D. J., Bhushan S., Otsuka H., Kondo K., Nicholson C. K., Bradley J. M., Islam K. N., Calvert J. W., Tao Y. X., Dugas T. R., Kelley E. E., Elrod J. W., Huang P. L., Wang R., Lefer D. J. (2014) Hydrogen sulfide cytoprotective signaling is endothelial nitric oxide synthase-nitric oxide-dependent. Proc. Natl. Acad. Sci. U.S.A. 111, 3182–3187 [DOI] [PMC free article] [PubMed] [Google Scholar]
- 9. Valentine W. N., Frankenfeld J. K. (1974) 3-Mercaptopyruvate sulfurtransferase (EC 2.8.1.2): a simple assay adapted to human blood cells. Clin. Chim. Acta 51, 205–210 [DOI] [PubMed] [Google Scholar]
- 10. Ogasawara Y., Ishii K., Tanabe S. (2002) Enzymatic assay of γ-cystathionase activity using pyruvate oxidase-peroxidase sequential reaction. J. Biochem. Biophys. Methods 51, 139–150 [DOI] [PubMed] [Google Scholar]
- 11. Nicholls P., Kim J. K. (1982) Sulphide as an inhibitor and electron donor for the cytochrome c oxidase system. Can. J. Biochem. 60, 613–623 [DOI] [PubMed] [Google Scholar]
- 12. Hildebrandt T. M., Grieshaber M. K. (2008) Three enzymatic activities catalyze the oxidation of sulfide to thiosulfate in mammalian and invertebrate mitochondria. FEBS J. 275, 3352–3361 [DOI] [PubMed] [Google Scholar]
- 13. Hoppe-Seyler F. (1983) Ueber die chemischen und optischen Eigenschaften des Blutfarbstoffs. Zentbl. Med. Wiss. 1, 433–434 [Google Scholar]
- 14. Nichol A. W., Hendry I., Morell D. B. (1968) Mechanism of formation of sulphhaemoglobin. Biochim. Biophys. Acta 156, 97–108 [DOI] [PubMed] [Google Scholar]
- 15. Keilin D. (1933) On the combination of methaemoglobin with H2S. Proc. R. Soc. Lond. B Biol. Sci. 113, 393–404 [Google Scholar]
- 16. Smith R. P., Gosselin R. E. (1966) On the mechanism of sulfide inactivation by methemoglobin. Toxicol. Appl. Pharmacol. 8, 159–172 [DOI] [PubMed] [Google Scholar]
- 17. Sorbo B. (1956) On the formation of thiosulfate and thiosulfonates in higher animals. Biochim. Biophys. Acta 21, 393. [DOI] [PubMed] [Google Scholar]
- 18. Kraus D. W., Wittenberg J. B., Lu J. F., Peisach J. (1990) Hemoglobins of the Lucina pectinata/bacterial symbiosis. I. Molecular properties, kinetics, and equilibria of reactions with ligands. J. Biol. Chem. 265, 16054–16059 [PubMed] [Google Scholar]
- 19. Pietri R., Lewis A., León R. G., Casabona G., Kiger L., Yeh S. R., Fernandez-Alberti S., Marden M. C., Cadilla C. L., López-Garriga J. (2009) Factors controlling the reactivity of hydrogen sulfide with hemeproteins. Biochemistry 48, 4881–4894 [DOI] [PMC free article] [PubMed] [Google Scholar]
- 20. Taoka S., Ohja S., Shan X., Kruger W. D., Banerjee R. (1998) Evidence for heme-mediated redox regulation of human cystathionine β-synthase activity. J. Biol. Chem. 273, 25179–25184 [DOI] [PubMed] [Google Scholar]
- 21. Singh S., Padovani D., Leslie R. A., Chiku T., Banerjee R. (2009) Relative contributions of cystathionine β-synthase and γ-cystathionase to H2S biogenesis via alternative trans-sulfuration reactions. J. Biol. Chem. 284, 22457–22466 [DOI] [PMC free article] [PubMed] [Google Scholar]
- 22. Chiku T., Padovani D., Zhu W., Singh S., Vitvitsky V., Banerjee R. (2009) H2S biogenesis by cystathionine γ-lyase leads to the novel sulfur metabolites, lanthionine and homolanthionine, and is responsive to the grade of hyperhomocysteinemia. J. Biol. Chem. 284, 11601–11612 [DOI] [PMC free article] [PubMed] [Google Scholar]
- 23. Yadav P. K., Yamada K., Chiku T., Koutmos M., Banerjee R. (2013) Structure and kinetic analysis of H2S production by human mercaptopyruvate sulfurtransferase. J. Biol. Chem. 288, 20002–20013 [DOI] [PMC free article] [PubMed] [Google Scholar]
- 24. Olteanu H., Banerjee R. (2001) Human methionine synthase reductase, a soluble P-450 reductase-like dual flavoprotein, is sufficient for NADPH-dependent methionine synthase activation. J. Biol. Chem. 276, 35558–35563 [DOI] [PubMed] [Google Scholar]
- 25. Vitvitsky V., Kabil O., Banerjee R. (2012) High turnover rates for hydrogen sulfide allow for rapid regulation of its tissue concentrations. Antioxid. Red. Signal. 17, 22–31 [DOI] [PMC free article] [PubMed] [Google Scholar]
- 26. Kabil O., Vitvitsky V., Xie P., Banerjee R. (2011) The quantitative significance of the transsulfuration enzymes for H2S production in murine tissues. Antioxid. Redox Signal. 15, 363–372 [DOI] [PMC free article] [PubMed] [Google Scholar]
- 27. Wood J. L. (1987) Sulfane sulfur. Methods Enzymol. 143, 25–29 [DOI] [PubMed] [Google Scholar]
- 28. Zhong F., Lisi G. P., Collins D. P., Dawson J. H., Pletneva E. V. (2014) Redox-dependent stability, protonation, and reactivity of cysteine-bound heme proteins. Proc. Natl. Acad. Sci. U.S.A. 111, E306–E315 [DOI] [PMC free article] [PubMed] [Google Scholar]
- 29. Pietri R., Román-Morales E., López-Garriga J. (2011) Hydrogen sulfide and hemeproteins: knowledge and mysteries. Antioxid. Redox Signal. 15, 393–404 [DOI] [PMC free article] [PubMed] [Google Scholar]
- 30. Pavlik J. W., Noll B. C., Oliver A. G., Schulz C. E., Scheidt W. R. (2010) Hydrosulfide (HS-) coordination in iron porphyrinates. Inorg. Chem. 49, 1017–1026 [DOI] [PMC free article] [PubMed] [Google Scholar]
- 31. Carballal S., Trujillo M., Cuevasanta E., Bartesaghi S., Möller M. N., Folkes L. K., García-Bereguiaín M. A., Gutiérrez-Merino C., Wardman P., Denicola A., Radi R., Alvarez B. (2011) Reactivity of hydrogen sulfide with peroxynitrite and other oxidants of biological interest. Free Radic. Biol. Med. 50, 196–205 [DOI] [PubMed] [Google Scholar]
- 32. Das T. N., Huie R. E., Neta P., Padmaja S. (1999) Reduction potential of the sulfhydryl radical: pulse radiolysis and laser flash photolysis studies of the formation and reactions of •SH and HSSH⨪ in aqueous solutions. J. Phys. Chem. A 103, 5221–5226 [Google Scholar]
- 33. Schippers A., Sand W. (1999) Bacterial leaching of metal sulfides proceeds by two indirect mechanisms via thiosulfate or via polysulfides and sulfur. Appl. Environ. Microbiol. 65, 319–321 [DOI] [PMC free article] [PubMed] [Google Scholar]
- 34. Yao W., Millero F. J. (1996) Oxidation of hydrogen sulfide by hydrous Fe(III) oxides in seawater. Mar. Chem. 52, 1–16 [Google Scholar]
- 35. Chen K. Y., Morris J. C. (1972) Kinetics of oxidation of aqueous sulfide by O2. Environ. Sci. Technol. 6, 529–537 [Google Scholar]
- 36. Mathai J. C., Missner A., Kügler P., Saparov S. M., Zeidel M. L., Lee J. K., Pohl P. (2009) No facilitator required for membrane transport of hydrogen sulfide. Proc. Nat.l Acad. Sci. U.S.A. 106, 16633–16638 [DOI] [PMC free article] [PubMed] [Google Scholar]
- 37. Kimura H. (2015) Signaling of hydrogen sulfide and polysulfides. Antioxid. Redox Signal. 22, 347–349 [DOI] [PMC free article] [PubMed] [Google Scholar]
- 38. Snijder P. M., Frenay A. S., de Boer R. A., Pasch A., Hillebrands J., Leuvenink H. G., van Goor H. (June 24, 2014) Exogenous administration of thiosulfate, a donor of hydrogen sulfide, attenuates angiotensin II-induced hypertensive heart disease in rats. Br. J. Pharmacol. 172, 1494–1504 [DOI] [PMC free article] [PubMed] [Google Scholar]
- 39. Sakaguchi M., Marutani E., Shin H. S., Chen W., Hanaoka K., Xian M., Ichinose F. (2014) Sodium thiosulfate attenuates acute lung injury in mice. Anesthesiology 21, 1248–1257 [DOI] [PMC free article] [PubMed] [Google Scholar]