

Background: Drug resistance is a common problem in cancer chemotherapy.
Results: Transcriptomic and metabolomic data show that resistant leukemia cells exhibit reduced glutamine dependence, enhanced glucose dependence, and altered fatty acid metabolism.
Conclusion: The metabolism of resistant leukemia cells is fundamentally rewired.
Significance: Understanding the metabolic cost of resistance can lead to novel therapeutic strategies.
Keywords: β-Oxidation, Drug Resistance, Glutamine, Glycolysis, Leukemia, Mass Spectrometry (MS), Metabolism, Metabolomics, Transcriptomics
Abstract
Cancer cells that escape induction therapy are a major cause of relapse. Understanding metabolic alterations associated with drug resistance opens up unexplored opportunities for the development of new therapeutic strategies. Here, we applied a broad spectrum of technologies including RNA sequencing, global untargeted metabolomics, and stable isotope labeling mass spectrometry to identify metabolic changes in P-glycoprotein overexpressing T-cell acute lymphoblastic leukemia (ALL) cells, which escaped a therapeutically relevant daunorubicin treatment. We show that compared with sensitive ALL cells, resistant leukemia cells possess a fundamentally rewired central metabolism characterized by reduced dependence on glutamine despite a lack of expression of glutamate-ammonia ligase (GLUL), a higher demand for glucose and an altered rate of fatty acid β-oxidation, accompanied by a decreased pantothenic acid uptake capacity. We experimentally validate our findings by selectively targeting components of this metabolic switch, using approved drugs and starvation approaches followed by cell viability analyses in both the ALL cells and in an acute myeloid leukemia (AML) sensitive/resistant cell line pair. We demonstrate how comparative metabolomics and RNA expression profiling of drug-sensitive and -resistant cells expose targetable metabolic changes and potential resistance markers. Our results show that drug resistance is associated with significant metabolic costs in cancer cells, which could be exploited using new therapeutic strategies.
Introduction
Cancer is a clonal disease progressively producing new subclones displaying altered phenotypic and cytogenetic traits with selection for those that confer growth advantages under specific circumstances (1–3). Consequently, under therapeutic pressure, following the principles of natural selection, cancer cell populations that are most adaptive or resistant to treatment will be selected for, resulting in relapsing disease often associated with a worse prognosis (1, 4, 5). Relapse is commonly accompanied by overexpression of the ATP-binding cassette transporter ABCB1 gene product, P-glycoprotein (P-gp)3 (multidrug resistance protein 1) (6), a drug efflux pump that is a marker for both tumor resistance to chemotherapy and a more aggressive phenotype (7–9). However, P-gp inhibition has been unsuccessful in clinical trials (7, 8) so it is imperative to identify other targetable molecular mechanisms that are essential for cells with a drug-resistant phenotype to improve the prognosis of relapsing leukemia.
Metabolic alterations are part of oncogenesis and tumor progression (10), and cancer cell metabolism has therefore attracted interest as a target for therapeutic intervention (11–13). It is assumed that the development of drug resistance in cancer cells is accompanied by metabolic alterations that may be therapeutically targetable (14).
So far, only a few studies have analyzed the adaptations of cellular cancer metabolism in a resistance context. One of these studies showed metabolic rewiring to be essential in a lapatinib-resistant breast cancer cell line (15). Another used computational analyses of transcriptomic and metabolomic data on 59 cell lines from different types of cancer to identify a metabolic consensus phenotype associated with tumor cell chemosensitivity to platinum-based drugs (16).
However, due to the heterogeneity of tumors, merely identifying therapeutic opportunities is not sufficient; it is also necessary to develop methods for predicting which patients will benefit from specific therapeutic regimes. Transcriptional and metabolic changes associated with disease states can be detected using omics technologies, leading to the identification of combinations of prognostic markers such as oncometabolites and transcriptionally regulated metabolic networks. Such indicators could potentially be used to determine when it may be beneficial to treat a particular cancer patient with a drug or drug mixture that is normally used to manage other disease conditions. For example, they may indicate that it would be helpful to treat a patient with fibrates, which are used to reduce blood cholesterol and triglyceride levels (17).
Our combined approach of transcriptomic and metabolomic profiling revealed a central metabolic switch that occurs in daunorubicin (DNR)-resistant P-gp overexpressing leukemia cells. Compared with DNR-sensitive cells, the resistant cells are more dependent on glucose but less dependent on glutamine and fatty acids. We demonstrate how knowledge gained from combined transcriptomic and metabolomic analyses can be exploited to develop new induction treatment strategies involving drugs approved for unrelated indications with relatively low toxicity, which at relevant concentrations, sensitize resistant leukemia cells to DNR treatment.
EXPERIMENTAL PROCEDURES
Cell Lines and Growth Conditions
CCRF-CEM [CCRF CEM] (ATCC® CCL-119TM) (CEM) and HL60 (ATCC® CCL-240TM) leukemia cells were acquired through LGC Standards (Teddington, UK) from the American Type Culture Collection and maintained according to the manufacturer's recommendations. HL60/R10 cells were kindly provided by Professor Sigurd Vitols, Karolinska Institute.
Generation of the Resistant CEM/R2 Cells
CEM cells were grown for 4 days in the presence of 0.1 μm DNR diluted from a saline stock solution (9.0 mm) provided by the Karolinska University Hospital Pharmacy (Stockholm, Sweden). The cells' viability was then assessed by staining the dead cells with trypan blue and counting them with a TC10TM automated cell counter (Bio-Rad); fewer than 1% of the cells were found to be viable. After counting, the cells were washed twice with PBS, supplemented with fresh drug-free medium, and passaged 4 times, after which they were again incubated with 0.1 μm DNR, stained, and counted. The proportion of viable cells this time was >50%. These cells were again washed twice with PBS, transferred to fresh drug-free medium, passaged 4 times, and incubated, this time with 1 μm DNR. The above process of washing, passaging, and incubating with DNR was then repeated one last time, using a final DNR concentration of 5 μm to yield a CEM cell line with an IC50(DNR) of 1.67 μm that was designated CEM/R2 (Fig. 1, A and B).
FIGURE 1.

CEM/R2 cells are resistant to DNR but can be sensitized with the P-gp inhibitor valspodar. A, a DNR-resistant ALL cell line was obtained by applying a three-step selection process involving increasing DNR concentrations to the ALL cell line CCRF-CEM (CEM). B, CEM/R2 cells are about 360-fold more resistant toward DNR than CEM cells (n = 3). C, HL60/R10 cells are about 760-fold more resistant toward DNR than HL60 cells (n = 3). D, P-gp is expressed much more strongly in CEM/R2 (clear) than in CEM cells (shaded) as measured by FACS. E, CEM and CEM/R2 cells were treated with 0.25 μm valspodar alone and/or in combination with DNR (1 nm and 0.5 μm for CEM and CEM/R2, respectively; n = 2). F, HL60 and HL60/R10 cells were treated with 0.25 μm valspodar alone and/or in combination with DNR (5 nm and 5 μm for HL60 and HL60/R10, respectively; n = 2). B, C, E, and F, data shown as mean ± S.E.
Proliferation Assays, ATPliteTM (PerkinElmer Life Sciences)
For all experiments, the cells were seeded in black plates with a final density of 15,000 cells/well in 100 μl. The relevant treatment was initiated immediately after the wells were seeded. ATPliteTM experiments were performed according to the manufacturer's instructions. For all experiments comparing cells growing in medium containing pantothenic acid versus pantothenic acid reduced medium (RPMI1640 on customer request, Life Technologies), 96 h prior to the actual experiment, the cells were seeded at 250,000 cells/ml in the appropriate medium. 48 h thereafter cells were passaged again in fresh respective medium. For the DNR dose-response curves (Figs. 1, B and C, and 5, H and I), the cells were incubated for 48 h with increasing concentrations of DNR in RPMI1640 with pantothenic acid (HyClone, Fisher Scientific) or without pantothenic acid (Life Technologies) containing 10% FBS (Sigma) or 10% charcoal:dextran-stripped fetal bovine serum (CCS-FBS, Gemini Bio-Products). Cells were incubated for 48 h with or without the P-gp inhibitor valspodar (0.25 μm) in the absence (vehicle control dimethyl sulfoxide) or presence of DNR (CEM 1 nm, HL60 5 nm, CEM/R2 0.5 μm, HL60/R10 5 μm) (Fig. 1, E and F).
FIGURE 5.

CEM/R2 cells exhibit a decreased pantothenic acid uptake capacity, a higher sensitivity to fenofibrate, and co-administration of fenofibrate or perhexiline together with PA restriction sensitizes resistant cells to DNR treatment. A, stable isotope-labeled 13C315N1 PA was added to medium to trace PA uptake and intracellular PA/CoA concentrations as well as de novo CoA synthesis (top). Fenofibrate curves for CEM and CEM/R2 (B) (n = 5) or HL60 and HL60/R10 cells (C) (n = 3). D, effect of co-administration of fenofibrate (10 μm for CEM/R2, 20 μm for HL60/R10) or perhexiline (2.5 μm for CEM/R2, 5 μm for HL60/R10) with DNR (0.5 μm for CEM/R2, 5 μm for HL60/R10) (n = 4). CEM (E) (n = 5) or CEM/R2 (F) cells (n = 4) were treated with 10 μm fenofibrate or 2.5 μm perhexiline in the absence and presence of PA. G, CEM/R2 cells are more sensitive to fenofibrate in the presence of 0.25 μm DNR when PA availability is decreased (n = 3). B–G, cells were incubated for 72 h. H, reduced availability of PA in the presence of 10% CCS increases the sensitivity of CEM/R2 cells but not CEM cells toward DNR (I) but has no effect on either cell line in the presence of 10% FBS. H and I, Cells were incubated for 48 h (n = 3). Data shown as mean ± S.E.; p values were determined using a two-tailed unpaired t test.
The glutamine-free RPMI1640 (HyClone, Fisher Scientific) medium was supplemented with 10% FBS, and glutamine (Life Technologies) was added to final concentrations of 0.5, 1, or 2 mm. Cells were incubated for 72 h in the absence or presence of increasing concentrations of glutamine (Fig. 2, B and C). To analyze the effect of glucose deprivation the cells were incubated in glucose-free RPMI1640 (Life Technologies) or glucose-containing RPMI1640 (HyClone, Fisher Scientific) supplemented with 2.5% FBS for 48 h, or HL60 and HL60/R10 cells for 72 h (Fig. 4, A and B).
FIGURE 2.

CEM/R2 cells are less dependent on glutamine despite their lack of GLUL and lower levels of transcripts encoding proteins linked to Gln/Glu metabolism. A, transcriptional differences between CEM and CEM/R2 cells in central metabolic pathways, as detected by RNAseq. Genes indicated in red and green are down- and up-regulated, respectively, at the mRNA level in CEM/R2 cells. Viability of CEM and CEM/R2 (B) or HL60 and HL60/R10 (C) cells grown for 72 h in media containing decreasing concentrations of glutamine (n = 3). Data shown as mean ± S.E.; p values were determined using a two-tailed unpaired t test.
FIGURE 4.

Resistant leukemia cells are more vulnerable to glucose deprivation and differentially affected by carnitine palmitoyltransferase inhibitor perhexiline. Viability of CEM and CEM/R2 (A) (n = 5) or HL60 and HL60/R10 (B) (n = 3) cells that were grown for 72 h in RPMI with or without glucose. C, effect of 2.5 μm perhexiline on CEM and CEM/R2 viability (n = 4). D, effect of 5 μm perhexiline on HL60 and HL60/R10 cell viability (n = 3). A–D, cells were incubated for 72 h. Data shown as mean ± S.E. E, abundance (log10 of area units) for selected carnitines is shown in a box-and-whiskers plot (box represents 95% confidence interval, whiskers extend from the smallest to largest value and the line in the boxes represent the median of 5 technical replicates). F, de novo formation of selected carnitines estimated by growth in 2H2O medium. Ratio values represent isotopomer 1 (I1) over isotopomer 0 (I0) after 24 h growth in 2H/1H medium. Filled boxes are I1/I0 values from cells grown in 2H medium and open boxes are I1/I0 values representing cells grown in 1H medium. Data are presented as mean ± S.D. of 5 technical replicates. G, model for alteration in FAO/branched chain amino acid metabolism in resistant compared with sensitive cells. Highlighted in red are metabolites that exhibit a lower relative concentration or turnover rate in CEM/R2 (Figs. 3 and 4, E and F). A–F, p values were determined using a two-tailed unpaired t test. **, p ≤ 0.01; ***, p ≤ 0.001.
The carnitine palmitoyltransferase (CPT)-1 inhibitor perhexiline and the peroxisome proliferator-activated receptor α agonist fenofibrate, both from Sigma and dissolved in dimethyl sulfoxide, were diluted in RPMI1640 with or without pantothenic acid supplemented with 10% FBS. Cells were incubated for 72 h with perhexiline (CEM, CEM/R2, 2.5 μm; and HL60, HL60/R10, 5 μm) or fenofibrate (CEM, CEM/R2, 10 μm; and HL60, HL60/R10, 20 μm) in the presence or absence of DNR (CEM/R2, 0.5 μm; and HL60/R10, 5 μm) or increasing concentrations of fenofibrate (Figs. 4, C and D, and 5, B–G). The negative/vehicle control wells were treated with a volume of neat dimethyl sulfoxide equal to the volume of drug solution added in the other treatments.
P-gp Expression Measurements
CEM or CEM/R2 cells were incubated in normal growth medium (150,000 cells per well) for 48 h, then washed twice with PBS and fixed for 15 min at ambient temperature with 3.7% formaldehyde. After fixation the cells were blocked with 3% BSA containing 1 μg of rabbit IgG for 30 min at ambient temperature. After washing, the cells were incubated with anti-P-gp antibody (1:200, in 1% BSA, ambient temperature for 30 min; Thermo Scientific; clone F4). They were then washed twice, incubated with a FITC-labeled goat anti-mouse secondary antibody (1:200, in 1% BSA, ambient temperature for 30 min; Dako Diagnostics, Glostrup, Denmark), and washed twice again. FACS analysis was performed using a Guava easyCyte5 System (Millipore, Billerica, MA), with 10,000 events being counted for each sample.
RNA Sequencing
Two million cells were collected from each of the CEM and CEM/R2 lines. Total RNA was isolated and purified using the Qiagen RNeasy Mini Kit (Hilden, Germany). Samples of each line were prepared in triplicate for expression analysis by RNAseq. A detailed protocol for single cell RNAseq analysis has previously been reported (18, 19) and a very similar method was adopted in this work. Briefly, samples were prepared by adding 10 ng of RNA into each well of a 96-well PCR plate preloaded with lysis buffer. Reverse transcription reagents were added to generate first-strand cDNA. Well-specific barcodes were then introduced by exploiting a reverse transcriptase template-switching mechanism (20) whereby a helper oligonucleotide directs the incorporation of a specific sequence at the 3′ end of the cDNA molecule. A unique helper oligo containing a distinct 6-bp barcode and a universal primer sequence was added to each well, permitting amplification with a unique primer. All of the mRNA in a given well was thus tagged with a specific 6-bp barcode sequence. After cDNA synthesis, all of the reactions were pooled in a single tube and processed as a single sample. The pooled samples were purified and amplified by single-primer PCR in a single tube. This reduced the cell-to-cell amplification bias, minimizing the number of PCR cycles required. After PCR amplification, the samples were purified, processed, and adapted for Illumina sequencing. The cDNA library was fragmented, end-repaired, A-tailed, and the adapter ligated before making the final cDNA library for sequencing. Then the sample was diluted as necessary before being put in the Illumina sequencing machine. Single-end sequencing reads were generated from the final cDNA libraries. The sample was then loaded in single lanes to obtain a total of 150–200 million reads per 96-well library. Typically, 10–14 pmol of each sample was loaded onto the HiSeq 2000. Reads were sorted by barcode and mapped to the human genome using Bowtie (21). Unmapped reads were discarded and the raw reads of each sample were normalized to transcripts per million. Raw counts for all samples were further normalized to remove non-biological differences caused by sequencing depth. Variance estimation was done using the “estimateDispersions” function that is built into DESeq (22). Statistical tests based on a negative binomial distribution (22) were used to identify differentially expressed genes between two treatments.
Liquid Chromatography Mass Spectrometry (LC-MS) Measurements
For experiments with 2H2O, 3 × 10⁶ cells were cultured for 24 h in 1× RPMI1640 medium supplemented with 10% FBS diluted with either sterile H2O or 2H2O (99%) to a final concentration of 30% 2H2O (Cambridge Isotope Laboratories, MA). For untargeted metabolomics, 5 × 10⁶ cells were grown for 4 h in 10 ml of RPMI1640 medium supplemented with 10% FBS. The cells were centrifuged, washed at least once with PBS, transferred to a 1.5-ml Eppendorf tube, and lysed/extracted using 200 μl of 90:10 methanol:H2O to which a small lab-spoon of 0.2 μm inner diameter glass beads was added (Retsch). Tubes were placed in a Retsch Beadmill MM 400 and shaken at 30 Hz for 2 min. Eppendorf tubes were transferred to a microcentrifuge kept at 4 °C and spun at 14,000 rpm for 10 min after which the supernatant was transferred to LC-MS glass vials, dried down in a speed vacuum concentrator, and stored at −20 °C until analysis. Samples were dissolved in 20 μl of 50:50 methanol:H2O, of which 2 to 4 μl were injected into an Agilent 1290 LC-system connected to either a 6540 or 6550 Agilent Q-TOF mass spectrometer. An electrospray ionization source was used in all of the LC-MS measurements. Data were collected between m/z 70 to 1700 in positive/negative ion mode. The following electrospray ionization settings were used (Agilent Jetstream); gas temperature 300 °C, gas flow 8 liters/min, nebulizer pressure 40 p.s.i., sheet gas temperature 350 °C, sheet gas flow 11, Vcap 4000, fragmentor 100, Skimmer1 45, and OctapoleRFPeak 750. All samples were separated using a reverse phase Kinetex C18 column, 100 × 2.1 mm, 2.6 μm, 100 Å (Phenomenex, CA). Elution was performed using mixtures of solutions A (H2O, 0.1% formic acid) and B (75:25 acetonitrile:isopropyl alcohol, 0.1% formic acid); all solvents were of HPLC grade. All separations were performed at a flow rate of 0.5 ml/min using the following linear solvent gradient: min 0, 5% B; min 8, 95% B; min 10, 95% B; min 10.2, 5% B; min 12, 5% B. Raw data were processed using Mass Hunter Qual, Agilent with the “find by molecular feature” function; the resulting CEF files were further aligned and statistically processed in Mass Profiler Professional (Agilent). Metabolites were identified by comparing their accurate masses, retention times, and in some cases MS/MS spectra to data for synthetic standards obtained from Sigma and Inventia Pty. Ltd. (NSW, Australia).
For pantothenic acid uptake and CoA biosynthesis measurements, 6 × 10⁶ cells were grown for 24 h in 10 ml of RPMI1640 (HyClone, Fisher Scientific) supplemented with 10% FBS with or without the addition of 0.25 mg/liter of stable isotope-labeled pantothenic acid (13C315N1) from Cambridge Isotope Laboratories. The relative concentration of pantothenic acid was measured as described above. De novo synthesis and relative concentrations of CoA and acetyl-CoA were measured using an Agilent 1290 LC system connected to an Agilent 6460 triple quadrupole mass spectrometer. Separation was performed using the reversed phase setup as described above. For quantitative estimation of CoA and acetyl-CoA the following multiple reaction monitoring transitions were used: CoA m/z 768–261 and acetyl-CoA m/z 810–303. To follow the incorporation of the 13C315N1-labeled pantothenic acid into CoA and acetyl-CoA the following multiple reaction monitoring transitions were used: 3C315N1-CoA m/z 772–265 and 3C315N1-acetyl-CoA m/z 814–307. For all transitions a dwell of 200 ms, fragmentor voltage of 135, and collision energy of 30 V were employed. The relative fraction of labeled to unlabeled CoA and acetyl-CoA was determined by analyzing the ratio of the integrated areas (labeled/unlabeled) for the respective multiple reaction monitoring transitions. This value reflects the rate of de novo formation of these metabolites.
RESULTS
CEM/R2 Cells Are Resistant to DNR and Overexpress P-gp
To investigate the molecular characteristics of leukemia cells escaping therapy-induced cell death, we applied a three-step selection approach to the ALL cell line CCRF-CEM (CEM) using increasing DNR concentrations of 0.1, 1, and 5 μm (Fig. 1A), to ultimately isolate cells designated CEM/R2 with an IC50(DNR) of 1.67 μm (Fig. 1B). This is a clinically relevant drug resistance level as DNR dosing during induction regimens is in the range of 60–80 mg/m2 for adult (>15 years) ALL patients (23), corresponding to plasma DNR concentrations of ∼0.2–1.4 μm after a 1-h infusion (24). The generation and characteristics of the HL60/R10 cells are described in Ref. 25. Experimental validation confirmed an IC50(DNR) of 10.46 μm for the P-gp overexpressing HL60/R10 cells and 13.73 nm for HL60 cells (Fig. 1C).
Transcriptional analyses of CEM and CEM/R2 cells using RNAseq revealed, among other things, that the P-gp gene ABCB1 is expressed in CEM/R2 but not in CEM cells (supplemental Table S1). Furthermore, FACS analyses revealed cell surface expression of P-gp in CEM/R2 but not CEM cells (Fig. 1D). Finally, both of the resistant cell lines, CEM/R2 and HL60/R10, were sensitized to DNR in the presence of the P-gp inhibitor valspodar but no such effect was observed for sensitive CEM and HL60 cells (Fig. 1, E and F).
Differential Expression of Metabolism-linked mRNA Transcripts between CEM and CEM/R2 Cells
Transcriptional profiling of CEM and CEM/R2 cells using RNAseq revealed differential expression of 173 transcripts (supplemental Table S1). In addition to ABCB1, three genes displayed a reciprocal expression pattern between the CEM and CEM/R2 cells (supplemental Table S1). Transcripts encoding DENN/MADD domain-containing 2D protein (DENND2D), DnaJ homolog subfamily C member 15 (DNAJC15), and glutamate ammonia ligase (GLUL) were detected in CEM but not in CEM/R2 (supplemental Table S1). Examination of the RNAseq data further revealed that the canonical pathway exhibiting the most extensive differential expression between CEM/R2 and CEM cells was cholesterol biosynthesis; seven genes from this pathway (MSMO1, FDFT1, DHCR7, DHCR24, SQLE, IDI1, and HMGCS1) were up-regulated in CEM/R2 (supplemental Table S1). In addition to GLUL and the 7 genes involved in the cholesterol biosynthesis pathway, another 15 genes whose products are involved in metabolism were differentially expressed in CEM and CEM/R2 cells: GSTM3, PSAT1, MAT2B, DHFR, ASNS, ASS1, BCHE, IDH1, ALDOC, PCCB, MOCS2, ACAA2, PCBD2, SAT2, and SHMT2 (supplemental Table S1). Fig. 2A shows a cellular metabolic scheme featuring some of these genes, highlighting their functions and interconnections.
Resistant Cells Depend Less on Glutamine
GLUL is a gene encoding an enzyme that converts glutamate to glutamine. Its transcripts were detected in CEM but not in CEM/R2. This suggests that CEM/R2 lacks glutamine synthase activity and should therefore be more dependent on exogenous glutamine than the parent CEM line, in keeping with previous reports (26). The lack of glutamine synthase activity in CEM/R2 is further supported by the detected transcriptional down-regulation of PSAT1, ASNS, ASS1, and SLC1A5 (Fig. 2A), all of which encode proteins linked to glutamine/glutamate metabolism.
To test the proposal that CEM/R2 cells are more dependent on exogenous glutamine, CEM and CEM/R2 cells were grown in medium containing decreasing concentrations of glutamine (Fig. 2B). To our surprise, CEM/R2 cell proliferation was not reduced even in medium containing only 0.5 mm glutamine, in which CEM cell proliferation was reduced by approximately 75%. Hypothesizing that this might reflect a more general metabolic trait of P-gp overexpressing resistant leukemia cells, we compared the glutamine dependence of the AML leukemic cell line HL60 to that of HL60/R10 cells and observed that resistant HL60/R10 cells are also less affected by glutamine deprivation (Fig. 2C).
Differences in Metabolite Levels between CEM and CEM/R2 Cells
The aim of this study was to investigate the metabolic adaptation of P-gp overexpressing DNR-resistant cells. Because gene expression profiling revealed that the metabolism appeared to be a major phenotypic trait differentiating CEM and CEM/R2 cells, we used a general LC-MS methodology (27) to perform a global metabolomic analysis of CEM and CEM/R2 cells. In total 800 metabolite entities were detected. Using a list of 125 standards, run on the same LC-MS system as the cell samples, we extracted peak height data for metabolites whose concentrations in the drug-resistant CEM/R2 cells differed significantly from those in the sensitive CEM cells (Fig. 3). The metabolites with the most pronounced differences in abundance between resistant and sensitive cells for the CEM/R2 and HL60/R10 lines are shown in Fig. 3. Many of these metabolites are associated with fatty acid oxidation (FAO), including 3-hydroxyadipic acid (28), which was 2-fold higher in the resistant CEM cells and propionyl-, butyryl-, tigloyl-, and isovalerylcarnitine (29), which were ∼6–8-fold lower in resistant CEM/R2 cells than in their sensitive CEM counterparts (Fig. 3). Both, 3-hydroxyadipic acid and the carnitines displayed an inverse relationship between the CEM and HL60 cell lines (Fig. 3). Aside from FAO, short chain carnitines can be derived from branched chain amino acid catabolism involving biotin-dependent carboxylases, like, e.g. acetyl-CoA carboxylase, methylcrotonyl-CoA carboxylase, or propionyl-CoA carboxylase (PCCB) (30, 31). Notably, relative abundance of biotin and transcripts for PCCB were found reduced in resistant cells (Figs. 2A and 3A). In addition, relative concentration of tricarboxylic acid cycle (TCA) intermediates citrate and α-ketoglutarate were 2- to 3-fold lower in the resistant CEM cells. Finally, pantothenic acid (PA), also known as vitamin B5, is a nutritionally essential substance and precursor of coenzyme A (CoA); its levels in CEM/R2 cells were around 4-fold lower than in CEM cells (Fig. 3).
FIGURE 3.

Metabolites with the largest fold-change differences measured by LC-MS when comparing CEM/R2 versus CEM and HL60/R10 versus HL60. TCA intermediates are shown in blue, whereas metabolites that are directly or indirectly involved in fatty acid metabolism are highlighted in red. The LC-MS response (i.e. peak height) for each metabolite is set to 1 for CEM and HL60 cells and compared with the response for the corresponding resistant cell line. Data of one experiment are presented as mean ± S.D. (5 technical replicates).
Resistant Cells Depend More on Glycolysis and Display Differential Sensitivity to the CPT Inhibitor Perhexiline
Both the RNAseq data (Fig. 2A) and the 6–8-fold reduction in the levels of certain carnitines, FAO products, and TCA intermediates in CEM/R2 (Fig. 3A) prompted us to investigate the relative importance of glycolysis and FAO in CEM/R2 and CEM cells. To this end, we grew cancer cells and their respective resistant daughter lines without glucose. The resistant ALL and AML cell lines exhibited significantly lower ATP production than their sensitive counterparts under these conditions (Fig. 4, A and B), strongly supporting a higher demand of glucose in the resistant cells.
Second, we analyzed the effect of perhexiline on sensitive and resistant cells. Perhexiline is a drug used to manage angina pectoris via inhibition of CPT-1 and -2, which are responsible for transporting acyl carnitines into the mitochondria. Its impact on CEM cell proliferation was significantly greater than that on CEM/R2 cells (Fig. 4C), but HL60/R10 cells were more affected by perhexiline than sensitive HL60 cells (Fig. 4D).
Sensitive CEM Cells Depend More on FAO as Estimated by Pool Size and Relative 2H Incorporation
The relative abundance of selected acyl carnitines was determined in CEM/R2 and CEM cells (Figs. 3A and 4E). Significant differences between resistant and sensitive cells were observed for shorter chain acyl carnitines but not for those with longer (palmitoyl/stearoyl) chains (Fig. 4E). In parallel with this experiment, we grew cells in medium containing 30% 2H2O. The advantage of using general labeling with 2H2O (rather than a specifically labeled FAO substrate such as palmitic acid) to probe carnitine biosynthesis is that the general label reflects the sum of all metabolic reactions contributing to changes in the carnitine pool. Specifically, in the case of acyl carnitines, the 2H label could be incorporated into the carnitine, during branched-chain amino acid metabolism or during one of the extension steps by which palmitate is elongated to stearoyl-carnitine prior to fatty acid oxidation (32).
We tracked the rate of 2H incorporation by monitoring the isotopomer ratio (I), I1/I0 (33), which allowed us to examine the de novo formation of the selected acyl carnitines (Fig. 4F). By comparing the relative concentrations (Fig. 4E) and formation (Fig. 4F) of these acyl carnitines, we found that CEM cells have a higher turnover of butyryl- and stearoyl-carnitine than CEM/R2 cells as the pools of these compounds in CEM cells are similar in size (if not slightly larger) to those of the CEM/R2 cells and the formation rate is higher. This combination of pool and formation data are suggesting that the sensitive cells are more dependent on FAO (Fig. 4G). CEM/R2 cells exhibit elevated rates of propionyl- and tiglyl-carnitine formation (Fig. 4F) but have smaller pools of these compounds than sensitive CEM cells (Fig. 4E), suggesting an increased turnover of branched-chain amino acids (Fig. 4G). Short-chain acyl carnitines are oxidized to acetoacetate, which can replenish the TCA.
CEM/R2 Cells Exhibit Reduced Pantothenic Acid Uptake Capacity
The level of PA detected in CEM/R2 cells was 4 times lower than that in CEM cells (Fig. 3), which could be due to reduced PA uptake or very rapid intracellular turnover of PA into CoA. To distinguish between these two possibilities, CEM and CEM/R2 cells were grown in medium containing stable isotope-labeled PA so that their PA uptake and rate of de novo CoA biosynthesis could be monitored (Fig. 5A). After 24 h, the PA content of the CEM cell medium was significantly lower than that of the CEM/R2 medium, indicating that CEM cells have a higher PA uptake rate (Fig. 5A). Furthermore, intracellular levels of stable isotope-labeled PA in CEM/R2 cells were 10 times lower after 24 h than those in CEM cells, confirming the initial metabolomics finding. CoA displayed no difference in pool size in CEM versus CEM/R2 but the rate of de novo CoA biosynthesis was significantly reduced in CEM/R2 cells (Fig. 5A). This suggests that CEM/R2 cells have a lower capacity for CoA synthesis because their PA uptake capacity is comparatively limited.
CEM/R2 Cells Display an Increased Sensitivity to the FAO/Fatty Acid Synthesis Activating, Cholesterol Lowering Drug Fenofibrate
CoA is a central metabolite that links glycolysis and FAO to the TCA as well as being the building block for virtually all lipid derivatives including sterols and fatty acids. The precursor for de novo CoA synthesis is PA, for which the metabolomics analysis revealed a 4-fold lower intracellular concentration and diminished uptake capacity in CEM/R2 cells (Figs. 3A and 5A). To investigate the effect of FAO perturbation, the cells were treated with increasing concentrations of fenofibrate, a peroxisome proliferator-activated receptor α-activating drug that simultaneously increases the rates of FAO and fatty acid synthesis, and is used as a blood cholesterol lowering agent (17). Intriguingly, CEM/R2 cell proliferation was affected at lower doses of fenofibrate than CEM proliferation (Fig. 5B). Higher fenofibrate concentrations were required to induce significant effects on HL60 and HL60/R10 cell viability, and HL60/R10 cells were less sensitive than HL60 (Fig. 5C). Overall, however, both resistant cell lines were sensitized to DNR treatment by co-administration of perhexiline or fenofibrate (Fig. 5D).
Effect of Reduced Pantothenic Acid Availability on the Efficacy of Perhexiline and Fenofibrate in CEM and CEM/R2 Cells
Perhexiline reduced CEM cell proliferation in non-PA-restricted medium but had no effect on CEM cells grown in PA-reduced medium (Fig. 5E). In contrast, PA availability had no effect on perhexiline efficacy in CEM/R2 cells (Fig. 5F). No such difference was observed for fenofibrate in either CEM or CEM/R2 cells (Fig. 5, E and F). However, when challenged by co-administration of 0.25 μm DNR in the presence of increasing concentrations of fenofibrate, reducing the availability of PA increased fenofibrate sensitivity (Fig. 5G).
Reducing the Availability of Pantothenic Acid Slightly Increases CEM/R2 Cells' Sensitivity to DNR
To evaluate the impact of PA on the proliferative capacity of CEM/R2 and CEM cells under drug pressure, we used RPMI medium with/without PA supplementation containing either regular FBS or CCS. CCS is depleted of non-polar components so the CCS-containing medium mimics a cellular environment with a high intracellular demand for fatty acid/sterol synthesis. In the presence of CCS the IC50(DNR) for CEM/R2 cells was ∼2-fold lower for cells growing in PA-reduced medium (Fig. 5H), demonstrating that PA availability can become limiting for CEM/R2 cells under certain conditions. No such effect was observed for the CEM cells (Fig. 5H). In FBS-containing medium, the presence or absence of PA had no effect on DNR sensitivity in either CEM/R2 or CEM cells (Fig. 5I).
DISCUSSION
To identify and characterize metabolic shifts associated with drug resistance, which could serve as potential markers or targets for individualized therapy, we applied an aggressive selection strategy to obtain a cancerous ALL cell fraction designated CEM/R2 that was capable of tolerating exposure to a clinically relevant DNR concentration (Fig. 1, A and B). We studied these DNR-resistant, P-gp overexpressing ALL cells using global transcriptional and metabolic profiling approaches. From the resulting data, we generated hypotheses regarding the metabolic vulnerability of the resistant cells. Finally, we tested the validity and generality of our hypotheses by performing cell viability assays in both the CEM/R2 cells and a P-gp overexpressing DNR-resistant AML cell line. Our results are summarized graphically in Fig. 6.
FIGURE 6.
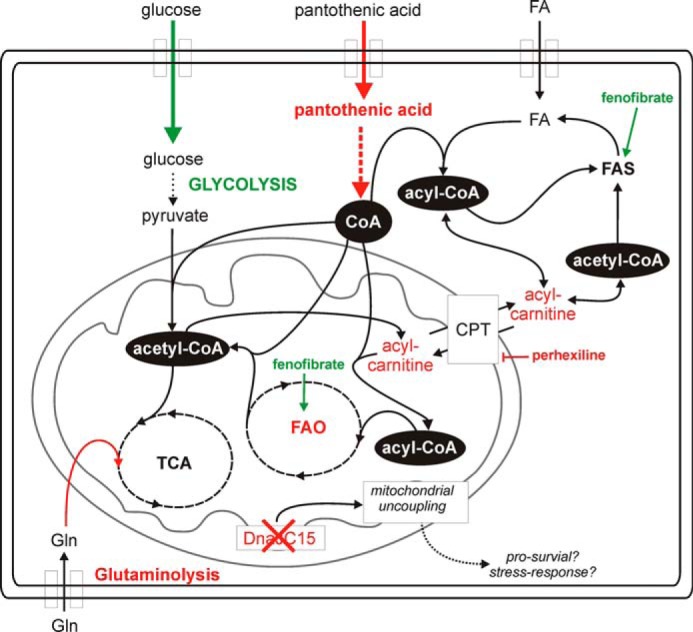
The metabolic rewiring of resistant leukemia cells. Resistant cells depend more on glycolysis and TCA but less on FAO and glutaminolysis. A reduced pantothenic acid uptake capacity might be central to this phenotype because of the importance of PA in allowing cells to maintain adequate CoA levels. The loss of DNAJC15 expression might also reflect a pro-survival signal mediated through a mitochondrial uncoupling mechanism. Green, up-regulated/activation. Red, down-regulated/inhibition.
RNAseq analyses revealed that transcripts of three genes were present in CEM but not in CEM/R2 cells (supplemental Table S1). One of these genes was DNAJC15, which encodes a methylation-controlled J protein belonging to the HSP40 family. Loss of expression of this protein has been implicated in de novo chemoresistance in ovarian cancer (34), whereas its overexpression in an ovarian cancer cell line yielded improved chemosensitivity (35). Ovarian and breast cancer patients exposed to continuous chemotherapy exhibited lower levels of DNAJC15 protein and enhanced drug resistance (36, 37). In addition, loss of DNAJC15 has been associated with P-gp overexpression and can modulate cellular responses to altered metabolic conditions by enhancing mitochondrial respiration (38, 39). Transcripts encoding the DENN/MADD domain containing 2D protein (DENND2D) were also detected in CEM but not CEM/R2 cells. Little is known about the biochemical function of the DENND2D gene product. However, DENND2D overexpression suppressed the proliferation of non-small cell lung cancer cells in vitro and in vivo by inducing apoptosis (40), implying that its non-expression in the CEM/R2 cells may represent the loss of a tumor suppressing protein. In keeping with this suggestion, it has been proposed that DENND2D could be a useful marker for predicting the progression and early recurrence of all types of gastric cancer (41). Finally, GLUL transcripts were only detected in CEM cells. Increased glutaminolysis relative to normal proliferating cells is a key characteristic of proliferating cancer cells (14, 42). However, although CEM/R2 cells lack GLUL transcripts and exhibit reduced levels of transcripts for the glutamine metabolism genes ASNS, ASS1, and the glutamine transporter gene SLC1A5, it appears that they are less dependent on glutamine metabolism than non-resistant CEM cells (Fig. 2, A and B). This hypothesis was supported by the resistant CEM/R2 and HL60/R10 cell lines' decreased dependence of exogenous glutamine for proliferation (Fig. 2, B and C). Increased GLUL expression was reported to be a prognostic factor predicting a reduced risk of relapse in pre-B ALL (43); conversely, glutamine-independent breast cancer cells were associated with increased expression of mesenchymal markers, a more aggressive mouse xenograft phenotype and resistance to chemotherapeutics (44). Furthermore, silencing of glutaminase, which catalyzes the first step in glutamine-dependent TCA anaplerosis, induced pyruvate carboxylase activity, demonstrating that glutamine metabolism and glycolysis are linked (45). These reports paired with our experimental evidence (Figs. 2, B and C, and 4, A and B) strongly support an increased dependence on glycolysis in the resistant cells and prompt us to suggest that reductions in GLUL expression and glutamine dependence may reflect a more general adaptation based on metabolic rewiring that accompanies drug resistance in cancer cells.
The results presented herein provide considerable evidence for such metabolic rewiring in resistant cells, including the detected up-regulation of ALDOC transcripts in CEM/R2 cells (Fig. 2A), their slightly increased intracellular lactate levels (Fig. 3A), and their higher sensitivity to glucose depletion (Fig. 4A), all of which suggest a higher rate of glycolysis compared with drug-sensitive CEM cells. In addition, CEM/R2 cells exhibited down-regulation of transcripts involved in FAO, namely ACCA2 and PCCB (Fig. 2A), and reduced levels of palmitate, oleate, and short-chain acyl carnitines. This suggests that the drug-resistant cells have a lower rate of FAO and/or branched-chain amino acid metabolism than their sensitive counterparts (Fig. 3A). In general, carnitines are involved in the transport of fatty acids into the mitochondria. Reductions in their abundance could thus reflect a decreased fatty acid metabolism caused by a lower capability to transport fatty acyl residues inside the mitochondria, implying a reduction in the FAO rate in CEM/R2 cells.
We analyzed the effect of glucose deprivation on CEM and CEM/R2 as well as HL60 and HL60/R10 cells, revealing that both resistant leukemia cell lines are more heavily affected by glucose removal than their sensitive counterparts (Fig. 4, A and B). Further experimental evidence for a greater FAO dependence in the drug-sensitive CEM cells was provided by the observation of their greater sensitivity to the CPT inhibitor perhexiline (Fig. 4C). CPT-1/2 are responsible for transporting acyl-carnitines into the mitochondria, so enhanced sensitivity to CPT inhibition is likely to reflect a higher demand for fatty acyl residues in the mitochondria. In contrast, perhexiline affected HL60/R10 proliferation but had no effect on HL60 cells (Fig. 4D). This is consistent with the increased levels of carnitines and decreased content of 3-hydroxyadipic acid detected in HL60/R10 compared with HL60 cells (Fig. 3B), suggesting that the former have a higher rate of FAO. It is possible that the concentrations of FAO intermediates or metabolites originating from FAO (e.g. 3-hydroxy fatty acids, dioic fatty acids, and carnitines) in tumor-derived cancer cells could serve as indicators or biomarkers for the usefulness of FAO-inhibiting adjuvant therapies.
One remarkable difference between the metabolic profiles for CEM and CEM/R2 cells was that the latter exhibited greatly reduced intracellular levels of pantothenic acid, a nutritionally essential substance and precursor of CoA (Fig. 3). We were able to show that this was due to a reduced capacity for PA uptake, which results in a lower intracellular CoA synthesis rate and may represent a metabolic weakness that could provide a therapeutic window (Fig. 5A). This hypothesis was supported by the following experimental observations. First, the peroxisome proliferator-activated receptor α-activating drug fenofibrate, which increases the rates of FAO and fatty acid synthesis (17) and is used to reduce blood cholesterol, affected CEM/R2 cell proliferation at lower doses than CEM (Fig. 5B). Second, reducing the availability of pantothenic acid increased the sensitivity of CEM/R2 cells to both fenofibrate and DNR treatment (Fig. 5, G and H). Fenofibrate has been proposed as an anti-cancer agent acting via an anti-angiogenesis mechanism (46). Our findings suggest it also acts on cancer cells by accelerating acetyl-CoA consumption and thereby perturbing fatty acid/sterol metabolism. Thus, PA uptake and/or metabolism may provide a therapeutic window that could be exploited via dietary restriction of vitamin B5 or inhibition of PA uptake/CoA metabolism. Finally, CEM cell proliferation was not affected by perhexiline treatment when CEM cells were grown in PA-restricted medium, suggesting that they retain the ability to switch away from FAO when the availability of PA is low, which was not observed for CEM/R2 cells (Fig. 5, E and F).
In summary, we have shown that combining transcriptomic and metabolomic data with experimental validation of hypotheses generated from the omics data sets is a powerful way of interrogating complex biological systems. We demonstrate that the central metabolism of P-gp overexpressing, DNR-resistant leukemia cells is fundamentally rewired. The key metabolic traits of these resistant cells are a reduced dependence on glutamine, a lower rate of FAO, and a higher demand for glucose accompanied by a decreased pantothenic acid uptake capacity (Fig. 6). However, it remains unclear whether the rewired metabolism is a cause or effect of the acquired resistance. A better understanding of the metabolic cost of resistance could guide the discovery of therapy selection biomarkers and the development of new therapeutic strategies, thereby potentially giving old drugs new tasks.
Supplementary Material
This work was supported by Swedish Research Council Grants 2007-5143 (to A. N.) and 2012-5145 (to J. L.), grants from the Erling-Persson family foundation (to Umeå University), the Swedish Foundation for Strategic Research (to A. N.), the Swedish Cancer Society (to J. L.), and Jane and Dan Olsson Foundation (to A. N.).

This article contains supplemental Table S1.
- P-gp
- P-glycoprotein
- ALL
- acute lymphoblastic leukemia
- AML
- acute myeloid leukemia
- CCS
- charcoal:dextran-stripped fetal bovine serum
- CPT
- carnitine palmitoyltransferase
- DNR
- daunorubicin
- FAO
- fatty acid β-oxidation
- PA
- pantothenic acid
- RNAseq
- RNA sequencing
- TCA
- tricarboxylic acid
- GLUL
- glutamate-ammonia ligase
- PCCB
- propionyl-CoA carboxylase.
REFERENCES
- 1. Mullighan C. G., Phillips L. A., Su X., Ma J., Miller C. B., Shurtleff S. A., Downing J. R. (2008) Genomic analysis of the clonal origins of relapsed acute lymphoblastic leukemia. Science 322, 1377–1380 [DOI] [PMC free article] [PubMed] [Google Scholar]
- 2. Haffner M. C., Mosbruger T., Esopi D. M., Fedor H., Heaphy C. M., Walker D. A., Adejola N., Gürel M., Hicks J., Meeker A. K., Halushka M. K., Simons J. W., Isaacs W. B., De Marzo A. M., Nelson W. G., Yegnasubramanian S. (2013) Tracking the clonal origin of lethal prostate cancer. J. Clin. Investig. 123, 4918–4922 [DOI] [PMC free article] [PubMed] [Google Scholar]
- 3. Clappier E., Gerby B., Sigaux F., Delord M., Touzri F., Hernandez L., Ballerini P., Baruchel A., Pflumio F., Soulier J. (2011) Clonal selection in xenografted human T cell acute lymphoblastic leukemia recapitulates gain of malignancy at relapse. J. Exp. Med. 208, 653–661 [DOI] [PMC free article] [PubMed] [Google Scholar]
- 4. Zahreddine H., Borden K. L. (2013) Mechanisms and insights into drug resistance in cancer. Front. Pharmacol. 4, 28. [DOI] [PMC free article] [PubMed] [Google Scholar]
- 5. Greaves M., Maley C. C. (2012) Clonal evolution in cancer. Nature 481, 306–313 [DOI] [PMC free article] [PubMed] [Google Scholar]
- 6. Styczynski J., Wysocki M., Debski R., Czyzewski K., Kolodziej B., Rafinska B., Kubicka M., Koltan S., Koltan A., Pogorzala M., Kurylak A., Olszewska-Slonina D., Balwierz W., Juraszewska E., Wieczorek M., Olejnik I., Krawczuk-Rybak M., Kuzmicz M., Kowalczyk J., Stefaniak J., Badowska W., Sonta-Jakimczyk D., Szczepanski T., Matysiak M., Malinowska I., Stanczak E., Wachowiak J., Konatkowska B., Gil L., Balcerska A., Maciejka-Kapuscinska L. (2007) Predictive value of multidrug resistance proteins and cellular drug resistance in childhood relapsed acute lymphoblastic leukemia. J. Cancer Res. Clin. Oncol. 133, 875–893 [DOI] [PMC free article] [PubMed] [Google Scholar]
- 7. Borst P., Schinkel A. H. (2013) P-glycoprotein ABCB1: a major player in drug handling by mammals. J. Clin. Investig. 123, 4131–4133 [DOI] [PMC free article] [PubMed] [Google Scholar]
- 8. Chen K. G., Sikic B. I. (2012) Molecular pathways: regulation and therapeutic implications of multidrug resistance. Clin. Cancer Res. 18, 1863–1869 [DOI] [PMC free article] [PubMed] [Google Scholar]
- 9. Amiri-Kordestani L., Basseville A., Kurdziel K., Fojo A. T., Bates S. E. (2012) Targeting MDR in breast and lung cancer: discriminating its potential importance from the failure of drug resistance reversal studies. Drug Resistance Updates 15, 50–61 [DOI] [PMC free article] [PubMed] [Google Scholar]
- 10. Galluzzi L., Kepp O., Vander Heiden M. G., Kroemer G. (2013) Metabolic targets for cancer therapy. Nat. Rev. Drug Discov. 12, 829–846 [DOI] [PubMed] [Google Scholar]
- 11. Carracedo A., Cantley L. C., Pandolfi P. P. (2013) Cancer metabolism: fatty acid oxidation in the limelight. Nat. Rev. Cancer 13, 227–232 [DOI] [PMC free article] [PubMed] [Google Scholar]
- 12. Clendening J. W., Penn L. Z. (2012) Targeting tumor cell metabolism with statins. Oncogene 31, 4967–4978 [DOI] [PubMed] [Google Scholar]
- 13. Muñoz-Pinedo C., El Mjiyad N., Ricci J. E. (2012) Cancer metabolism: current perspectives and future directions. Cell Death Dis. 3, e248. [DOI] [PMC free article] [PubMed] [Google Scholar]
- 14. Zhao Y., Butler E. B., Tan M. (2013) Targeting cellular metabolism to improve cancer therapeutics. Cell Death Dis. 4, e532. [DOI] [PMC free article] [PubMed] [Google Scholar]
- 15. Castro-Perez J. M., Roddy T. P., Shah V., McLaren D. G., Wang S. P., Jensen K., Vreeken R. J., Hankemeier T., Johns D. G., Previs S. F., Hubbard B. K. (2011) Identifying static and kinetic lipid phenotypes by high resolution UPLC-MS: unraveling diet-induced changes in lipid homeostasis by coupling metabolomics and fluxomics. J. Proteome Res. 10, 4281–4290 [DOI] [PubMed] [Google Scholar]
- 16. Araki Y., Andoh A., Tsujikawa T., Fujiyama Y., Bamba T. (2001) Alterations in intestinal microflora, faecal bile acids and short chain fatty acids in dextran sulphate sodium-induced experimental acute colitis in rats. Eur. J. Gastroenterol. Hepatol. 13, 107–112 [DOI] [PubMed] [Google Scholar]
- 17. Oosterveer M. H., Grefhorst A., van Dijk T. H., Havinga R., Staels B., Kuipers F., Groen A. K., Reijngoud D. J. (2009) Fenofibrate simultaneously induces hepatic fatty acid oxidation, synthesis, and elongation in mice. J. Biol. Chem. 284, 34036–34044 [DOI] [PMC free article] [PubMed] [Google Scholar]
- 18. Islam S., Kjällquist U., Moliner A., Zajac P., Fan J. B., Lönnerberg P., Linnarsson S. (2011) Characterization of the single-cell transcriptional landscape by highly multiplex RNA-seq. Genome Res. 21, 1160–1167 [DOI] [PMC free article] [PubMed] [Google Scholar]
- 19. Islam S., Kjällquist U., Moliner A., Zajac P., Fan J. B., Lönnerberg P., Linnarsson S. (2012) Highly multiplexed and strand-specific single-cell RNA 5′ end sequencing. Nat. Protoc. 7, 813–828 [DOI] [PubMed] [Google Scholar]
- 20. Zajac P., Islam S., Hochgerner H., Lönnerberg P., Linnarsson S. (2013) Base preferences in non-templated nucleotide incorporation by MMLV-derived reverse transcriptases. PloS One 8, e85270. [DOI] [PMC free article] [PubMed] [Google Scholar]
- 21. Langmead B., Trapnell C., Pop M., Salzberg S. L. (2009) Ultrafast and memory-efficient alignment of short DNA sequences to the human genome. Genome Biol. 10, R25. [DOI] [PMC free article] [PubMed] [Google Scholar]
- 22. Anders S., Huber W. (2010) Differential expression analysis for sequence count data. Genome Biol. 11, R106. [DOI] [PMC free article] [PubMed] [Google Scholar]
- 23. Stock W., Johnson J. L., Stone R. M., Kolitz J. E., Powell B. L., Wetzler M., Westervelt P., Marcucci G., DeAngelo D. J., Vardiman J. W., McDonnell D., Mrózek K., Bloomfield C. D., Larson R. A. (2013) Dose intensification of daunorubicin and cytarabine during treatment of adult acute lymphoblastic leukemia: results of Cancer and Leukemia Group B Study 19802. Cancer 119, 90–98 [DOI] [PMC free article] [PubMed] [Google Scholar]
- 24. Bogason A., Quartino A. L., Lafolie P., Masquelier M., Karlsson M. O., Paul C., Gruber A., Vitols S. (2011) Inverse relationship between leukaemic cell burden and plasma concentrations of daunorubicin in patients with acute myeloid leukaemia. Br. J. Clin. Pharmacol. 71, 514–521 [DOI] [PMC free article] [PubMed] [Google Scholar]
- 25. Jönsson K., Dahlberg N., Tidefelt U., Paul C., Andersson G. (1995) Characterization of an anthracycline-resistant human promyelocyte leukemia (HL-60) cell line with an elevated MDR-1 gene expression. Biochem. Pharmacol. 49, 755–762 [DOI] [PubMed] [Google Scholar]
- 26. Kung H. N., Marks J. R., Chi J. T. (2011) Glutamine synthetase is a genetic determinant of cell type-specific glutamine independence in breast epithelia. PLoS Genet. 7, e1002229. [DOI] [PMC free article] [PubMed] [Google Scholar]
- 27. Nordström A., Want E., Northen T., Lehtiö J., Siuzdak G. (2008) Multiple ionization mass spectrometry strategy used to reveal the complexity of metabolomics. Anal. Chem. 80, 421–429 [DOI] [PubMed] [Google Scholar]
- 28. Tserng K. Y., Jin S. J. (1991) Metabolic origin of urinary 3-hydroxy dicarboxylic acids. Biochemistry 30, 2508–2514 [DOI] [PubMed] [Google Scholar]
- 29. Tein I. (2013) Disorders of fatty acid oxidation. Handbook Clin. Neurol. 113, 1675–1688 [DOI] [PubMed] [Google Scholar]
- 30. Roe D. S., Roe C. R., Brivet M., Sweetman L. (2000) Evidence for a short-chain carnitine-acylcarnitine translocase in mitochondria specifically related to the metabolism of branched-chain amino acids. Mol. Genet. Metab. 69, 69–75 [DOI] [PubMed] [Google Scholar]
- 31. Violante S., Ijlst L., Ruiter J., Koster J., van Lenthe H., Duran M., de Almeida I. T., Wanders R. J., Houten S. M., Ventura F. V. (2013) Substrate specificity of human carnitine acetyltransferase: implications for fatty acid and branched-chain amino acid metabolism. Biochim. Biophys. Acta 1832, 773–779 [DOI] [PubMed] [Google Scholar]
- 32. Kerner J., Minkler P. E., Lesnefsky E. J., Hoppel C. L. (2007) Fatty acid chain-elongation in perfused rat heart: synthesis of stearoylcarnitine from perfused palmitate. FEBS Lett. 581, 4491–4494 [DOI] [PMC free article] [PubMed] [Google Scholar]
- 33. Castro-Perez J., Previs S. F., McLaren D. G., Shah V., Herath K., Bhat G., Johns D. G., Wang S. P., Mitnaul L., Jensen K., Vreeken R., Hankemeier T., Roddy T. P., Hubbard B. K. (2011) In vivo D2O labeling to quantify static and dynamic changes in cholesterol and cholesterol esters by high resolution LC/MS. J. Lipid Res. 52, 159–169 [DOI] [PMC free article] [PubMed] [Google Scholar]
- 34. Shridhar V., Bible K. C., Staub J., Avula R., Lee Y. K., Kalli K., Huang H., Hartmann L. C., Kaufmann S. H., Smith D. I. (2001) Loss of expression of a new member of the DNAJ protein family confers resistance to chemotherapeutic agents used in the treatment of ovarian cancer. Cancer Res. 61, 4258–4265 [PubMed] [Google Scholar]
- 35. Witham J., Vidot S., Agarwal R., Kaye S. B., Richardson A. (2008) Transient ectopic expression as a method to detect genes conferring drug resistance. Int. J. Cancer 122, 2641–2645 [DOI] [PubMed] [Google Scholar]
- 36. Strathdee G., Davies B. R., Vass J. K., Siddiqui N., Brown R. (2004) Cell type-specific methylation of an intronic CpG island controls expression of the MCJ gene. Carcinogenesis 25, 693–701 [DOI] [PubMed] [Google Scholar]
- 37. Lindsey J. C., Lusher M. E., Strathdee G., Brown R., Gilbertson R. J., Bailey S., Ellison D. W., Clifford S. C. (2006) Epigenetic inactivation of MCJ (DNAJD1) in malignant paediatric brain tumours. Int. J. Cancer 118, 346–352 [DOI] [PubMed] [Google Scholar]
- 38. Hatle K. M., Gummadidala P., Navasa N., Bernardo E., Dodge J., Silverstrim B., Fortner K., Burg E., Suratt B. T., Hammer J., Radermacher M., Taatjes D. J., Thornton T., Anguita J., Rincon M. (2013) MCJ/DnaJC15, an endogenous mitochondrial repressor of the respiratory chain that controls metabolic alterations. Mol. Cell. Biol. 33, 2302–2314 [DOI] [PMC free article] [PubMed] [Google Scholar]
- 39. Hatle K. M., Neveu W., Dienz O., Rymarchyk S., Barrantes R., Hale S., Farley N., Lounsbury K. M., Bond J. P., Taatjes D., Rincón M. (2007) Methylation-controlled J protein promotes c-Jun degradation to prevent ABCB1 transporter expression. Mol. Cell. Biol. 27, 2952–2966 [DOI] [PMC free article] [PubMed] [Google Scholar]
- 40. Ling B., Zheng H., Fu G., Yuan J., Shi T., Chen S., Liu Y., Liu Y., Cao Y., Zheng S., Guo S., Han N., Gao Y., Cheng S., Zhang K. (2013) Suppression of non-small cell lung cancer proliferation and tumorigenicity by DENND2D. Lung Cancer 79, 104–110 [DOI] [PubMed] [Google Scholar]
- 41. Kanda M., Shimizu D., Nomoto S., Takami H., Hibino S., Oya H., Hashimoto R., Suenaga M., Inokawa Y., Kobayashi D., Tanaka C., Yamada S., Fujii T., Nakayama G., Sugimoto H., Koike M., Fujiwara M., Kodera Y. (2014) Prognostic impact of expression and methylation status of DENN/MADD domain-containing protein 2D in gastric cancer. Gastric Cancer, 10.1007/s10120-014-0372-0 [DOI] [PubMed] [Google Scholar]
- 42. Daye D., Wellen K. E. (2012) Metabolic reprogramming in cancer: unraveling the role of glutamine in tumorigenesis. Semin. Cell Dev. Biol. 23, 362–369 [DOI] [PubMed] [Google Scholar]
- 43. Hoffmann K., Firth M. J., Beesley A. H., Freitas J. R., Ford J., Senanayake S., de Klerk N. H., Baker D. L., Kees U. R. (2008) Prediction of relapse in paediatric pre-B acute lymphoblastic leukaemia using a three-gene risk index. Br. J. Haematol. 140, 656–664 [DOI] [PubMed] [Google Scholar]
- 44. Singh B., Tai K., Madan S., Raythatha M. R., Cady A. M., Braunlin M., Irving L. R., Bajaj A., Lucci A. (2012) Selection of metastatic breast cancer cells based on adaptability of their metabolic state. PloS One 7, e36510. [DOI] [PMC free article] [PubMed] [Google Scholar]
- 45. Cheng T., Sudderth J., Yang C., Mullen A. R., Jin E. S., Matés J. M., DeBerardinis R. J. (2011) Pyruvate carboxylase is required for glutamine-independent growth of tumor cells. Proc. Natl. Acad. Sci. U.S.A. 108, 8674–8679 [DOI] [PMC free article] [PubMed] [Google Scholar]
- 46. Panigrahy D., Kaipainen A., Huang S., Butterfield C. E., Barnés C. M., Fannon M., Laforme A. M., Chaponis D. M., Folkman J., Kieran M. W. (2008) PPARα agonist fenofibrate suppresses tumor growth through direct and indirect angiogenesis inhibition. Proc. Natl. Acad. Sci. U.S.A. 105, 985–990 [DOI] [PMC free article] [PubMed] [Google Scholar]
Associated Data
This section collects any data citations, data availability statements, or supplementary materials included in this article.