

Abstract
Congenital and acquired (drug-induced) forms of the human long-QT syndrome are associated with alterations in Kv11.1 (hERG) channel-controlled repolarizing IKr currents of cardiac action potentials. A mandatory drug screen implemented by many countries led to a discovery of a large group of small molecules that can activate hERG currents and thus may act as potent antiarrhythmic agents. Despite significant progress in identification of channel activators, little is known about their mechanism of action. A combination of electrophysiological studies with molecular and kinetic modeling was used to examine the mechanism of a model activator (NS1643) action on the hERG channel and its L529I mutant. The L529I mutant has gating dynamics similar to that of wild-type while its response to application of NS1643 is markedly different. We propose a mechanism compatible with experiments in which the model activator binds to the closed (C3) and open states (O). We suggest that NS1643 is affecting early gating transitions, probably during movements of the voltage sensor that precede the opening of the activation gate.
Introduction
The human ether-à-go-go-related gene 1 (hERG1a), also referred to as the KCNH2 gene, encodes a voltage-activated potassium channel (Kv11.1). This ion channel, simply denoted as “hERG”, plays a crucial role in the delayed rectified potassium current (IKr) in cardiac myocytes (1–3). Although the overall structure of hERG is homologous to that of other potassium channels, its gating kinetics is distinct and is characterized by a comparatively slow activation and deactivation kinetics (on the order of hundreds of milliseconds to seconds) but very rapid, voltage-dependent inactivation (on the order of milliseconds to tens of milliseconds) (2,4,5). It is generally agreed that gating dynamics of hERG is essential for its function in the cardiac repolarization process. In the ascending phase of the action potential, as a result of slow activation and simultaneous fast inactivation, little outward current flows through hERG during depolarization. As the membrane repolarizes, the channels recover from inactivation much faster than they deactivate, generating an outward current that is the key determinant for the termination of the plateau phase of the action potential (4). Congenital mutations or drug binding that perturbs hERG currents may have both therapeutic and proarrhythmic consequences (6–9). An implemented screen of novel drug candidates for potential to attenuate hERG function has led to identification of compounds capable of hERG current enhancement (2). However, a thorough examination of the effects of hERG activators in vitro and in intact cardiac tissue has not yet been performed.
A drug-induced increase in the time-dependent IKr rather than its tail current can truncate the action potential and cause the short QT syndrome, similar to that of gain-of-function mutations (10). The short QT syndrome results from decreased inactivation leading in an increase in time-dependent current at the expense of loss of inward rectification, its negative slope conductance, and a decrease in tail current amplitude (relative to time-dependent current). Similarly, hERG activator drugs, which shift C-type inactivation, could be proarrhythmic or antiarrhythmic, depending on the details of their effect on action potential duration and its shape. For example, some activators maintain inward rectification and increase the tail current, whereas others shift the voltage-dependence of C-type inactivation to depolarized potentials and thus increase the time-dependent current at the expense of decreasing the tail current amplitude (2). The key to better understanding of safe drug design is to analyze, at the molecular level, their action mechanism to have a clear goal of increasing tail currents without an increase in the time-dependent current, and then to iteratively refine model/experiment to generate safe and effective drugs. While a number of groups have identified molecular pockets responsible for interactions with a range of hERG activators (11–14), it is unclear how drug binding perturbs IKr and which of the states in channel gating is stabilized by binding of an opener.
In a 2012 study, Durdagi et al. (12) used structure-guided mutagenesis strategy and voltage-clamp assays to identify a number of novel amino acids that frame the binding pocket for a model hERG activator NS1643 (1,3-bis-(2-hydroxy-5-trifluoromethyl-phenyl)urea) shown in Fig. 1. One of the amino acids identified but not examined in that study was L529 (Fig. 1), which corresponds to known hydrophobic-switch isoleucine in the ILT domain described by the Aldrich laboratory (15,16). Further studies combining molecular modeling, biophysical and electrophysiological recordings for wild-type (WT) WT-hERG, and a set of L/X529 mutants (14) provided direct evidence for a possible coupling between an activator binding site around L529 (Fig. 1) and gating kinetics. We also found that before application of NS1643, the activation characteristics of WT and a conservative mutant (L529I) channel are similar. However, after application of NS1643, the slope of the activation curve in the L529I variant of hERG channel flattened significantly. This is indicative of reduced voltage sensitivity in the mutant. To reveal detailed mechanism of drug action, it is necessary to understand which steps in channel activation dynamics are perturbed. Several kinetic models are available that can account for hERG gating kinetics (17–19). Despite these studies, understanding of hERG activation gating lacks the depth of that for Shaker channels and this places significant limits on the mechanistic interpretation of electrophysiological and pharmacological data on activator mechanism of action. Accordingly, this study develops a kinetic model to explain mechanism of NS1643 attenuation of IKr in WT and L529I mutants of the hERG channel—two systems with marked differences in drug-dependent activation dynamics. We combined electrophysiological measurements with mathematical modeling to gain deeper understanding of functional factors governing activator action in hERG channels.
Figure 1.

hERG open state homology model (pore domain and voltage sensor domain (VSD)). Proposed binding region for NS1643 in the vicinity of L529 is highlighted (blue, left). Chemical structure of NS1643 drug (top right). (Boxed region, left) An expanded and rotated view of one VSD subunit highlighting the mutation location in S4 helix. To see this figure in color, go online.
Materials and Methods
Experimental methods
Molecular biology
The methods for site-directed mutagenesis have been previously reported in Durdagi et al. (12). The hERG1a constructs were transfected into mammalian hEK cells because their background potassium currents are small and no dofetilide-sensitive tail current is observed in untransfected hEK cells. The mutant L529I construct was generated with conventional overlap PCR using primers synthesized by Sigma Genosys (Oakville, Ontario, Canada) and sequenced using a Eurofins MWG Operon (Huntsville, AL). Constructs were linearized with XbaI restriction endonuclease and cRNA was transcribed in vitro using the mMessage mMachine T7 Ultra cRNA transcription kit (Ambion, Austin, TX).
Electrophysiology
Transfected hEK cells were grown on glass coverslips. The coverslips were placed in a 2 cc chamber, which was superfused at a rate of 2 mL/min at room temperature. The whole-cell voltage-clamp methods have been previously reported in Durdagi et al. (12). The pipette solution contained KCl 10 mM, K-aspartate 110 mM, MgCl2 5 mM, Na2 ATP 5 mM, EGTA 10 mM, HEPES 5 mM, and CaCl2 1 mM, corrected to pH 7.2 with KOH. The extracellular solution contained NaCl 140 mM, KCl 5.4 mM, CaCl2 1 mM, MgCl2 1 mM, HEPES 5 mM, and glucose 5.5 mM, corrected to pH 7.4 with NaOH. For IKr measurements, the whole cell configuration of the patch-clamp method was used. The series resistance measured in the solution was <7 MΩ. Data were sampled at 1 kHz. The holding potential was −80 mV. All tail currents reported in this article represent dofetilide-sensitive currents. The NS1643 (Tocris Bioscience, Ellisville, MO) was dissolved in DMSO (30 mM) first and then diluted into the extracellular solution. All the experiments were performed at room temperature. The data was sampled at 2 kHz and analyzed with the software CLAMPFIT (Axon Instruments, Molecular Devices, Eugene, OR). Student’s t-test was used in the statistical analysis.
Voltage dependence of activation
From a holding potential of −80 mV, cells were depolarized for 1 s to a range of voltages from +50 to −100 mV in a 10-mV step followed by a step potential to −100 mV for 1 s to record the tail currents. If the tail current did not completely deactivate by −100 mV, a −120-mV, 1-s prepulse was applied to completely close the hERG channels before subsequent depolarization. The isochronal tail current-voltage plots were fit to a single Boltzmann function:
| (1) |
In this formulation, V1/2 is voltage of the half-maximal activation, and k is the slope factor.
Inactivation V0.3 parameter
The inactivation of hERG was measured by a previously reported triple-pulse protocol (12). The holding potential was −80 mV. The hERG channel was first depolarized to +50 mV for 500 ms. Recovery from inactivation was achieved using a short pulse (5 ms hyperpolarization) to −120 mV, followed by application of test pulses from −100 to +60 mV for 1 s in 10-mV steps. The inactivation ratio was measured as the ratio of the tail current level at 50 ms after onset of the test pulses over the theoretic peak tail amplitude, which was calculated by back-extrapolating the linear portion of the peak tail current. The inactivation ratio was plotted against the voltage of the test pulses.
To resolve the time-course of inactivation from deactivation, we chose to examine inactivation at voltages wherein the time-constants of deactivation and inactivation were most different. At the beginning of the third pulse, the hERG channels are mainly recovered from inactivation and in an open state. Thereafter, hERG currents simultaneously begin to deactivate and inactivate, depending on membrane potential. At potentials negative to EK, the current deactivates very rapidly. Even at voltages of −70 to −60 mV the kinetics of current decay are contributed by both deactivation and inactivation. To minimize the contribution of contamination by deactivation, we assessed the V0.3, a voltage where inactivation dominates. To extract a parameter to represent the voltage-dependence of inactivation (with little contamination of deactivation) in a large number of mutations channels, we used the V0.3 measurement. Another parallel measurement of the voltage-dependence of inactivation was used to validate the V0.3 metric of inactivation. The τ of inactivation process was plotted against voltage. Both measurements of voltage-dependence of inactivation are accurately parallel to each other.
Fast component of deactivation
Deactivation of hERG tail current was measured at −100 mV. To simplify the evaluation of the effect of NS1643, the tail current at −100 mV was fitted to the single exponential function,
in which τ is the characteristic time constant. A single exponential function fitted the tail current well. The coefficient of determination for the fit ranged from 0.98 to 0.99. Tail currents recorded at −50 mV are best fit to a biexponential model; accordingly, tail currents in this study were recorded at −100 mV, where deactivation can be adjusted to a single exponential (3).
Statistical analysis
The software STATSVIEW (Abacus Concepts, Berkeley, CA) was used to analyze the data. Data are presented as mean ± SE. An unpaired Student’s t-test was used to compare data, with a two-tailed P-value of 0.05 designated as being significant.
Modeling
A well-established five-state Markov model was used to describe gating of the WT-hERG channel (17,18). Electrophysiological measurements were used to fit the model rate constant parameters to account for the effects of a single point mutation (L529I) and drug application to WT and mutant forms of the hERG channel. In this study, the model parameters for the L529I mutant of hERG channel were obtained by fitting the respective averaged measured experimental data for deactivation (corresponding time constants), steady-state activation curve (V1/2 and k), and inactivation voltage relationships at 0.3 (V0.3).
WT hERG kinetic model
Kinetic modeling of hERG channels has a long history with several gating schemes proposed to date (18). Virtually all of them operate on the assumption of Markovian behavior in gating dynamics of hERG channels. The simplest and most accepted Markov model for WT-hERG in Wang et al. (17), is shown in Fig. 2. In this kinetic model of hERG, the terms Cx, O, and I represent closed states, open states, and inactivated states, respectively (x = 1, 2, or 3). The transitions between C2 → C1 and C1 → C2 are voltage-independent processes (ain and bin). The others are voltage-dependent transitions (ae, be, aa, bb, bi, and ai).
Figure 2.
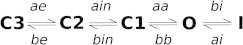
Proposed kinetic mechanism for WT hERG (17) showing the transition rates labels used in this work.
This model implies three closed (nonconducting) states and introduces a voltage-insensitive transition required to account for activation. Several lines of experimental studies showed that there is a possible transition between the closed directly to inactivated state (20,21) and therefore the original Rasmusson model from Wang et al. (17) is incomplete. However, in all these models transitions between closed and inactivated states are assumed to be a low probability transition and thus considered negligible (22).
The IKr current is given by the equations
| (2) |
and
| (3) |
where gKr0 = 0.024 pA/pF/mV, a = 1/35 K−1, b = −55/7, and pO is the open probability resulting from the model above. State probabilities are found by solving the first-order differential equations system that corresponds to the kinetics mechanism shown in Fig. 2.
Rate constants formulation
If a kinetic network with several states is considered, then the transition rates (k) corresponding to the transition i between pairwise states of the system can be written in Eyring-like kinetic relationships (23,24) to describe hERG gating,
| (4) |
or
| (5) |
where T is the absolute temperature, V is the voltage across the membrane, ΔS is the change in entropy, ΔH is the change in enthalpy, and zi is the effective valence of moving charges.
This type of model assumes that the gating of ion channels operates through successive conformational changes of the protein. The rate of the transition depends exponentially on the free energy barrier between the states.
According to this linear thermodynamic model, the free energy change of the transition i can be written as
| (6) |
where
The constant Ai corresponds to the free energy that is independent of the electric potential, and the linear term BiV encompasses the effect of the external electrical potential on the system.
The transition rate (ki) in Eq. 5 can be rewritten in a simplified form as
| (7) |
where
and V is the external electric potential in millivolts.
The simple exponential voltage dependence of rate constants is often referred to as the linear thermodynamic model (25). Nonlinear thermodynamic models of different complexity are described in the literature to fit voltage-clamp data, especially in cases where linear models fail to account for activation kinetics. The rate constant for each step was previously derived by Fink et al. (25) using the latest comprehensive experimental data from Berecki et al. (26). The parameters were derived using data from hEK cells at room temperature and 37°C. The temperature dependence of hERG was modeled using data available from the literature for Q10 values for the various time constants based on voltage-step protocols (27). In this study, all the rate constants, extracted from the previous model (25), were used as initial guess values. Correction to individual parameters from Fink’s article (25) has been done to reproduce our hEK-cell measurements at room temperature (23°C). All fitted parameters for the kinetic mechanism considered can be found in Table 1 and Table S1 in the Supporting Material. Note that β was set to zero for transition rates ain and bin (Fig. 2), thus, these transitions are modeled as voltage-independent (17,27). The transitions between O and I are also dependent on extracellular potassium concentration [K+]0 (28). That dependence is accounted for by modifying the transition rate for inactivation (O → I, bi):
| (8) |
Table 1.
Parameters (Eq. 11) optimized at room temperature for WT (all unconstrained) and L529I-hERG (Set A) using the Rasmusson kinetic model from Wang et al. (17)
| Transition description | Label | WT |
L529I |
Fitting set |
|||||||
|---|---|---|---|---|---|---|---|---|---|---|---|
| α (ms−1) | β (mV−1) | a | b |
A |
B |
C |
|||||
| α | β | α | β | α | β | ||||||
| C3 → C2 | ae | 0.0867 | 0.0212 | 2.13 | 1.00 | U | F | U | F | F | F |
| C2 → C3 | be | 0.0360 | −0.0734 | 1.02 | 0.62 | U | U | U | F | F | F |
| C2 → C1 | ain | 0.0102 | — | 0.61 | 1.00 | U | — | U | — | F | — |
| C1 → C2 | bin | 0.0299 | — | 1.03 | 1.00 | U | — | U | — | F | — |
| C1→ O | aa | 0.0116 | 0.0438 | 6.00 | 1.17 | U | U | U | F | U | F |
| O → C1 | bb | 0.000136 | −0.0418 | 1.23 | 1.00 | U | F | U | F | U | F |
| O → I | bi | 0.125 | 0.0231 | 0.90 | 1.00 | U | F | U | F | U | F |
| I → O | ai | 0.00364 | −0.0327 | 1.05 | 1.00 | U | F | U | F | F | F |
| F value | 2.83 × 10⁻⁶ | 4.67 × 10⁻⁶ | |||||||||
Experimental data obtained from hEK cells at room temperature. Underlined numbers are fixed values. U, unconstrained; F, fixed.
Optimization procedure
The model parameters were optimized to reproduce macroscopic currents guided by the data recorded at room temperature for hEK cells. All computations were done using two approaches that allow simultaneous optimization of different numbers of voltage-clamp (VC) protocols.
-
1.
MATLAB (R2011a) and C/C++ code. The optimization algorithm used is the FMINSEARCH MATLAB function (Nelder Mead Simplex method) with bound constraints by transformation.
-
2.
A C++ code developed with parallel capabilities. The optimization algorithm used is PRAXIS (29) with constraints.
In both cases, differential equations from the Markov model are solved numerically by the Runge-Kutta algorithm (fourth order, with an integration time step of 0.01 ms). The VC step protocols are coded to match the voltage-time function from the experimental protocol (details in the Supporting Material). The total cost function (F) is defined as the summation of n partial cost functions (fi) obtained from each VC protocol (Eq. 9), where n is the number of protocols considered, x1,…,xm are the parameters to be adjusted, and m is the total number of parameters considered:
| (9) |
The term fi is computed as the mean-square deviation of the simulated and experimental data. This relation is shown in Eq. 10, where l is the number of data points considered and y is the absolute experimental or simulated value considered:
| (10) |
The total cost function is then minimized using the optimization algorithm by varying the kinetic parameters until converged to a given value of tolerance.
We performed a convergence analysis on the cost function (F) and all its terms (fi) (Eq. 10). The analysis consisted in the numerical computation of the first and second derivatives of F and fi as a function of all adjusted parameters (x1,…,xm). The procedure involved the computation of a vector and a matrix. The vector was constructed by computing all the cost functions while varying by 0.01 each parameter around the optimized value. In the same way, the matrix was built by changing two parameters at a time. Subsequently, a system of linear equations was solved to obtain the parameters for a second-order Taylor polynomial of several variables. The first derivative terms account for the convergence of the cost function for each parameter. The self-second derivative terms provides information about the sensitivity of the cost functions to each parameter. The cross-second derivative terms account for the dependence of pairwise parameters and can be used to distinguish redundant parameters. All these terms together provides information about the completeness of the experimental data set to be univocally described by the kinetic parameters of the proposed test mechanism.
Wild-type
Simulated steady-state activation curve and deactivation time-course closely fit the observed experimental data for WT using both codes (Table S1 and Fig. S1 in the Supporting Material). The hybrid MATLAB/C code uses the same optimization algorithm that was used in Fink et al. (25) (with the Nelder Mead Simplex method), while the C++ code uses a different one (PRAXIS). The total cost function minimization seems to be improved with the second one. The parallel capability of the optimized pure C++ code allows for faster minimization procedures. Table 1 shows the corrected α- and β-parameters for WT rate constants according to Eq. 7. Despite some differences in the initial parameters, the simulated and measured currents are in excellent agreement (see current traces in Fig. 4). It is important to note that the parameter set is not unique but can be sufficiently constrained by the experimental data used. A large and diverse data training set ensures a robust set of parameters sufficient for accurate description of hERG gating in good accord with previous studies (18,23). Sensitivity and convergence analysis was done for the fitting. We found that all parameters were well converged except for the parameters associated with the deactivation rate (4). The sensitivity of the cost function to this parameter is low compared to the rest, which may indicate that additional data is required to improve the convergence of this step.
Figure 4.
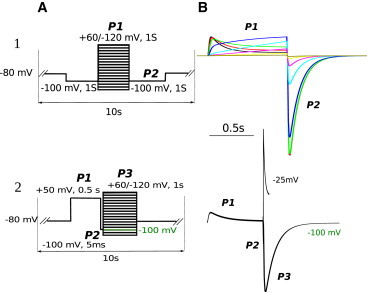
Simulations after fitting to the experimental data for the two different voltage-clamp protocols for WT hERG at room temperature. (A) Voltage protocols (1,2) used in the experiment and coded for simulations. (B) (Top) Superimposed simulated current traces at voltages −50, −40, −30, −20, 0, 20, 30, and 40 mV elicited by voltage-clamp protocol 1 and used to build the steady-state activation curve. (Bottom) Simulated current traces −25 (up to 50 ms) and −100 mV elicited by voltage-clamp protocol 2 and used to study the deactivation at −100 mV and V0.3. To see this figure in color, go online.
L529I and NS1643 effect
A group of different fit results was obtained by using a diverse set of constrained and unconstrained parameters during the optimization procedure. The purpose of this strategy is to identify the minimal key parameters required to reproduce the experimental behavior. The cost function absolute value and the sensitivity of the function to each parameter for every VC protocol were monitored to assess the success of the fit. From the group of different fit results, the best three sets of constrained and unconstrained parameters (A, B, and C) were selected (Table 1) and shown together with F. The effect of the drug and mutation were evaluated by introducing two correction terms, a and b, to α- and β-parameters, respectively (Eq. 11). During the optimization, α and β were set constant, and a and b were varied:
| (11) |
For the effect of the drug, a new kinetic mechanism was proposed and evaluated during the fit. In this explicit modeling of the drug, rates constants involved with the states without the drug were fixed for WT and for L529I (rates in Table 1). The drug binding kon and koff were constrained by the upper- and lower-bound experimental estimates of the equilibrium dissociation constant (Kd) to the open and closed states of the channel. The experimental values of Kd are in the range of 1–20 μM (30,31); these values may reflect a weighted average of the affinity for the closed and open states dependent on the relative rates of transitions between the states and the drug binding and unbinding rates. Different values for Kd-Open and Kd-Closed in the range of the experimental findings were tested. kon (μM−1 ms−1) for open and closed states were set at the same guessed value and constrained to a range of 0.5 × 10⁻² to 5.0; koff (ms−1) values for open and closed states were constrained by Kd-Open and Kd-Open, respectively. The selected fits contain the minimum number of parameters needed to achieve the best F value.
Results and Discussion
In vitro electrophysiology results
Ion currents conducted by WT hERG and L529I-hERG channels expressed in hEK cells were recorded using the voltage-clamp protocols described in the Materials and Methods. The detailed experimental evaluation of WT and L529I gating kinetics are published by our group in a companion article (14). The effects of the drug NS1643 on the hERG channel and L529I mutant using the steady-state activation protocol are shown in Fig. 3. In both cases, the drug application caused an increase in the magnitude of the tail current, a left shift in the voltage dependence of activation for WT, and a substantial slope decrease in the case of the mutant without shifting the V1/2. A right-shift of the inactivation curve (measured as V0.3) and a slowing of fast component of deactivation τ (predominant component at −100 mV) was found for both WT and mutant (3) (Table 2).
Figure 3.
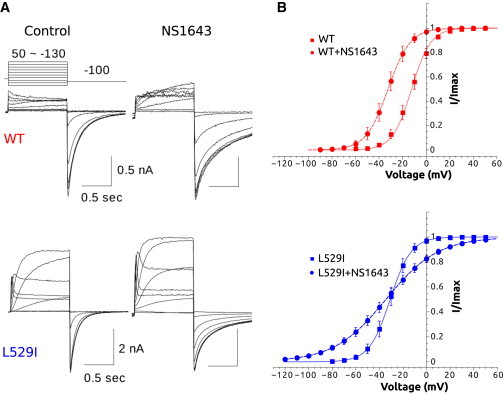
Experimental characterization of the effects of NS1643 on the voltage dependence of activation for WT and L529I mutant hERG channel expressed in hEK cells at room temperature. (A) Representative current traces elicited by the voltage-clamp protocol depicted (top) for both WT and the L529I mutant, and the control and NS1643 effect. (B) Steady-state activation experimental data control/NS1643 (red squares, red circles, respectively) application (10 μM) for WT hERG (top) and control/NS1643 (blue squares, blue circles, respectively) application for L529I mutant. To see this figure in color, go online.
Table 2.
Experimental data for hEK cells at room temperature
| Cells | Activation V1/2 and k (mV) | V0.3 inactivation (mV) | Deactivation, τFast (ms) |
|---|---|---|---|
| WT | −12.4 ± 2.3 (n = 10); 8.1 ± 0.2 (n = 10) | −25.0 ± 3.5 (n = 6) | 129.06 ± 13.3 (n = 9) |
| WT + NS1643 | −32.4 ± 3.5 (n = 10); 9.4 ± 0.3 (n = 10) | −18.6 ± 3.7 (n = 6) | 263.71 ± 30.7 (n = 9) |
| L529I | −30.8 ± 2.6 (n = 25); 8.9 ± 0.4 (n = 25) | −22.6 ± 2.9 (n = 11) | 104.10 ± 9.6 (n = 18) |
| L529I + NS1643 | −34.4 ± 3.7 (n = 25); 22.1 ± 1.5 (n = 25) | −12.0 ± 4.3 (n = 11) | 189.02 ± 10.3 (n = 18) |
Each value is an average of n experiments. Equation 1 was used to obtain V1/2 and k; data are presented as mean ± SE.
Concentration-response relationships for tail current amplitude and deactivation were found to have a biphasic nature in a previous study (12). This is in agreement with the proposed dual-mode of action for other channel activators (11), which may act as blockers at high concentrations. The biphasic nature of the concentration-response relationships found for NS1643 makes rigorous experimental fitting problematic. In all the subsequent in vitro studies, a drug concentration of 10 μM was used. This test concentration produces markedly evident changes in the electrophysiological metrics considered in this study (Table 2).
Kinetic modeling of WT and L529I
We initially fitted the kinetic model used for WT hERG (Fig. 2) to the experimental data. All transition rates were written using Eq. 7. Fink’s values for α- and β-parameters were used as an initial guess. Parameters were varied until F was minimized. At this point, the simulated observed rates of deactivation, the steady-state activation parameters, and the V0.3 value of WT matched the experimental data. Fig. 4 and Fig. S1 show that the current traces, the simulated steady-state activation curve, and deactivation time course closely fit the observed experimental data for WT. We next investigated whether this model could be extended to assess the gating measurements for the L529I mutant. Table 1 shows the best fit obtained for WT and L529I. Other optimizations resulting from different combinations of constrained and unconstrained parameters are shown in Table S2.
As already mentioned in Materials and Methods, three different arrangements of constrained and unconstrained parameters (A–C) were selected (Table 1) and shown in Fig. 5. As it can be seen from Table S2, the quality of the fit is slightly increased when some of the voltage-dependent parameters are allowed to vary, especially the transition rate “be” (A). Similar fit quality could also be obtained keeping fixed all voltage-dependent parameters (B), suggesting that the transition’s voltage dependence is almost the same as that of the WT. Set C shows that fixing the closed state transition reduces the quality of the fit. Simulated current traces at 0 and −20 mV show an increase in the current tail amplitude, compared to WT, and a slightly faster decay for deactivation at −100 mV (Fig. 5).
Figure 5.
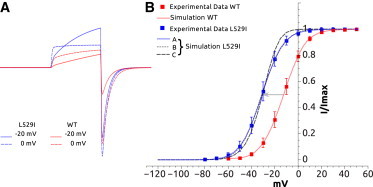
Modeling of L529I hERG mutant. (A) Superimposed simulated current traces for voltages 0 and −20 mV for WT (red) and L529I mutant (blue, scheme A). Currents were elicited by voltage-clamp protocol 1, shown in Fig. 4. (B) Steady-state activation simulated curve for WT (solid red line) and L529I (sets A, B, and C in solid blue, dotted gray, and slashed gray lines, respectively). WT and L529I experimental data (red and blue squares, respectively). To see this figure in color, go online.
According to set A (best fit), the modeling suggests that L529I mutation increases activation rates (steps ae, aa). This mutation appears to slightly reduce the inactivation rate while not affecting recovery from inactivation. The voltage-insensitive steps seem to be slightly affected, and a very good fit could be obtained by keeping them fixed (Table S2 and Set B in Table 1).
Taking all data together, these results suggest that the L529I mutant stabilizes an open state of the channel by mainly increasing activation rates, slightly affecting the voltage insensitive steps, and without affecting the voltage dependence of the transitions to the open state.
Modeling the effect of NS1643 drug on WT and L529I
Experiments show that the NS1643 drug shifts the V1/2 of activation by −20 ± 6 mV in WT hERG without alteration of the slope of the current voltage relationship (Fig. 3 B). The V1/2 of activation of the drug-free L529I hERG is similar to the WT with drug. However, after adding the drug, the slope of the current-voltage relationship is significantly and substantially flattened while the V1/2 is almost unchanged. Experimental data indicate that NS1643 significantly alters a transition in the pathway to activation in L529I (Fig. 3 B, bottom).
There are limited data available about the NS1643 binding to hERG (2,31). These data come from site-directed mutagenesis, voltage-clamp assays, and molecular modeling using homology models. The binding site on hERG was proposed previously to be located on the outside of the channel based on several findings (31). Grunnet et al. (32) used a homology model of the channel pore and proposed a site located within S5 and S6 of adjacent subunits. Recently, several lines of evidence implicate the region formed by residues from interhelical contacts of the voltage-sensor domain (VSD) at the interface between helices S1, S2, S3, S4, and S5 of the adjacent subunit (33). This site was partially described and labeled as “IC2” in the previous study by Durdagi et al. (12) using a homology model for the open state hERG. It was more carefully explored recently with the L529I mutant (14) (Fig. 1). To study the effects of the drug, different models that include two populations of hERG channels in drug-free and drug-bound states were considered (Fig. 6). Transition rates between drug-free states were fixed to previously obtained values (Table 1). When transition rates of drug-bound states were fixed, the same drug-free transition rate values from Table 1 are used. Table 3 shows the parameters optimized for the best fits. Table S3 shows other mechanisms considered, the effect of changing Kd-Open/Kd-Closed, and the effect of considering different number of parameters in the fit.
Figure 6.

Kinetic models of hERG channel gating modified by NS1643. Different Markov models representing populations of hERG channels in drug-free and drug-bound (highlighted in cyan) states are labeled as M1–M8. Transitions between the sections were described with an estimation of the equilibrium dissociation constant Kd = koff/kon. Mechanisms that were able to reproduce the drug’s effects on the kinetics are highlighted (gray) (M1–M5). To see this figure in color, go online.
Table 3.
Correction to WT and L529I α, β-parameters obtained after the fitting procedure for NS1643 effect using the different mechanisms depicted in Fig. 6
| Transition description | Label | M1 |
M2 |
M3 |
M4 |
||||
|---|---|---|---|---|---|---|---|---|---|
| a | b | a | b | a | b | a | b | ||
| WT + NS1643 | |||||||||
| C3D → C2D | aed | 1.54 | 1.00 | 0.76 | 1.00 | 1.62 | 1.00 | 1.02 | 1.00 |
| C2D → C3D | bed | 0.36 | 1.00 | 0.055 | 1.00 | 0.22 | 1.00 | 0.15 | 1.00 |
| C2D → C1D | aind | 0.32 | — | 1.66 | — | 1.39 | — | 1.51 | — |
| C1D → C2D | bind | 0.083 | — | 1.13 | — | 1.09 | — | 1.00 | — |
| C1D → OD | aad | 2.30 | 0.59 | 1.32 | 0.39 | 1.32 | 0.61 | 1.36 | 0.59 |
| OD → C1D | bbd | 0.71 | 1.00 | 0.48 | 1.00 | 0.42 | 1.00 | 0.43 | 1.00 |
| OD → ID | bid | 0.62 | 1.00 | 0.61 | 1.00 | 0.61 | 1.00 | 0.61 | 1.00 |
| ID → OD | aid | 1.00 | 1.00 | 1.00 | 1.00 | 1.00 | 1.00 | 1.00 | 1.00 |
| O + D → OD | kon_Oa | — | 4.4 × 10⁻¹ | 3.20 × 10⁻¹ | 1.00 × 10⁻² | ||||
| C + D → CD | kon_Ca | 2.44 | 1.1 × 10⁻¹ | 9.7010−1 | 1.00 × 10⁻² | ||||
| OD ↔ O + D | Kd_Ob | — | 3.07 | 3.11 | 3.05 | ||||
| CD ↔ C + D | Kd_Cb | 9.46 | 7.06 | 12.6 | 6.25 | ||||
| F value | 1.43 × 10⁻⁵ | 1.55 × 10⁻⁶ | 2.76 × 10⁻⁵ | 2.74 × 10⁻⁶ | |||||
| L529I + NS1643 | |||||||||
| C3D → C2D | aed | 0.79 | 1.14 | 9.9 | 0.57 | 4.71 | 0.78 | 6.47 | 0.61 |
| C2D → C3D | bed | 0.42 | 4.13 × 10⁻⁸ | 1.49 × 10⁻² | 1.10 | 6.73 × 10⁻³ | 0.96 | 1.27 × 10⁻⁵ | 1.50 |
| C2D → C1D | aind | 0.16 | — | 0.15 | — | 0.28 | — | 0.16 | — |
| C1D → C2D | bind | 0.45 | — | 0.69 | — | 0.76 | — | 1.06 | — |
| C1D → OD | aad | 1.00 | 0.71 | 0.56 | 0.56 | 0.48 | 0.65 | 1.83 | 0.52 |
| OD → C1D | bbd | 0.81 | 0.90 | 0.81 | 0.85 | 0.76 | 0.83 | 0.81 | 0.83 |
| OD → ID | bid | 0.60 | 1.00 | 0.56 | 1.00 | 0.55 | 1.00 | 0.56 | 1.00 |
| ID → OD | aid | 1.00 | 1.00 | 1.00 | 1.00 | 1.00 | 1.00 | 1.00 | 1.00 |
| O + D → OD | kon_Oa | — | 1.00 × 10⁻² | 1.17 × 10⁻² | 1.01 × 10⁻² | ||||
| C + D → CD | kon_Ca | 1.00 × 10⁻² | 1.00 × 10⁻² | 1.06 × 10⁻² | 1.00 × 10⁻² | ||||
| OD ↔ O + D | Kd_Ob | — | 9.76 | 10.12 | 9.94 | ||||
| CD ↔ C + D | Kd_Cb | 2.53 | 1.34 | 0.075 | 2.21 | ||||
| F value | 4.10 × 10⁻⁴ | 2.57 × 10⁻⁴ | 2.41 × 10⁻⁴ | 1.28 × 10⁻⁴ | |||||
Experimental data obtained from hEK cells at room temperature. Underlined numbers are fixed values. Kd_C and kon_C are assumed to be the same for all closed states.
Units in μM−1 ms−1.
Units in μM.
From all the mechanisms tested (Fig. 6), mechanisms M2 or M4 appear to provide the best fit for WT. The mechanism M4 appears to be, simultaneously, the simplest and the most accurate (Fig. 7 A). The experimental data can also be fitted reasonably well to M1 where the drug binds just to the C3 state. However, under this mechanism, unlike the others, the rates for aind and bind are considerably lower. Fig. S2 shows that while M2 and M4 display a similar current trace for protocol 1 (Fig. 4 A), M1 is quite different. The mechanisms M3 and M5 (Fig. 6) allows a good fit but the quality is inferior to M2 and M4. To further test how NS1643 is affecting the early states, we considered mechanisms M6–M8, where no binding was considered to C3. From these options, only M6 showed some small success in reproducing the gating behavior (Fig. 7 A). The other ones were not able to successfully adjust the experimental data. These results highlight the importance of the drug binding to the C3/C2 states, although with less affinity compared to the open state.
Figure 7.

Simulated steady-state activation curves using the different mechanisms for the NS1643 effect on WT and the L529I mutant. (A) Simulated curves after fitting to experimental data using different mechanisms (M1, M2, M3, M4, and M6) for WT. (B) Simulated data after fitting to experimental data using different mechanisms (M1, M2, M3, M4, and M6) for L529I. Experimental steady-state activation data for NS1643 effect is shown in red circles for WT and blue circles for L529I. To see this figure in color, go online.
In the case of the L529I mutant, the quality of the fit was worse compared to WT. In this case, obtaining a good fit is challenging (Table 3). The fit is highly improved by including the variation of the β-parameters, especially the ones associated with the activation and deactivation transitions (Table 3). In this case, M1–M4 were all able to fairly reproduce the experimental behavior. It is interesting to note that, in this case, the model suggests much higher affinity for the closed state compared to the open (the opposite to WT). Indeed, M6 showed a very bad fit to the experimental data, pointing to the fact that binding to early closed states is of key importance in the case of the L529I mutant. As found for WT, M7 and M8 were not able to fit the experimental data.
Based on this parametric study, we propose that M4 is a mechanism of choice to rationalize the effect of NS1643 on hERG channel gating (Fig. 8). In this mechanism, we propose that the NS1643 drug binds to closed (C3 and C2) and open (O) states but with different affinities (i.e., the state-dependent binding mode). The parametric study within the proposed mechanism M4 allows for testing several ratios and orders of magnitudes for Kd-Open and Kd-Closed and different number of parameters (Table S3). In the case of WT, the model suggests that the activator’s binding affinity for open state seems to be higher than for the closed state. Importantly, for L529I, most of the voltage-dependent parameters were reduced and the non-voltage-dependent rates (ain and bin) were considerably diminished. In this case, activator-binding affinity seems to be much higher for the closed state and higher compared to WT. However, the binding affinity for the open state seems to be lower compared to WT. While experimental data on activator-state-dependent binding to WT and L529I hERG is unavailable, the kinetic analysis on the performed experiments suggests that the L529I mutation results in a higher affinity for NS1643 binding to the closed state, but not for the open one.
Figure 8.
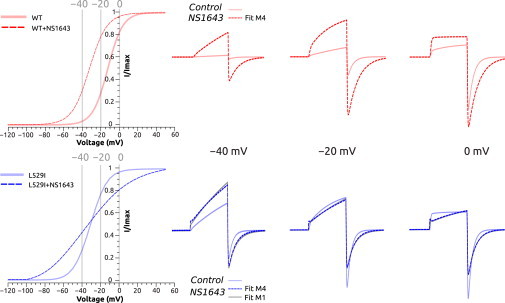
Selected simulated current traces for mechanism M4 for WT (top) and mechanisms M4 and M1 for L529I (bottom). Voltages −40, −20, and 0 mV were selected from the simulated steady-state activation curve for WT and L529I mutant: control (solid line) and NS1643 effect (dashed lines). Simulated current traces elicited by voltage-clamp protocol 1 (shown in Fig. 4) at the selected voltages for the two fits. To see this figure in color, go online.
Conclusions
There are a few studies about the mechanism of action of NS1643. Casis et al. (11) reported that NS1643 activates hERG channels expressed in Xenopus oocytes in a concentration- and voltage-dependent manner and strongly affects channel inactivation by shifting the voltage-inactivation curve by +35 mV at 30 μM. They also found that NS1643 binding produced minimal effects on the activation of the channel. However, Durdagi et al. (12) and Xu et al. (31), in agreement with this work, report that NS1643 can also left-shift the voltage-dependent activation curve and reported a lower effect on inactivation, depending on the drug concentration.
Here, we propose a kinetic model for the effects of NS1643 using our recently published experimental and molecular modeling data for WT hERG and L529I mutant (14). In that work, experimental data from voltage-clamp fluorimetry and biophysical experiments, together with molecular modeling, is provided. These data suggest that the presence of NS1643 within its binding pocket alters mainly activation and deactivation gating of hERG channels by directly modifying voltage-sensor transitions. From a structural point of view, L529I mutation affects the packing of the VSD of hERG, probably destabilizing the closed state and favoring the transition to open state (14). As it can be seen in Fig. 9, molecular dynamics simulations using the homology models for open and closed hERG show that the main effect of the mutation is to change the structure of the S4 helix, resulting in a kink that compromises the VSD packing and probably affects the NS1643 affinity for the binding site.
Figure 9.
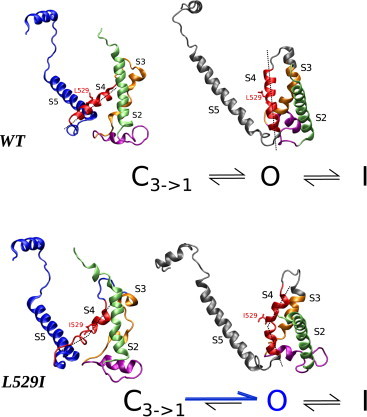
Effect of the L529I mutation on hERG’s VSD structure. The S4 helix (in red) structure in WT (top) and the L529I mutant (bottom) in closed and open states of hERG homology models. Only one hERG subunit is shown; the S1 segment is omitted for clarity. To see this figure in color, go online.
Based on these experimental and molecular modeling results, the major findings of the kinetic modeling can be summarized as follows:
-
1.
The analysis of the experimental data and its interpretation within a kinetic scheme led to the conclusion that the L529I mutation leads to a more favorable channel opening with minimal effect on the rate’s voltage dependence. This finding is in agreement with the molecular modeling observation that the kink in the S4 helix produced as a consequence of the mutation might destabilize the closed state, favoring the opening of the channel (Fig. 9).
-
2.
Combined kinetic modeling and experimental data indicate that the activator binding substantially alters the transitions in the pathway to activation. The modeling suggests that, in the case of the mutant, voltage dependence of the transitions is strongly compromised together with the cooperativity on the path to the activation. Our results on NS1643 indicate that the drug should bind at least to the closed (C3, C2) and open (O) states of the kinetic model, to correctly reproduce experimental data for both WT and L529I mutant. Therefore, we propose that NS1643 is affecting early transitions during movements of the voltage sensor, which precedes the opening of the activation gate. In previous modeling works on WT, NS1634 was suggested to have minimal effect on the channel kinetics (11,34,35), while another study modeled the drug as affecting the late activation step together with inactivation and deactivation (31). Concerning this last study, we tested this possibility in our fitting schemes (mechanisms M6–M8) without success. However, including the rates for early activation steps clearly improved the results for both studied systems.
-
3.
The binding of the NS1643 activator to the mutant channel results in a dramatic perturbation of the gating kinetics. This prediction highlights the importance of the NS1643 binding site in the neighborhood of the L529 residue, which was reported previously by docking studies (12). This binding site lies within the interface between helices S1, S2, S3, S4 (where the mutation lies), and S5 of the adjacent subunit. Docking calculations showed three possible binding sites in the vicinity of L529 for the open state, all of them with almost the same predicted binding affinity (Figs. 1 and S3). It is possible that this particular residue may not interact directly with the drug, but still affect the drug binding by promoting a change in the binding site due to the structural change in S4 and the packing of the VSD. Following this hypothesis, NS1643 may have different affinity for the site and be able to induce greater conformational change than in WT channels, affecting the gating properties in a more profound way.
In conclusion, in contrast to a previously suggested mechanism of action for NS1643, we propose that the NS1643 activator binds to the early closed states and to the open state with different affinities. The modeling for the activator effect of NS1643 on the mutant clearly shows, contrary to what is observed for WT, that NS1634 is attenuating the voltage dependence of the transitions to the open state. It is also affecting the cooperativity of the transitions to open state and highlighting the importance of this binding site for future drug designs based on the NS1643 structure as a template.
The aim of the modeling presented here was to shed light on the mechanism of action of the NS1643 activator on the Kv11.1 (hERG) channel. The drug effect on the L529I mutant provided valuable information on its mechanism of action and the molecular features of the binding site. We should emphasize that the modeling done here pertains to the ion-channel level and is not able to address the antiarrhythmic versus proarrhythmic behavior of the NS1643 activator, which is beyond the scope of this work. However, the Markovian models presented here for the NS1643 activator would be of considerable value to study the effect of the drug at the cellular and tissue levels (36) by using the available mathematical models for the human cardiac cell (37,38). Furthermore, these Markovian models provide a more detailed alternative than the commonly used Hodgkin-Huxley formulation of the IKr current.
Acknowledgments
This work was supported by the Canadian Institutes of Health Research (grant No. 201103MOP-CSA-244888 to S.Y.N. and H.J.D.), and the Heart and Stroke Foundation of Alberta (grants No. 2010HSF-2013DUFF and No. 2011HSF-2014NOSKOV to H.J.D. and S.Y.N.). S.Y.N. is an Alberta Heritage Foundation for Medical Research Scholar. H.J.D. is an Alberta Heritage Foundation for Medical Research Medical Scientist. The computational support for this work was provided by West-Grid Canada through a resource allocation award to S.Y.N. C.E.C. was supported by the American Heart Association (GIA grants No. 10GRNT3880050 and No. 13GRNT14370019), Western States Affiliate; the Alfred P. Sloan Foundation; and the National Institutes of Health (grant No. NHLBI RO1-HL-085592).
Contributor Information
Colleen E. Clancy, Email: ceclancy@ucdavis.edu.
Henry J. Duff, Email: hduff@ucalgary.ca.
Sergei Y. Noskov, Email: snoskov@ucalgary.ca.
Supporting Material
References
- 1.Sanguinetti M.C., Jiang C., Keating M.T. A mechanistic link between an inherited and an acquired cardiac arrhythmia: hERG encodes the IKr potassium channel. Cell. 1995;81:299–307. doi: 10.1016/0092-8674(95)90340-2. [DOI] [PubMed] [Google Scholar]
- 2.Zhou P.Z., Babcock J., Gao Z.B. Activation of human ether-à-go-go related gene (hERG) potassium channels by small molecules. Acta Pharmacol. Sin. 2011;32:781–788. doi: 10.1038/aps.2011.70. [DOI] [PMC free article] [PubMed] [Google Scholar]
- 3.Vandenberg J.I., Perry M.D., Hill A.P. hERG K+ channels: structure, function, and clinical significance. Physiol. Rev. 2012;92:1393–1478. doi: 10.1152/physrev.00036.2011. [DOI] [PubMed] [Google Scholar]
- 4.Perrin M.J., Subbiah R.N., Hill A.P. Human ether-à-go-go related gene (hERG) K+ channels: function and dysfunction. Prog. Biophys. Mol. Biol. 2008;98:137–148. doi: 10.1016/j.pbiomolbio.2008.10.006. [DOI] [PubMed] [Google Scholar]
- 5.Vandenberg J.I., Torres A.M., Kuchel P.W. The hERG K+ channel: progress in understanding the molecular basis of its unusual gating kinetics. Eur. Biophys. Lett. 2004;33 doi: 10.1007/s00249-003-0338-3. 468–468. [DOI] [PubMed] [Google Scholar]
- 6.Trudeau M.C., Warmke J.W., Robertson G.A. hERG, a human inward rectifier in the voltage-gated potassium channel family. Science. 1995;269:92–95. doi: 10.1126/science.7604285. [DOI] [PubMed] [Google Scholar]
- 7.Numaguchi H., Mullins F.M., Balser J.R. Probing the interaction between inactivation gating and dd-sotalol block of hERG. Circ. Res. 2000;87:1012–1018. doi: 10.1161/01.res.87.11.1012. [DOI] [PubMed] [Google Scholar]
- 8.Clancy C.E., Kurokawa J., Kass R.S. K+ channel structure-activity relationships and mechanisms of drug-induced QT prolongation. Annu. Rev. Pharmacol. Toxicol. 2003;43:441–461. doi: 10.1146/annurev.pharmtox.43.100901.140245. [DOI] [PubMed] [Google Scholar]
- 9.Lu H.R., Vlaminckx E., Gallacher D.J. Predicting drug-induced changes in QT interval and arrhythmias: QT-shortening drugs point to gaps in the ICHS7B Guidelines. Br. J. Pharmacol. 2008;154:1427–1438. doi: 10.1038/bjp.2008.191. [DOI] [PMC free article] [PubMed] [Google Scholar]
- 10.Kannankeril P., Roden D.M., Darbar D. Drug-induced long QT syndrome. Pharmacol. Rev. 2010;62:760–781. doi: 10.1124/pr.110.003723. [DOI] [PMC free article] [PubMed] [Google Scholar]
- 11.Casis O., Olesen S.P., Sanguinetti M.C. Mechanism of action of a novel human ether-à-go-go-related gene channel activator. Mol. Pharmacol. 2006;69:658–665. doi: 10.1124/mol.105.019943. [DOI] [PubMed] [Google Scholar]
- 12.Durdagi S., Guo J., Duff H.J. Structure-guided topographic mapping and mutagenesis to elucidate binding sites for the human ether-à-go-go-related gene 1 potassium channel (KCNH2) activator NS1643. J. Pharmacol. Exp. Ther. 2012;342:441–452. doi: 10.1124/jpet.111.189159. [DOI] [PubMed] [Google Scholar]
- 13.Grunnet M., Hansen R.S., Olesen S.P. hERG1 channel activators: a new anti-arrhythmic principle. Prog. Biophys. Mol. Biol. 2008;98:347–362. doi: 10.1016/j.pbiomolbio.2009.01.002. [DOI] [PubMed] [Google Scholar]
- 14.Guo J., Cheng Y.M., Duff H.J. An integrated approach to elucidate the mechanism of action of the hERG (KCNH2) activator, NS1643: novel binding site at the voltage sensor in the neighborhood of L529 and K525. Biophys. J. 2015;108:1400–1413. doi: 10.1016/j.bpj.2014.12.055. [DOI] [PMC free article] [PubMed] [Google Scholar]
- 15.Smith-Maxwell C.J., Ledwell J.L., Aldrich R.W. Uncharged S4 residues and cooperativity in voltage-dependent potassium channel activation. J. Gen. Physiol. 1998;111:421–439. doi: 10.1085/jgp.111.3.421. [DOI] [PMC free article] [PubMed] [Google Scholar]
- 16.Smith-Maxwell C.J., Ledwell J.L., Aldrich R.W. Role of the S4 in cooperativity of voltage-dependent potassium channel activation. J. Gen. Physiol. 1998;111:399–420. doi: 10.1085/jgp.111.3.399. [DOI] [PMC free article] [PubMed] [Google Scholar]
- 17.Wang S., Liu S., Rasmusson R.L. A quantitative analysis of the activation and inactivation kinetics of hERG expressed in Xenopus oocytes. J. Physiol. 1997;502:45–60. doi: 10.1111/j.1469-7793.1997.045bl.x. [DOI] [PMC free article] [PubMed] [Google Scholar]
- 18.Bett G.C.L., Zhou Q., Rasmusson R.L. Models of hERG gating. Biophys. J. 2011;101:631–642. doi: 10.1016/j.bpj.2011.06.050. [DOI] [PMC free article] [PubMed] [Google Scholar]
- 19.Piper D.R., Varghese A., Tristani-Firouzi M. Gating currents associated with intramembrane charge displacement in hERG potassium channels. Proc. Natl. Acad. Sci. USA. 2003;100:10534–10539. doi: 10.1073/pnas.1832721100. [DOI] [PMC free article] [PubMed] [Google Scholar]
- 20.Claydon T.W., Vaid M., Fedida D. A direct demonstration of closed-state inactivation of K+ channels at low pH. J. Gen. Physiol. 2007;129:437–455. doi: 10.1085/jgp.200709774. [DOI] [PMC free article] [PubMed] [Google Scholar]
- 21.Cheng Y.M., Claydon T.W. Voltage-dependent gating of hERG potassium channels. Front. Pharmacol. 2012;3:83. doi: 10.3389/fphar.2012.00083. [DOI] [PMC free article] [PubMed] [Google Scholar]
- 22.Kiehn J., Lacerda A.E., Brown A.M. Pathways of hERG inactivation. Am. J. Physiol. 1999;277:H199–H210. doi: 10.1152/ajpheart.1999.277.1.H199. [DOI] [PubMed] [Google Scholar]
- 23.Clancy C.E., Rudy Y. Cellular consequences of hERG mutations in the long QT syndrome: precursors to sudden cardiac death. Cardiovasc. Res. 2001;50:301–313. doi: 10.1016/s0008-6363(00)00293-5. [DOI] [PubMed] [Google Scholar]
- 24.Clancy C.E., Zhu Z.I., Rudy Y. Pharmacogenetics and anti-arrhythmic drug therapy: a theoretical investigation. Am. J. Physiol. Heart Circ. Physiol. 2007;292:H66–H75. doi: 10.1152/ajpheart.00312.2006. [DOI] [PMC free article] [PubMed] [Google Scholar]
- 25.Fink M., Noble D., Giles W.R. Contributions of hERG K+ current to repolarization of the human ventricular action potential. Prog. Biophys. Mol. Biol. 2008;96:357–376. doi: 10.1016/j.pbiomolbio.2007.07.011. [DOI] [PubMed] [Google Scholar]
- 26.Berecki G., Zegers J.G., van Ginneken A.C.G. hERG channel (dys)function revealed by dynamic action potential clamp technique. Biophys. J. 2005;88:566–578. doi: 10.1529/biophysj.104.047290. [DOI] [PMC free article] [PubMed] [Google Scholar]
- 27.Vandenberg J.I., Varghese A., Huang C.L.H. Temperature dependence of human ether-à-go-go-related gene K+ currents. Am. J. Physiol. Cell Physiol. 2006;291:C165–C175. doi: 10.1152/ajpcell.00596.2005. [DOI] [PubMed] [Google Scholar]
- 28.Yang T., Snyders D.J., Roden D.M. Rapid inactivation determines the rectification and [K+]o dependence of the rapid component of the delayed rectifier K+ current in cardiac cells. Circ. Res. 1997;80:782–789. doi: 10.1161/01.res.80.6.782. [DOI] [PubMed] [Google Scholar]
- 29.Brent R. Prentice Hall; Upper Saddle River, NJ: 1973. Algorithms for Minimization without Derivatives. [Google Scholar]
- 30.Larsen A.P., Bentzen B.H., Grunnet M. Differential effects of Kv11.1 activators on Kv11.1a, Kv11.1b and Kv11.1a/Kv11.1b channels. Br. J. Pharmacol. 2010;161:614–628. doi: 10.1111/j.1476-5381.2010.00897.x. [DOI] [PMC free article] [PubMed] [Google Scholar]
- 31.Xu X., Recanatini M., Tseng G.-N. Probing the binding sites and mechanisms of action of two human ether-à-go-go-related gene channel activators, 1,3-bis-(2-hydroxy-5-trifluoromethyl-phenyl)-urea (NS1643) and 2-[2-(3,4-dichloro-phenyl)-2,3-dihydro-1H-isoindol-5-ylamino]-nicotinic acid (PD307243) Mol. Pharmacol. 2008;73:1709–1721. doi: 10.1124/mol.108.045591. [DOI] [PMC free article] [PubMed] [Google Scholar]
- 32.Grunnet M., Abbruzzese J., Sanguinetti M.C. Molecular determinants of human ether-à-go-go-related gene 1 (hERG1) K+ channel activation by NS1643. Mol. Pharmacol. 2011;79:1–9. doi: 10.1124/mol.110.067728. [DOI] [PMC free article] [PubMed] [Google Scholar]
- 33.Perry M., Sachse F.B., Sanguinetti M.C. Structural basis of action for a human ether-à-go-go-related gene 1 potassium channel activator. Proc. Natl. Acad. Sci. USA. 2007;104:13827–13832. doi: 10.1073/pnas.0703934104. [DOI] [PMC free article] [PubMed] [Google Scholar]
- 34.Hansen R.S., Diness T.G., Grunnet M. Activation of human ether-à-go-go-related gene potassium channels by the diphenylurea 1,3-bis-(2-hydroxy-5-trifluoromethyl-phenyl)-urea (NS1643) Mol. Pharmacol. 2006;69:266–277. doi: 10.1124/mol.105.015859. [DOI] [PubMed] [Google Scholar]
- 35.Hansen R.S., Diness T.G., Grunnet M. Biophysical characterization of the new human ether-à-go-go-related gene channel opener NS3623 [n-(4-bromo-2-(1H-tetrazol-5-yl)-phenyl)-n′-(3′-trifluoromethylphenyl)urea] Mol. Pharmacol. 2006;70:1319–1329. doi: 10.1124/mol.106.026492. [DOI] [PubMed] [Google Scholar]
- 36.Peitersen T., Grunnet M., Olesen S.-P. Computational analysis of the effects of the hERG channel opener NS1643 in a human ventricular cell model. Heart Rhythm. 2008;5:734–741. doi: 10.1016/j.hrthm.2008.02.026. [DOI] [PubMed] [Google Scholar]
- 37.O’Hara T., Virág L., Rudy Y. Simulation of the undiseased human cardiac ventricular action potential: model formulation and experimental validation. PLOS Comput. Biol. 2011;7:e1002061. doi: 10.1371/journal.pcbi.1002061. [DOI] [PMC free article] [PubMed] [Google Scholar]
- 38.Romero L., Trenor B., Yang P.C., Saiz J., Clancy C.E. In silico screening of the impact of hERG channel kinetic abnormalities on channel block and susceptibility to acquired long QT syndrome. J. Mol. Cell Cardiol. 2014;72:126–137. doi: 10.1016/j.yjmcc.2014.02.018. [DOI] [PMC free article] [PubMed] [Google Scholar]
Associated Data
This section collects any data citations, data availability statements, or supplementary materials included in this article.