Abstract
INTRODUCTION:
Ventilator-associated pneumonia (VAP) is an important cause of mortality and morbidity in critically ill patients. We sought to determine the prognostic value of procalcitonin (PCT) and C-reactive protein (CRP) kinetics in critically ill patients who developed VAP.
METHODS:
Patients who were admitted to the intensive care unit (ICU) and developed VAP were eligible. Patients were followed for 28 days after the pneumonia diagnosis and blood samples for PCT and CRP were collected on the day of the pneumonia diagnosis (D0), and days 3 (D3) and 7 (D7) after the diagnosis. Patients were grouped as survivors and non-survivors, and the mean PCT and CRP values and their kinetics were assessed.
RESULTS:
In total, 45 patients were enrolled. Of them, 22 (48.8%) died before day 28 after the pneumonia diagnosis. There was no significant difference between the survivor and non-survivor groups in terms of PCT on the day of pneumonia diagnosis or CRP levels at any point. However, the PCT levels days 3 and 7 were significantly higher in the non-survivor group than the survivor group. Whereas PCT levels decreased significantly from D0 to D7 in the survivor group, CRP did not. A PCT level above 1 ng/mL on day 3 was the strongest predictor of mortality, with an odds ratio of 22.6.
CONCLUSION:
Serum PCT was found to be a superior prognostic marker compared to CRP in terms of predicting mortality in critically ill patients who developed VAP. The PCT level on D3 was the strongest predictor of mortality in VAP.
Keywords: Intensive care unit, pneumonia, procalcitonin, prognosis
Ventilator-associated pneumonia (VAP) is defined as pneumonia that occurs more than 48 hours after initiation of mechanical ventilation.[1] The mortality rate for VAP ranges from 30% to 70%.[2] For the prediction of outcomes in sepsis and VAP various substances, including procalcitonin (PCT) and C-reactive protein (CRP), have been evaluated as biomarkers of the prognosis and treatment response in patients with VAP.[3,4,5,6] Severe generalised bacterial infections with systemic manifestations are associated with increased serum levels of PCT. In contrast, viral infections, localized bacterial infections, or inflammatory reactions of non-infectious origin do not, or only moderately, increase PCT levels.[7,8] Some studies have described PCT as a predictor of severity in sepsis, antimicrobial efficacy, and hospital mortality.[2,9] In a prospective observational study, Luyt et al.,[10] investigated the prognostic value of PCT kinetics in patients with VAP and found that elevated serum levels of PCT on days 1, 3, and 7 of VAP were strong predictors of unfavourable outcomes. Another prospective observational study demonstrated that decreasing PCT and CRP values from VAP onset to day 4 of treatment were independent predictors of survival in patients with VAP.[11] In this study, we sought to assess the prognostic value of the kinetics of serum PCT and CRP levels in patients with VAP.
Methods
The study was performed in the respiratory, internal, and surgical intensive care units (ICUs) of Bulent Ecevit University Hospital, Zonguldak, Turkey, from November 2007 to December 2008.
All patients provided written informed consent. The study protocol was approved by the Local Ethics Committee of the university hospital. All patients who were admitted to the respiratory, internal, surgical ICUs with a diagnosis of other than pneumonia and then developed VAP during their ICU stay were eligible for this prospective observational study. Patients who were at least 18 years old and developed pneumonia at least 48 hours after ICU admission were included in the study. Patients who had an extrapulmonary infection focus and died before day 3 after the pneumonia diagnosis were excluded. Pneumonia was suspected when a patient developed a new or persistent radiographic infiltrate plus two of the following criteria:
Body temperature more than 38°C or less than 36°C,
White blood cell counts of >11.000 or <4.000/mm³, or
Macroscopically purulent tracheal aspirate.
Quantitative endotracheal aspirate (QEA) was obtained on the first day and was considered positive upon culture of >100.000 cfu/mL. We recorded the demographic and clinical data of the patients, such as age, gender, cause of ICU admission, comorbidities, and duration of mechanical ventilation before developing VAP. Chest X-ray, arterial blood gases, complete blood count, and CRP were obtained at the time that pneumonia was diagnosed (D0) and repeated on days 3 (D3) and 7 (D7). Acute Physiology and Chronic Health Evaluation II (APACHE II), Simplified Acute Physiology score II (SAPS II), and Sequential Organ Failure Assessment (SOFA) scores were calculated during the first 24 hours of ICU admission. Blood samples were collected for PCT on D0, D3 and D7. CRP was measured using a nephelometric assay. Serum samples were prepared after centrifugation and stored at −40°C. PCT was determined by an immunoluminometric assay (Brahms PCT Sensitive Cryptor, Brahms Diagnostika, Berlin, Germany) with an analytical sensitivity of 0.05 ng/mL. Patients were followed until day 28 after the diagnosis of pneumonia. Patients who died before day 28 were grouped as non-survivors and those who lived for at least 28 days after the pneumonia diagnosis or were discharged from the ICU were considered survivors. Empirical antibiotic treatment was started after samples were obtained and modified as necessary after the results of QEA became available.
Statistical analysis
The statistical package of social sciences (SPSS) software (ver. 18.0 for Windows) was used for all statistical analyses. PCT and CRP kinetics were analysed by using the non parametric Mann-Whitney U-test. Descriptive statistics of variables were given as means ± standard deviation (SD). The intergroup comparisons of frequencies and percentages were made using the chi-square test and Fisher's exact test. A receiver operator characteristic (ROC) curve analysis was used to evaluate the predictive performance of PCT and CRP for mortality, providing the best cut-off value and the areaunder the ROC curve (AUC) values for mortality as well as sensitivity and specificity values. Binarylogistic regression analysis with enter method was performed to determine for risk factors of mortality. Results are given with 95% confidence intervals (CI) and P values <0.05 were considered to indicate statistical significance.
Results
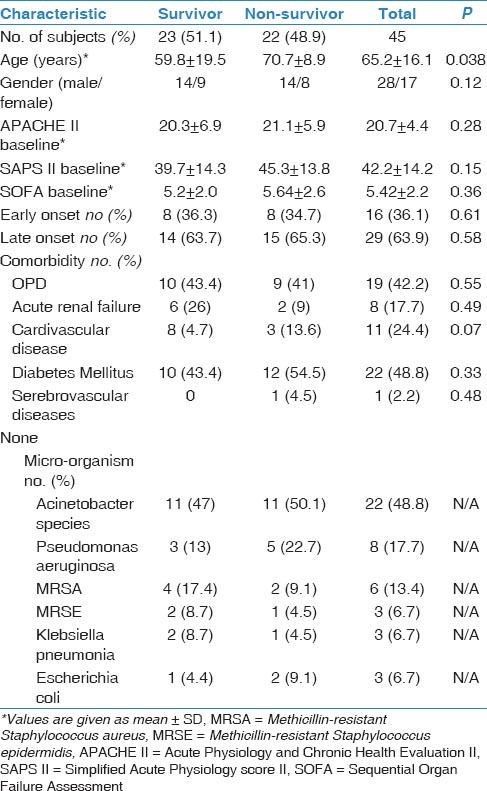
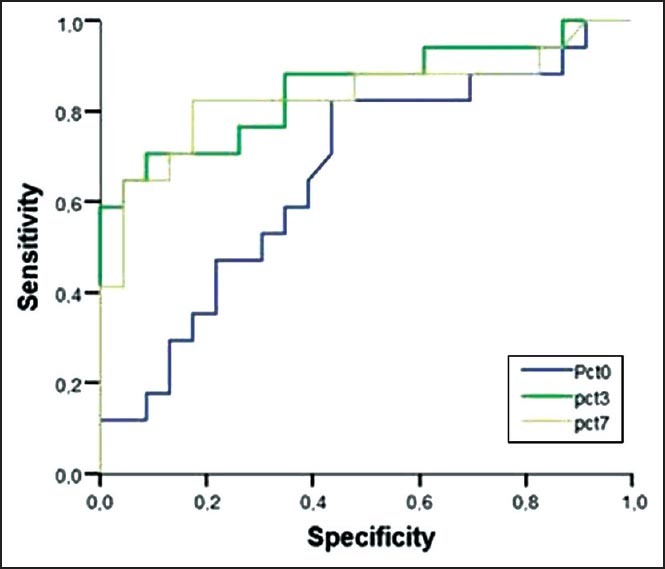
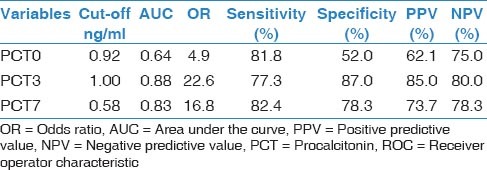
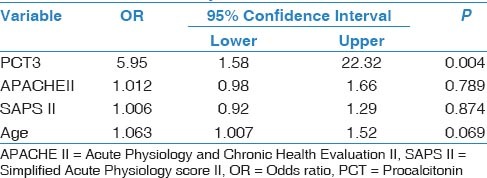
In total, 45 patients with a mean age of 65.2 ± 16.1 (range, 19-87) years were included. Of them, 22 (48.8%) died before day 28 after pneumonia diagnosis. Five patients (11%) died before 7th day; thus, we could not obtained blood samples for PCT and CRP from these patients on D7. Demographic and descriptive data of patients at ICU admission were grouped according to survivors or non-survivors and are shown in Table 1. The most frequent cause of ICU admission was acute exacerbation of chronic obstructive pulmonary disease. Other causes of ICU admission included congestive heart failure, trauma, postoperative respiratory failure, and cerebrovascular diseases. The mean duration of mechanical ventilation was 8.5 ± 6.0 days in patients who developed VAP. The most frequently isolated microorganisms were Acinetobacter spp. (48.8%), followed by Pseudomonas aeruginosa (21%), methicillin-resistant Staphylococcus aureus (17%), and Gram-negative enteric bacteria (13%). Mean serum PCT levels on D3 and D7 were significantly higher in non-survivors than survivors (P < 0.001 and 0.002, respectively). However, there was no significant difference between the groups in mean serum PCT levels on D0 or CRP levels on D0, D3, or D7 [Table 2]. PCT kinetics differed significantly between the survivor and non-survivor groups from D0 to D3 (Δ1) and D0 to D7 [Δ2; P = 0.005 and 0.049, respectively; Table 3]. However, the difference between D3 and D7 was not significant (P = 0.842). Mean CRP levels decreased in both survivors and non-survivors from D0 to D7, but there was no statistically significant difference between the groups (P = 0.583). Mean APACHE II, SAPS II, and SOFA scores calculated at ICU admission were not statistically significantly different between the survivor and non-survivor groups. The “best” cut-off values for serum PCT levels for mortality, obtained from ROC curves [Figure 1], are shown in Table 4. A PCT level greater than 1 ng/mL on D3 was the strongest predictor of mortality, with an odds ratio of 22.6. Also different cut-off values, sensitivity and specificity values of PCT for mortality were calculated [Table 5]. After the multivariate regression analyse both PCT levels on D3 [Table 6] and PCT kinetics from D0 to D3 (data not shown) still remained independent risk factors for mortality with odds ratios 5.9 and 2.6, respectively.
Table 1.
Descriptive data of the patients with VAP patients at the time of ICU admission and microbiological specification

Table 2.
Descriptive group statistics of PCT and CRP variablesin patients with VAP

Table 3.
Relationship between prognosis and kinetics of PCT and CRP levels

Figure 1.

Receiver operator characteristic (ROC) curve analysis and sensitivity, specificity of procalcitonin (PCT) for mortality in patients with ventilatory associated pneumonia
Table 4.
Best cut-off values of PCT that were obtained from ROC curves for mortality

Table 5.
Different cut-off values, sensititivity, and specificity of PCT for mortality

Table 6.
Multivariable logistic regression analysis of variables for mortality

Discussion
In the present study, no statistically significant difference was found between survivor and non-survivor VAP patients in mean serum PCT levels on the day that pneumonia was diagnosed. However, serum PCT levels on D3 and D7 were significantly higher in the non-survivor group than the survivor group. A PCT level greater than 1 ng/mL at D3 was the strongest predictor of mortality, with an odds ratio of 22.6. Mean CRP levels were not significantly different between survivors and non-survivors, and there was no significant correlation between CRP and mortality.
CRP is a highly sensitive biomarker of inflammation but it is not specific to infection. Its serum levels increase in both infectious and non-infectious causes of inflammation. Although we found that in VAP patients mean CRP levels on D0, D3, and D7 were higher in both survivors and non-survivors, no statistically significant difference was found between the groups. There was also no significant correlation between mortality and mean CRP levels. Many studies have reported that CRP levels increase to high levels from the beginning of an infection and remain high after the infection is controlled.[10,12,13,14]
PCT is known as a specific biomarker for bacterial infections and sepsis and its kinetics have been shown to be related to mortality in VAP and sepsis. In the literature, a wide range of cut-off values for PCT have been reported (0.463.9 ng/mL) for bacterial infections and sepsis.[12,15,16,17,18,19,20] Schuetz et al.,[21] investigated 14 randomized controlled trials and 4211 patients with respiratory tract infections including upper respiratory tract infections, bronchitis, exacerbation of chronic obstructive pulmonary disease (COPD), community-acquired pneumonia (CAP), and VAP, and reported that measurement of procalcitonin to guide antibiotic therapy was not associated with increased mortality or treatment failure. Based on the results they suggested that using procalcitonin to guide antibiotic therapy is associated with fewer antibiotic prescriptions in primary care settings and in patients with less severe infections, and with shorter courses of antibiotics for patients evaluated in the emergency department or the critical care setting.
Duflo et al.,[19] reported that PCT measurements were useful for the early diagnosis of VAP and that an increased serum level of PCT was a prognostic marker of VAP. Another study[22] showed that in microbiologically confirmed VAP patients, the mean PCT level was 3.86 ng/mL (2.99-11.30) and the cut-off value of PCT for VAP diagnosis was 2.99 ng/mL (sensitivity 78%, specificity 97%, AUC 0.87).
In a recent study, Zhydkov et al.,[23] have investigated the prognostic accuracy of initial and follow-up levels of inflammatory biomarkers, such as PCT, CRP, and white blood cells (WBC) in predicting death and adverse clinical outcomes in a large cohort of community-acquired pneumonia (CAP) patients and reported that admission PCT levels were significant predictors of 30-day mortality in univariate analysis however the association was no longer significant in multivaraite analysis after adjustment for the CURB-65 score. But they did not found significant association between admission CRP levels or WBC counts with outcome. They demonstrated that PCT, and to a lesser degree CRP, provide prognostic information on CAP outcomes particularly when their kinetics are taken into consideration and when adverse clinical outcomes are also considered instead of mortality alone. The most important improvements were found on days 5 and 7 for prediction of both survival and adverse clinical outcomes.
In the present study, neither the PCT nor CRP level on D0 differed between the survivor and non-survivor groups; however, PCT levels on D3 and D7 were significantly higher in the non-survivor than the survivor group. Similar to our study, Meisner et al.,[13] reported no statistically significant difference between survivor and non-survivor VAP patients in terms of mean serum PCT or CRP level at ICU admission. After the multivariate logistic regression analysis only PCT3 was significantly different so we suggest that PCT levels on day 3 is an independent predictor of mortality in patients with VAP [Table 6].
Luyt et al.,[10] reported that VAP patients who responded to therapy and survived had lower PCT levels than did patients with unfavourable outcomes, such as recurrent infection, relapse, and death. However, in contrast to our results, they reported a significant difference in PCT values at D0 between the groups. This may be due to differences in the patients: they grouped patients as favorable and unfavourable outcomes; the death rate was only 58% in the unfavourable group. Consistent with our study, Duflo et al.,[19] reported that PCT levels on D3 and D6 were significantly higher in the non-survivor group than in the survivor group and there was a significant correlation between prognosis and PCT concentration. This relationship was explained by the fact that control of the infection by appropriate antibiotic therapy resulted in PCT levels decreasing to normal even if they were high at the time of pneumonia diagnosis. Moreover, if the PCT values continued to increase or remained high despite therapy, this indicated that the therapy was ineffective and the prognosis was poor.[13] In contrast to our findings, Zielinska-Borkowska et al.,[24] reported that in patients with VAP, although PCT levels were higher in non-survivors and those who developed septic shock, PCT was not a strong predictor of these outcomes. In a logistic regression analysis, they found that PCT did not correlate significantly with a poor outcome.[24]
In the present study, both CRP and PCT levels decreased from D0 to D7 in the survivor group, but only the kinetics of PCT were statistically significant. Seligman et al.,[11] assessed PCT and CRP kinetics in VAP patients and found that PCT levels were lower in survivors on D0 (P = 0.003) and D4 (P = 0.001). They reported that PCT levels increased in non-survivors but not in survivors and CRP levels did not differ between survivors and non-survivors on D0 (P = 0.77) or D4. In their study,[11] using a multivariate logistic regression analysis, only decreasing ΔPCT and decreasing ΔCRP remained significantly associated with (Odds ratio = 4.43 (1.08-18.18), P = 0.04, and odds ratio = 7.40 (1.58-34.73), P = 0.01, respectively).[11] Also we calculated different cut-off values of PCT for mortality and found that whilethe lower levels of PCT had higher sensitivity, the higher values were more specific mortality in patients with VAP [Table 5].
In another study, Schuetz et al.,[25] assessed the discrimination provided by 72-hour PCT change as a mortality predictor in ICU patients with sepsis. They showed that, monitoring PCT kinetics in the first 72 hours of critical care provides information that may potentially help improve early transfer and therapy intensification decisions. Particularly, a PCT decrease >80% may help to identify individuals at reduced mortality risk who, therefore, are good early ICU discharge candidates. Conversely, a non-decrease or increase of PCT within this time frame may help to flag patients who are at high mortality risk and, therefore, are likely to require treatment escalation. A PCT decrease of > 80% had a high negative predictive value of 90% for ICU mortality with a sensitivity of 91%, while the positive predictive value when PCT did not decrease or increased was 48%, with a specificity of 89%.
In the present study, there was no significant correlation between PCT levels on D0 and mortality, but serum PCT levels greater than 1 ng/mL on D3 and 0.58 on D7 were the strongest predictors of mortality, with odds ratios of 22.6 and 16.8, respectively. Similarly, Luyt et al., reported that[10] a serum PCT level of more than 0.5 ng/mL on D7 was the strongest predictor of an unfavorable outcome, with an OR of 64 (sensitivity 90%, specificity 88%). Seligman et al.,[6] reported recently that in VAP patients, PCT levels on D0 and D4 showed the largest AUC for prognosis. On D4, the sensitivity and specificity of PCT for predicting mortality were 90% and 74%, respectively.[6]
Our study had several limitations. First, the patient population was small and it limits the strength of the conclusion thus the results should be verified by larger scale studies. We did not obtain baseline PCT and CRP levels of patients at ICU admission and no control group was included. PCT, CRP, and other variables were assessed only on D0, D3, and D7 with reference to the time of pneumonia diagnosis. We suggest that determining these variables either daily or more frequently would be more useful.
Conclusions
Serum PCT levels on D3 and D7 were correlated with prognosis in ICU patients who developed VAP. Moreover, serum PCT level was found to be superior biomarker than CRP in terms of predicting prognosis. PCT levels that increase or remain high despite application of therapy may be predictive of a poor prognosis.
The English in this document has been checked by at least two professional editors, both native speakers of English. For a certificate, please see: http://www.textcheck.com/certificate/8VGvT9
Footnotes
Source of Support: Nil
Conflict of Interest: None declared.
References
- 1.Guidelines for prevention of nosocomial pneumonia. Centers for Disease Control and Prevention. MMWR Recomm Rep. 1997;46:1–79. [PubMed] [Google Scholar]
- 2.Rello J, Ausina V, Ricart M, Castella J, Prats G. Impact of previous antimicrobial therapy on the etiology and outcome of ventilator-associated pneumonia. Chest. 1993;104:1230–5. doi: 10.1378/chest.104.4.1230. [DOI] [PubMed] [Google Scholar]
- 3.Rello J, Ausina V, Castella J, Net A, Prats G. Nosocomial respiratory tract infections in multiple trauma patients. Influence of level of consciousness with implications for therapy. Chest. 1992;102:525–9. doi: 10.1378/chest.102.2.525. [DOI] [PubMed] [Google Scholar]
- 4.American Thoracic Society, Infectious Diseases Society of America. Guidelines for the management of adults with hospital-acquired, ventilator-associated, and healthcare-associated pneumonia. Am J Respir Crit Care Med. 2005;171:388–416. doi: 10.1164/rccm.200405-644ST. [DOI] [PubMed] [Google Scholar]
- 5.Simsek S, Yurtseven N, Gercekoglu H, Izgi H, Sohtorik U, Canik S, et al. Ventilator associated pneumonias in a cardiothoracic surgery centre postoperative intensive care unit. J Hosp Infect. 2001;47:321–4. doi: 10.1053/jhin.2000.0932. [DOI] [PubMed] [Google Scholar]
- 6.Seligman R, Seligman BG, Teixeira PJ. Comparing the accuracy of predictors of mortality in ventilator-associated pneumonia. J Bras Pneumol. 2011;37:495–503. doi: 10.1590/s1806-37132011000400012. [DOI] [PubMed] [Google Scholar]
- 7.Cook DJ, Walter SD, Cook RJ, Griffith LE, Guyatt GH, Leasa D, et al. Incidence of and risk factors for ventilator-associated pneumonia in critically ill patients. Ann Intern Med. 1998;129:433–40. doi: 10.7326/0003-4819-129-6-199809150-00002. [DOI] [PubMed] [Google Scholar]
- 8.Trouillet JL, Chastre J, Vuagnat A, Joly-Goillou ML, Combaux D, Dombret MC, et al. Ventilator associated pneumonia caused by potentially drug-resistant bacteria. Am J Respir Crit Care Med. 1998;157:531–9. doi: 10.1164/ajrccm.157.2.9705064. [DOI] [PubMed] [Google Scholar]
- 9.Kollef MH. The prevention of ventilator-associated pneumonia. N Engl J Med. 1999;340:627–34. doi: 10.1056/NEJM199902253400807. [DOI] [PubMed] [Google Scholar]
- 10.Luyt CE, Guerin V, Combes A, Trouillet JL, Ayed SB, Bernard M, et al. Procalcitonin kinetics as a prognostic marker of ventilator-associated pneumonia. Am J Respir Crit Care Med. 2005;171:48–53. doi: 10.1164/rccm.200406-746OC. [DOI] [PubMed] [Google Scholar]
- 11.Seligman R, Meisner M, Lisboa TC, Hertz FT, Flippin TB, Fachel JM, et al. Decreases in procalcitonin and C-reactive protein are strong predictors of survival in ventilator-associated pneumonia. Crit Care. 2006;10:R125. doi: 10.1186/cc5036. [DOI] [PMC free article] [PubMed] [Google Scholar]
- 12.Brunkhorst FM, Al-Nawas B, Krummenauer F, Forycki ZF, Shah PM. Procalcitonin, C-reactive protein, and APACHE II scores for risk evalution in patients with severe pneumonia. Clin Microbiol Infect. 2002;8:93–100. doi: 10.1046/j.1469-0691.2002.00349.x. [DOI] [PubMed] [Google Scholar]
- 13.Meisner M, Tschaikowsky K, Palmaers T, Schmidt J. Comparison of procalcitonin (PCT) and C-reactive protein (CRP) plasma concentrations at different SOFA scores during the course of sepsis and MODS. Crit Care. 1999;3:45–50. doi: 10.1186/cc306. [DOI] [PMC free article] [PubMed] [Google Scholar]
- 14.Ugarte H, Silva E, Mercan D, De Mendonca A, Vincent JL. Procalcitonin used as a marker of infection in the intensive care unit. Crit Care Med. 1999;27:498–504. doi: 10.1097/00003246-199903000-00024. [DOI] [PubMed] [Google Scholar]
- 15.Luzzani A, Polati E, Dorizzi R, Rungatscher A, Pavan R, Merlini A. Comparison of procalcitonin and C-reactive protein as markers of sepsis. Crit Care Med. 2003;31:1737–41. doi: 10.1097/01.CCM.0000063440.19188.ED. [DOI] [PubMed] [Google Scholar]
- 16.Aikawa N, Fujishima S, Endo S, Sekine I, Kogawa K, Yamamoto Y, et al. Multicenter prospective study of procalcitonin as an indicator of sepsis. J Infect Chemother. 2005;11:152–9. doi: 10.1007/s10156-005-0388-9. [DOI] [PubMed] [Google Scholar]
- 17.Harbarth S, Holeckova K, Froidevaux C, Pittet D, Ricou B, Grau GE, et al. Geneva Sepsis Network. Diagnostic value of procalcitonin, interleukin-6 and interleukin-8 in critically ill patients admitted with suspected sepsis. Am J Respir Crit Care Med. 2001;164:396–402. doi: 10.1164/ajrccm.164.3.2009052. [DOI] [PubMed] [Google Scholar]
- 18.Polzin A, Pletz M, Erbes R, Raffenberg M, Mauch H, Wagner S, et al. Procalcitonin as a diagnostic tool in lower respiratory tract infections and tuberculosis. Eur Respir J. 2003;21:939–43. doi: 10.1183/09031936.03.00055103. [DOI] [PubMed] [Google Scholar]
- 19.Duflo F, Debon R, Monneret G, Bienvenu J, Chassard D, Allauchiche B. Alveolar and serum procalcitonin: Diagnostic and prognostic value in ventilator-associated pneumonia. Anesthesiology. 2002;96:74–9. doi: 10.1097/00000542-200201000-00018. [DOI] [PubMed] [Google Scholar]
- 20.Tuðrul S, Esen F, Çelebi S, Ozcan PE, Akinci O, Cakar N, et al. Reliability of procalcitonin as a severity marker in critically ill patients with inflammatory response. Anaesth Intensive Care. 2002;30:747–54. doi: 10.1177/0310057X0203000605. [DOI] [PubMed] [Google Scholar]
- 21.Schuetz P, Briel M, Mueller B. Clinical outcomes associated with procalcitonin algorithms to guide antibiotic therapy in respiratory tract ýnfections. JAMA. 2013;309:717–8. doi: 10.1001/jama.2013.697. [DOI] [PubMed] [Google Scholar]
- 22.Ramirez P, Garcia MA, Ferrer M, Aznar J, Valencia M, Sahuquillo JM, et al. Sequential measurements of procalcitonin levels in diagnosing ventilator-associated pneumonia. Eur Respir J. 2008;31:356–62. doi: 10.1183/09031936.00086707. [DOI] [PubMed] [Google Scholar]
- 23.Zhydkov A, Christ-Crain M, Thomann R, Hoess C, Henzen C, Zimmerli W, et al. Utility of procalcitonin, C-reactive protein and white blood cells alone and in combination for the prediction of clinical outcomes in community acquired pneumonia. Clin Chem Lab Med. 2014 doi: 10.1515/cclm-2014-0456. [DOI] [PubMed] [Google Scholar]
- 24.Zielinska-Borkowska U, Skirecki T, Z³otorowicz M, Czarnocka B. Procalcitonin in early onset ventilator-associated pneumonia. J Hosp Infect. 2012;81:92–7. doi: 10.1016/j.jhin.2012.02.011. [DOI] [PubMed] [Google Scholar]
- 25.Schuetz P, Maurer P, Punjabi V, Desai A, Amin DN, Gluck E. Procalcitonin decrease over 72 hours in US critical care units predicts fatal outcome in sepsis patients. Crit Care. 2013;17:R115. doi: 10.1186/cc12787. [DOI] [PMC free article] [PubMed] [Google Scholar]


