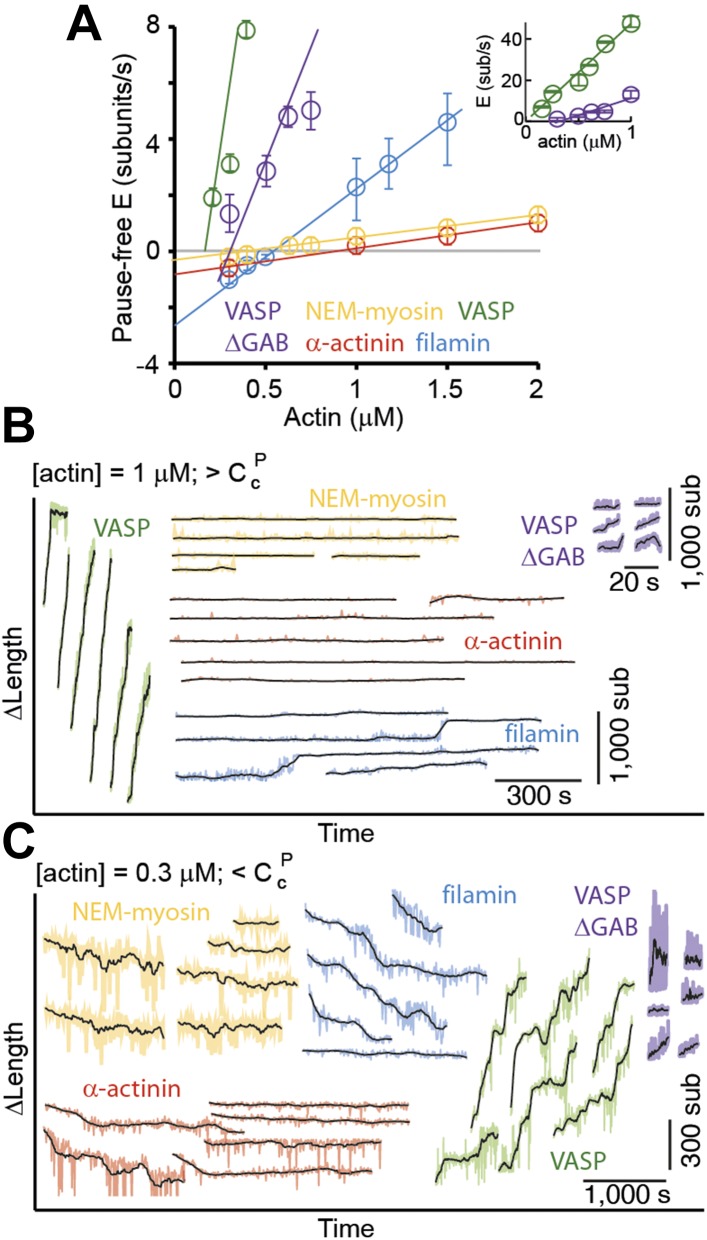
Figure 2. Pointed-end elongation and depolymerization kinetics as a function of the associated side-binding protein.
(A) The elongation velocity (E) is plotted as a function of free actin concentration. Error bars are s.e.m. (n > 20). (B–C) A gallery of traces of ΔL as a function of time for pointed-ends observed at (B) 1 μM or (C) 0.3 μM free actin monomer concentration for the different tethering proteins studied. The raw data are shown in color, and the black solid lines are a running average of 10 data points.

