

Abstract
Telomeres play a fundamental role in the protection of chromosomal DNA and in the regulation of cellular senescence. Recent work in human epidemiology and evolutionary ecology suggests adult telomere length (TL) may reflect past physiological stress and predict subsequent morbidity and mortality, independent of chronological age.
Several different methods have been developed to measure TL, each offering its own technical challenges. The aim of this review is to provide an overview of the advantages and drawbacks of each method for researchers, with a particular focus on issues that are likely to face ecologists and evolutionary biologists collecting samples in the field or in organisms that may never have been studied in this context before.
We discuss the key issues to consider and wherever possible try to provide current consensus view regarding best practice with regard to sample collection and storage, DNA extraction and storage, and the five main methods currently available to measure TL.
Decisions regarding which tissues to sample, how to store them, how to extract DNA, and which TL measurement method to use cannot be prescribed, and are dependent on the biological question addressed and the constraints imposed by the study system. What is essential for future studies of telomere dynamics in evolution and ecology is that researchers publish full details of their methods and the quality control thresholds they employ.
Keywords: DNA extraction, dot blot, fluorescent in situ hybridization, life history, quantitative real-time PCR, senescence, single telomere length analysis, telomerase, telomere restriction fragment analysis
Introduction
Telomeres occur at the ends of the linear chromosomes of most eukaryotes. They consist of tandem repeats of a short DNA sequence (TTAGGG in all vertebrates), with a single stranded overhang that doubles back on itself to form a structure known as the t-loop. Together with various associated proteins, telomeres cap the chromosome ends (Blackburn 1991; Armanios & Blackburn 2012). The consistency in their structure across the eukaryotes suggests that telomeres are evolutionarily ancient and may be highly conserved in function (Gomes, Shay & Wright 2010a). At a cellular level, telomeres solve two important problems for eukaryotes. First, the DNA repair machinery in cells must distinguish true chromosome ends from double-stranded breaks, so that intact chromosomes do not get joined together by mistake. Secondly, DNA polymerase is unable to completely replicate the terminal end of one strand of each linear chromosome, which could lead to progressive loss of important coding sequences at the chromosome ends (the ‘end replication problem’: Blackburn 1991; Aubert & Lansdorp 2008; Armanios & Blackburn 2012). In addition to the protection of coding DNA from loss that occurs as a consequence of the incomplete DNA replication, telomeres are also thought to have a central role in the regulation of chromosome segregation during both mitosis and meiosis (Aubert & Lansdorp 2008). In the absence of restoration and repair processes, telomere length declines with each cell division; the amount of DNA lost per round of cell division can be increased by conditions within the cell, most notably oxidative stress (von Zglinicki 2002). The main telomere restoration process involves the enzyme telomerase, which is variably active in different cell types, at different life stages and in different species (Gomes et al. 2011). When telomere length shortens to a critical point, telomeres become dysfunctional, and this triggers cellular replicative senescence, often followed by cell death (Armanios & Blackburn 2012).Telomeres therefore have a pivotal role in both the maintenance of a cell's genomic integrity and its replicative potential. Although telomere function at a cellular level is increasingly well understood in vitro, multi-cellular organisms comprise complex mosaics of cell types with different replicative histories, replenishment patterns and environments. Understanding the in vivo significance of the distribution of telomere lengths across those cell types for organismal health, longevity and reproductive fitness remains a major challenge within biology, epidemiology and medicine (Aviv, Valdes & Spector 2006; Aubert & Lansdorp 2008).
Most in vivo research on telomere length (TL) and the patterns of change across the lifetimes of individuals (telomere dynamics) has, until relatively recently, been carried out in the context of human disease and has involved work on cultured cells in humans and model organisms (Aviv, Valdes & Spector 2006; Aubert & Lansdorp 2008). Increasingly however, researchers working outside of cell biology, human health and epidemiology have become interested in telomere biology and dynamics. In particular, researchers in evolutionary, physiological and ecological fields are beginning to address questions including the diversity of telomere dynamics in different taxa, how telomere loss relates to life-history traits and trade-offs and to environmental circumstances (Nakagawa, Gemmell & Burke 2004; Monaghan & Haussmann 2006; Haussmann & Marchetto 2010; Horn, Robertson & Gemmell 2010; Monaghan 2010b). The currently available techniques for telomere measurement have been developed for use in molecular biology laboratories and generally require high levels of technical understanding and competence to produce reliable and robust estimates of telomere length. Several recent articles have raised important issues regarding the consistency and quality of methods applied to measure telomere lengths in different taxa (Nakagawa, Gemmell & Burke 2004; Horn, Robertson & Gemmell 2010; Monaghan 2010a; Haussmann, Salomons & Verhulst 2011; Smith, Turbill & Penn 2011). The aim of this article, based on our current knowledge, is to provide a guide for researchers embarking on telomere measurement in vivo in species other than laboratory rodents and humans, with a particular focus on issues that are likely to face ecologists and evolutionary biologists collecting samples in the field or in organisms that may never have been studied in this context before. In Fig.1, we provide a broad overview of the steps involved in planning and executing a study of telomere length. We discuss the key issues to consider and wherever possible try to provide the current consensus view regarding best practice. In doing this, we hope to help researchers avoid the most common pitfalls encountered in cross-disciplinary studies involving telomere length and provide a platform to encourage and facilitate the highest quality and most methodologically clear and consistent studies of telomere dynamics in a wide range of organisms.
Fig 1.
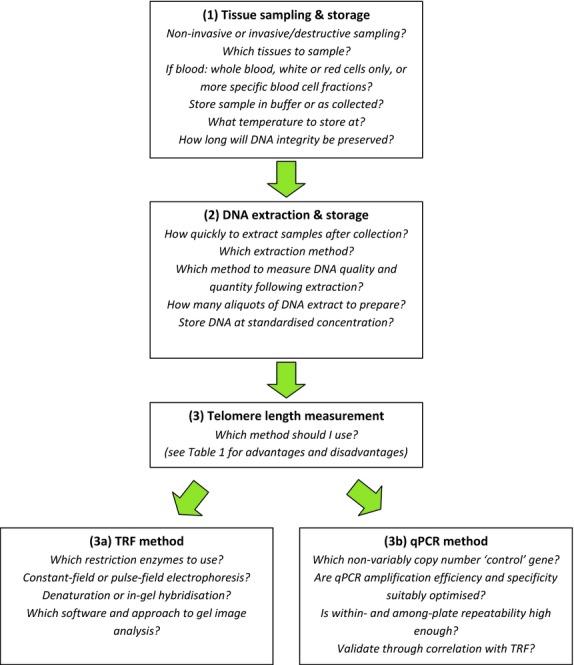
Schematic showing key stages in decision-making process when considering a study of telomere length and the important questions to consider at each stage. The figure also highlights key methodological issues to consider for the two most widely applied measurement techniques, qPCR and telomere restriction fragment (TRF).
Sample collection, storage and DNA extraction
The first step in any study of telomere length lies in collecting and storing samples for subsequent DNA extraction. While TL measurement techniques vary in the amount of DNA they require, the need for high-quality DNA is consistent across all techniques. Likewise, there are many available methods for extracting DNA; it is important to select one that will maximize DNA quality and yield and to store the extractions in such a way that they will not degrade. It is also important to be consistent in the method used for DNA extraction and to ensure that it is appropriate for the telomere measurement method being used (Cunningham et al. 2013). Below we discuss the challenges and issues associated with sample collection, storage and DNA extraction in more detail.
Tissue type
In any given study, the tissue that can be sampled for telomere measurement will depend on many things, not least the size and life stage of the organism, the study environment, and the degree to which invasive or destructive sampling is ethically justifiable and feasible. Telomere length and dynamics vary among cell types and tissues due to differences in cellular proliferation and replenishment rates and the degree of telomere restoration, most commonly through the action of the enzyme telomerase (Gomes, Shay & Wright 2010b). For instance, tissues with low replication rates and minimal telomerase expression (e.g. central nervous system, muscle) may show little telomere change during adult life. Most in vivo studies of TL in vertebrates use blood, for which small samples can be taken routinely and repeatedly from the same individuals, usually with little adverse effect. Importantly, blood cells generally have a high turnover rate (Chang & Harley 1995), leading to the expectation and widespread observation of TL loss in blood cells with age and over time. However, blood cells comprise a rich composite of cell types with very different functions, proliferation patterns and levels of telomerase expression. In fish, amphibians, reptiles and birds erythrocytes (red blood cells, RBCs) are nucleated and, as they typically make up more than 99% of the cells in a given blood sample, blood-based work in these species will capture TL variation in RBCs. The main sites of production of erythrocytes vary among vertebrate groups and between embryos and adults. They are terminally differentiated and non-dividing, are regularly replaced and do not express significant amounts of telomerase. As such, RBCs are considered to provide a good representation of TL in haematopoietic tissues (Schroeder 2010). DNA yield from blood in species with nucleated RBCs is generally high, and a few drops of whole blood are sufficient for repeated measurements of TL by most techniques described below (Table1, Horn, Robertson & Gemmell 2010).
Table 1.
A comparison of available methods for measuring telomeres (adapted from Aubert, Hills & Lansdorp 2012 and Kimura et al. 2010b)
| Method | |||||||
|---|---|---|---|---|---|---|---|
| Telomere restriction fragment | qPCR | Dot blot | Q-FISH | Flow-FISH | STELA | ||
| Southern blot | In-gel hybridization | ||||||
| Quantity of cells/DNA required | High (0·5–10 μl DNA) | High (0·5–10 μl DNA) | Low (>50 ng DNA) | Low (∼20 ng DNA) | Any number of viable cells | 0·5–2 × 10⁶ viable cells | Very low (<2 ng DNA) |
| Effort to establish | High | High | Moderate | Unknown | Very high | Very high | Very high |
| Handling time per sample | High | High | Low | Low | High | Low | Very high |
| Provides telomere distributions? | Yes | Yes | No | No | Yes | Yes | Yes |
| Includes interstitial telomere sequence? | Yes | No | Yes | Yes | No | No | No |
| Unit of measurement | Mean TL across all cells | Mean TL across all cells | Amplification of telomererelative to control gene | Telomeric repeats relative to total DNA | Average cell TL | Average TL in specific cell types | Single chromosome TL |
| Used in field studies of animals? | Yes | Yes | Yes | No | No | No | No |
| Key methodology reference | Kimura et al. (2010b) | Haussmann & Mauck (2008) | Cawthon (2002) | Kimura & Aviv (2011) | Lansdorp et al. (1996) | Baerlocher et al. (2006) | Baird et al. (2003) |
The situation in mammals, which have enucleated RBCs after birth, is very different as blood-based work will measure TL only in leucocytes (white blood cells, WBCs). This means significantly more mammalian blood is required to yield a similar quantity of DNA, as WBCs are much less common than RBCs. Furthermore, leucocytes themselves comprise a very diverse composite of cells with diverse origins, immune functions, patterns of proliferation and telomerase expression (Weng 2001; Aubert & Lansdorp 2008). This is illustrated clearly by just considering the broadest categorization of WBCs into granulocytes and lymphocytes: the former are relatively short-lived and do not proliferate or express much telomerase in circulation and are thought, like RBCs, to provide a reasonable reflection of TL in haematopoietic tissues (Aubert & Lansdorp 2008). However, lymphocytes are hugely heterogeneous group of cells, which can proliferate rapidly following stimulation by antigens and other cells and are known to express telomerase when they do (Weng 2001).
Several studies now suggest that while TLs may vary depending on cell type, individual differences in TLs remain consistent across life (Heidinger et al. 2012; Benetos et al. 2013). In other words, an individual within a population with a relatively long TL at first measurement is likely to have relatively long TL at follow-up measurement some time later, and recent evidence suggests these individual differences are conserved among tissues and cell types in adults (Kimura et al. 2010a; Daniali et al. 2013). However, it is important to note that no study to date has compared TLs in RBCs and WBCs in species with nucleated RBCs, and there are currently rather limited longitudinal data on the dynamics of any tissue or cell type. At this stage, we can only recommend that researchers remain consistent in their sample tissue choice and keep in mind whatever is known about the proliferative potential and telomere expression in that tissue when interpreting results.
Sample collection, preparation and storage
The way in which samples are collected and stored can have profound consequences for the quality and quantity of DNA available for subsequent telomere length measurement. Degradation of DNA is a serious issue in telomere studies because the process often begins at chromosome ends and thus will affect telomeres first, and also due to the high sensitivity of telomeres to oxidative damage (Wang et al. 2010). There are many different ways of sampling, preparing and storing tissues and cells – far too many to cover here. In Table S1, we provide a list of methods that have been used previously by the authors for TL studies and whether or not they yielded DNA of sufficient quality and quantity for use in the two most widely applied methods (telomere restriction fragment, TRF and quantitative PCR telomere assay, qPCR). Key decisions for the researcher include how to prepare the sample before storage (e.g. is whole blood used or are blood cell types separated?), the temperature and/or buffer in which to store the sample, and whether it is possible and/or desirable to extract DNA from the sample immediately or shortly after sampling to avoid the risk of DNA degradation in the sample itself. There are no hard and fast rules here, and the list Table S1 demonstrates that a range of methods that can yield enough high-quality DNA for TL analyses, even after decades of storage. Ecologists may be interested in using archived blood or tissue samples that were not collected specifically for telomere measurement. Consistency of storage and extraction methods is very important, and where different methods have been used it is crucial to establish that these differences do not influence resulting TL measurements. As we discuss in the next section, establishing the quality and quantity of DNA produced from samples is an essential first step in telomere research, as is reporting the quality and quantity thresholds used in any published work.
DNA extraction
Genomic DNA (gDNA) can be extracted from animal tissue using a range of methods, including many commercial kits that are designed for use with specific tissue types. Finding the best method for telomere studies depends on the sample size, tissue type, and chosen method for telomere length measurement (see Table S1 for examples). When working with fibrous tissues such as skin or muscle, an important step is the disruption of the tissue prior to DNA extraction. Spin columns are a common feature of many DNA extraction kits, and these shear DNA to a near uniform length of 20–25 kb, which will set an upper limit to the length of measured telomeres when using methods such as TRF, which could inflate the number of short telomeres. However, spin columns remain a widely used DNA extraction method in telomere research, as shearing is considered less of a concern in species with short telomeres (e.g. humans) and when using the qPCR method. Ultimately, consistently using the same extraction method is very important in any telomere study. If, for some unavoidable reason, extraction methods change during the course of a study, the researchers involved should check that results correlate very closely between methods. Once extracted, gDNA may be stored frozen for long periods in appropriate buffers, typically at either −20 or −80°C without degradation (see Table S1). However, before doing so, it is crucial to establish that the gDNA yield is of sufficient quality and that aliquots contain sufficient concentrations of gDNA for the telomere measurement techniques that will be used. The most common methods to assess DNA quality and quantity are optical density spectrophotometry (absorbance), fluorometry (fluorescence) and agarose gel electrophoresis (Kimura et al. 2010b). We would strongly encourage researchers to include details of how they measured DNA quality and quantity, and the cut-offs applied to exclude low DNA quality samples from subsequent telomere measurement work, in any published research.
Methods for estimating telomere length
There are several methods available for telomere length measurement. These involve varying degrees of technical difficulty and background information on the genome of the species involved. The methods also vary in the amount of detail they provide, in the time and equipment required to process each sample, and in the financial costs involved. In Table1, we offer a brief, overarching summary of the main differences among these methods, and below we explain each method in more detail, providing key references for obtaining more information.
Telomere restriction fragment assay
The TRF assay was developed over 20 years ago to measure mean telomere length from the distribution of telomere restriction fragments produced by digesting DNA with restriction enzymes that do not cut within the telomere sequence (Harley, Futcher & Greider 1990). It continues to be considered as the ‘golden standard’ method for measuring TL and is widely used to validate and optimize new methods or their application in new species or settings (Criscuolo et al. 2009; Kimura & Aviv 2011; Aubert, Hills & Lansdorp 2012). The key stages in the process of TRF are (i) restriction enzyme digest of gDNA, (ii) agarose gel electrophoresis of the digested DNA, (iii) hybridization using either traditional denaturing blots or non-denaturing, in-gel hybridization techniques and (iv) image analysis of telomeric smears on the resulting gels to generate telomere length estimates. TRF is a technically demanding method and requires relatively high concentrations of DNA, a high level of expertise and investment to set up in a new laboratory and is low throughput even in the hands of experts. However, it has many advantages, including providing a readily quantifiable distribution of TLs in kb units, which can be compared across populations and species and used to estimate both mean, medians and variance in TLs within a sample of cells (Table1). There is a tremendous variability in telomere lengths among taxa (Gomes, Shay & Wright 2010b). The likely upper and lower ranges of a study species TLs is a particularly important consideration when using the TRF method, as we discuss in more detail below. We also discuss the relative merits of the denaturing gel and in-gel hybridization methods below, and recommend reading Kimura et al. (2010b) for full methodological details of the former, and Haussmann & Mauck (2008) for the latter.
The first step in TRF is the restriction digest of extracted gDNA. Most studies using TRF methods apply several of the available suitable restriction enzymes (which include HinfI, RsaI, HaeIII and MspI) with the combined use of just HinfI and RsaI being particularly common (see Delany, Krupkin & Miller 2000; Haussmann & Mauck 2008; Kimura et al. 2010b for further information). It is essential to digest all samples with the same combination and not to change the chosen restriction enzymes during the analysis. Digested DNA is then resolved using agarose gel electrophoresis. It is important to standardize the DNA concentrations prior to loading of samples onto the gel; Kimura et al. (2010b) have recommended standardization to with the 300–500 ng μl−1 range. Because TRF analysis depends entirely on the position of the telomere sequence within a gel, appropriate steps should be taken so that it is possible to diagnose gel inconsistencies both within and among gels. Within a gel, the molecular weight marker should be evenly-spaced in 5–10 wells across the gel to insure consistent DNA migration in all parts of the gel (Kimura et al. 2010b). In addition, loading the same sample multiple times within and among gels allow for intra- and interassay variability to be assessed and reported (Kimura et al. 2010b). Different types of gel electrophoresis are recommended depending on the range of telomeres found in the species studied. Where TL is typically <20 kb constant-field gel electrophoresis (CFGE) provides good resolution (Haussmann & Mauck 2008) and has typically been used in studies of humans (Kimura et al. 2010a,b). Where TLs are typically >20 kb pulsed-field gel electrophoresis (PFGE) can be used to provide better resolution of large DNA fragments up to 10 Mb (Haussmann & Mauck 2008). Whichever method is used, it is very helpful to report key electrophoretic parameters used in the methods of any publication using TRF (e.g. voltage/cm, run duration, gel concentration for both methods and electronic field inversion switch times got PFGE). Kimura et al. (2010b) also provide advice on the percentage of agarose gel best suited to analysing telomeres of different lengths.
After gel electrophoresis, hybridization is then undertaken using a telomere probe that is complementary to the telomere sequence repeats (CCCTAAn or TTAGGGn), which is labelled with either chemicals for chemiluminescent detection (e.g. digoxigenin) or radiochemicals for radioactive detection (e.g. 32P). Whether a denaturing on non-denaturing gel is used will influence the probe binding, and it is very important that, once chosen, the probe should not be changed within a study. Radioactive probes enhance the sensitivity of detection, but also require more safety precautions (Kimura et al. 2010b). Currently, denaturing blots are widely used in human TL studies. In a denaturing blot, the electrophoretically separated DNA fragments are transferred to a hybridization membrane. The double-stranded DNA is denatured in the process, so the probe is able to bind to all of the telomere sequences in the TRF. With this method, longer telomeres will bind more probe, so it is necessary to correct for this during analysis (Kimura et al. 2010b). The in-gel hybridization approach involves drying the gel and then directly probing it rather than transferring DNA fragments to a hybridization membrane (Haussmann & Mauck 2008). The result is that telomere sequences are not denatured, so that only the CCCTAAn probe binds to the telomere single-strand overhang (Haussmann & Vleck 2002). The great advantage of the in-gel technique is that it will only bind terminal telomeres (i.e. it will not bind any interstitial telomeric sequence present, see ‘Which method to choose…’ section below for further discussion), but that comes at the price of less bound probe and the possibility of reduced sensitivity. Regardless which is used, it is important to wash the membrane or gel adequately to reduce non-specific binding of the probe, which results in background during TRF analysis (Kimura et al. 2010b).
Once the membrane or gel has been exposed on X-ray film or phosphor screen, several approaches have been used to quantify TLs from the resulting image. In general, TRF measurement is accomplished by estimating telomere fragment size by comparison with molecular weight markers on the gel and relating this to the optical densities (OD) down the telomeric smear in each lane (Kimura et al. 2010b; Haussmann, Salomons & Verhulst 2011). Obtaining OD data from telomere images is not a trivial task. There are numerous issues to consider, including whether and when to exclude lanes from analyses, which software to use to obtain OD values from a gel image, how to select a background OD to subtract from lane or gel ODs, and the analysis window to use to calculate the TL distribution. Different laboratories have used different methods in all respects, and the crucial thing here is to clearly explain the method in full in any publication and to be totally consistent with the method throughout a study. There has been some debate over the use of the program ‘Telometric’ to analyse gels in the recent literature (Horn, Robertson & Gemmell 2010), and a complete description of the issues with this software have now been presented (Haussmann, Salomons & Verhulst 2011). Our consensus is that, because of the potential for bias in its calculation methods, in its current form Telometric should not be used to analyse TRF gels. Free-to-download image analysis software, such as imagej (National Institute for Health, Bethesda, MA, USA), can be used to estimate OD variation across gel images, but further analyses of this data needs to be conducted by the researchers themselves. For a worked example of such an analysis, we refer the reader to the online appendix of Haussmann, Salomons & Verhulst (2011). The most appropriate method for a given study or type of gel may depend on the question and study system, and every researcher should therefore develop, justify and completely explain their approach to analysing TRF gels in any published article.
qPCR assay
The qPCR-based method for measuring TL was developed by Richard Cawthon in part to overcome the problem that TL measured using the TRF method can vary somewhat depending on the restriction enzymes used, and because of the limits that the amount of DNA and time required for the TRF assay can place on feasible sample sizes (Cawthon 2002, 2009). Unlike TRF, which yields an estimate of the average or range of TLs in kb present in the sample of cells, qPCR provides an estimate of the amount of telomere sequence present in the sample relative to the amount of a specified non-telomeric reference sequence that is autosomal and non-variable in copy number (Cawthon 2002). qPCR is the most time efficient and high-throughput method currently available and requires less DNA than TRF (Table1), which is important when extracting DNA from small amounts of tissue or whole blood, or when using blood samples from species without nucleated RBCs. However, expertise, diligence and high-quality DNA are still required for qPCR optimization and to ensure target specificity and assay precision. Much of the general advice on gene expression and qPCR analysis, such as on primer selection and optimization (e.g. Derveaux, Vandesompele & Hellemans 2010) and the minimum information for publication of quantitative real-time PCR experiments (MIQE) guidelines (Bustin et al. 2009), is equally relevant to the telomere qPCR assay and should be consulted before attempting to develop these assays. Important steps in the development and validation of a qPCR telomere assay include: (i) identifying an appropriate non-variable copy number gene sequence; (ii) checking the amplification efficiency and melt-curve specificity of both non-variable copy number gene and telomere sequence during qPCR; (iii) establishing high within- and among-plate repeatability of the assay.
The qPCR assay follows the general principle of polymerase chain reaction (PCR) where DNA acts as a template for its own amplification. The exponential nature of the PCR means that the number of thermal cycles (Cq) it takes for product amplification (measured by an intercalating dye, such as SYBR green, that fluoresces when bound to the newly generated double-stranded DNA) to cross a set threshold in the exponential growth phase (Nq) is proportional to the quantity of the original template DNA. In the telomere assay, there are two targets for amplification: the telomere sequence (T) and the non-variable copy number gene sequence (N). Cawthon (2002) originally referred to these as T and S (for single copy gene), rather than N, but in fact the reference sequence need not be in single copy or part of a gene (Smith, Turbill & Penn 2011). This non-variable copy number gene is used to account for the fact that, however carefully the researcher attempts to use the same concentration of DNA in each reaction, the number of cells will differ. As long as the N sequence is represented in an identical way in each genome represented in the samples, it will fulfil this function. The conservation of telomeric sequence means that the T primers (tel 1 and tel 2), originally designed by Cawthon (2002) and then modified for greater efficiency (tel 1b and tel 2b) by Epel et al. 2004 should work in all vertebrates. However, identifying an appropriate N sequence and designing primers to sequence will need to be undertaken de novo for any new study species. Importantly, even if a potential N gene that is found in all animals has been used before, the sequence and copy number may vary, even among closely related species. One method to select a non-variable copy number gene sequence is to test 3–5 candidate sequences on a range of samples representing both sexes and all populations used in the final sample set and checking for copy number variation or lack of amplification specificity (as outlined in Smith, Turbill & Penn 2011).
If the T and N sequences will amplify under the same PCR conditions, then reactions should be run on the same plate, because within-plate normalization can increase between-plate repeatability (Barrett et al. 2012). Furthermore, a reference (or ‘golden’) sample is typically included on every plate, and T:N ratios presented relative to that of the plate reference sample, thus accounting for among-plate variation (Cawthon 2002). These reference samples can be taken from a large volume single sample or pooled from multiple samples to ensure there is enough for all the planned assays and should be stored frozen in multiple small volume ‘single-use’ aliquots to prevent repeated freeze-thawing that might influence reaction efficiency. It is recommended that both T and N amplification is run in triplicate for each sample. The mean value across the replicates can then be used (e.g. Barrett et al. 2012), although we would strongly advocate calculating and reporting the measurement error among replicates. Recently, Cawthon (2009) proposed a monochrome multiplex qPCR approach that would in principal offer reduced measurement error and increased throughput. To date, this method has not been widely applied outside of human studies, although two recent studies have used it in dairy cattle (Brown et al. 2012) and humpback whales (Olsen et al. 2012) without validation against a non-qPCR method. One advantage is that the method allows a relative TL to be calculated for each well. Thus, rather than simply averaging over sample replicates within a plate and thereby ignoring the measurement error associated with among-replicate variation, this variation can be included and accounted for in subsequent analyses, for instance in a mixed-effects model (see Brown et al. 2012 for an illustration).
For precise and reproducible data one must achieve specific amplification and high amplification efficiencies for both the T and N amplicons. Amplification specificity can be determined by analysing the derivative melt-curve, which should show a single peak for each of the T and N sequence amplicons. Multiple peaks indicate non-specific amplification and primer-dimer formation that may result from poor primer selection and/or PCR optimization (Bustin et al. 2009). Amplification efficiency is the relative increase in amplicon concentration per cycle where doubling is 100% efficiency. Efficiency can be estimated per amplicon using standard curves (Pfaffl 2001) or by fitting regressions to the loglinear phase of individual reactions (Ruijter et al. 2009). The efficiencies between T and N usually differ, and small errors in efficiency estimation are compounded exponentially into very large errors in calculations of initial sequence quantity, so it is important not to use an analysis method that assumes equal efficiencies for T and N (e.g. the ‘delta-delta method’, which was used in Cawthon's 2002 article). We advocate a method that initially subtracts baseline variation in fluorescence, as this can bias estimated efficiencies and increase among-plate variation (Ruijter et al. 2009), and then also accounts for differences in efficiencies among samples (e.g. Pfaffl 2001). The freeware programme LinRegPCR is able to perform just such calculations using raw data from a variety of qPCR platforms (Ruijter et al. 2009), as can other commercially available programs. Various methods have been used to calculate relative TL from the Cq and efficiency data produced by software packages (e.g. Barrett et al. 2012; Olsen et al. 2012; Turbill et al. 2012). These appear to produce closely correlated results (Olsen et al. 2012), but it is important to report the exact method used in any publication.
One major drawback of the relative qPCR telomere assay is that it gives a within-study relative value of telomeric sequence per genome rather than an average telomere length in kb. As such, it cannot be used to compare TL or telomere dynamics among studies, populations or species. O'Callaghan et al. 2008 adapted the relative qPCR telomere assay by comparing sample amplification with that of synthesized telomere oligomers of known length, to yield an estimated TL in kb per diploid genome scale (the ‘absolute qPCR’ method; O'Callaghan et al. 2008). Whether this approach renders comparison among studies meaningful is currently open to debate. The method has been criticized for providing unrealistic estimates of telomere lengths, suggesting this could be due to differences in efficiencies between samples and the external oligomer references (Horn, Robertson & Gemmell 2010). Barrett et al. (2012) modified the method to account for differences in efficiencies between samples and oligomers. The results from relative and absolute were almost perfectly correlated, presumably because the absolute method does little more than rescale the original relative TL data (e.g. r = 0·99, Barrett et al. 2012). Before considering the use of absolute qPCR data in comparative studies, it remains crucial to validate absolute qPCR-based TL estimates by comparing among study, individuals or species differences to those obtained using a more direct TL measurement method, such as TRF or flow-fluorescent in situ hybridization (FISH) to ensure that the variation measured reflects variation in the amount of telomeric sequence at the chromosome ends.
Q-FISH and flow-FISH
There are now four different protocols documented to measure telomere length (TL) that use FISH (Aubert, Hills & Lansdorp 2012). They are all adaptations of the original method, quantitative FISH (Q-FISH), which was developed by Lansdorp (Lansdorp et al. 1996). Q-FISH is a powerful but technically challenging procedure. It requires cultured cells or fixed tissue sections. Then, using a fluorescently labelled peptide nucleic acid (PNA) probe (CCCTAA)3, which specifically hybridizes to denatured telomere DNA, the TL of each chromosome end can be measured. Fluorescence intensity of bound probe is directly proportional to TL; this quantitative relationship is the basis of all FISH protocols to measure TL. In Q-FISH, a fluorescent microscope and sensitive CCD camera creates digital images of metaphase spreads and specialized software is used to analyse them. Telomere intensities are normalized to samples or standards of known TL (Poon et al. 1999). When cells arrested in metaphase are used, Q-FISH provides quantitative information on TL distributions within a sample and can detect critically short telomeres. When fixed tissue samples are used, Q-FISH provides information about average telomere length. This information is of great importance in human studies as the accumulation of critically short telomeres, rather than short average TL, has been demonstrated to cause genetic instability, limiting cell survival and tissue renewal (Hemann et al. 2001; Hao et al. 2005). This technique has provided the opportunity to analyse telomeres of individual chromosomes separately, including differentiation between p and q arms of sister chromatids (giving 4 telomeric measurements per chromosome). It also allows for simultaneous karyotyping and identification of chromosomal abnormalities such as end-to-end fusions (Lansdorp et al. 1996; Poon et al. 1999).
Q-FISH achieves high resolution, but it is labour intensive, time-consuming and requires viable cell samples or fixed tissue sections (Table1). Flow-FISH was developed to overcome some of these limitations and is now quite widely used in studies of human LTL dynamics (Aubert & Lansdorp 2008; Aubert, Hills & Lansdorp 2012). Here, interphase cells in suspension are hybridized with a PNA telomere specific probe and average TL is measured by fluorescence intensity using flow-cytometry (Rufer et al. 1998). This technique allows for a larger number of cells to be analysed in a much shorter time. Using antibody staining, different cell types within one blood sample can be sorted and compared. However, blood samples have to be fresh, and the process is still requires considerable expertise (Table1). It is not surprising, given the complexity and specialized nature of FISH protocols, that they are rarely utilized by investigators seeking to measure TL in non-model organisms. Access to basic laboratory facilities can be limited when sampling wild populations, sometimes in remote places, so it is most likely to be useful for laboratory studies using captive animals, or were viable cell cultures can be readily established from sampled tissues. Being able to sample or culture live cells are all fundamental prerequisites for FISH techniques as too are the dedicated, and often expensive, laboratory equipment. However, the ability to study telomere dynamics in non-model organisms at this in depth level could expedite our understanding of the interactions between biological state and life histories tremendously.
Single telomere length analysis
Single telomere length analysis (STELA) is a high-resolution single-molecule PCR-based approach to determine telomere length (Baird et al. 2003). STELA is targeted to specific chromosome ends for which telomere-adjacent sequence is available. Originally developed to analyse the human XpYp telomere, STELA has now been extended to several additional human chromosome ends and has been adapted for use in Caenorhabditis elegans (Cheung et al. 2004; Britt-Compton et al. 2006). STELA utilizes the unique structure of the 3′ G-rich overhang at the telomeric terminus: a linker (telorette) anneals to this sequence and is ligated onto the end of the C-rich strand. Long-range PCR is then used to amplify between a specific telomere-adjacent PCR primer and a second primer (teltail) composed of the sequence of the 5′ end of the telorette linker. The PCRs are undertaken at the single-molecule level with amplification from typically 6–10 amplifiable molecules per reaction, each sample is analysed with up to six separate reactions to provide a large enough sample size. The amplified telomeric molecules are detected by Southern hybridization with telomere-adjacent and telomere repeat containing hybridization probes. This single-molecule approach yields a banding pattern, each band representing the telomere length of a single input telomere.
STELA requires only small amounts of input DNA, in humans typically <2 ng of DNA is analysed per sample. However the key advantage of this approach is that the very shortest telomeres are readily detectable, indeed telomeres composed of a single double-stranded telomere repeat can be detected; telomeres in these length ranges are not currently detectable with any other method. These short telomeres are biologically important as they are observed in senescent cells, cells undergoing crisis in cancer and following sporadic telomere deletion (Baird et al. 2003; Baird 2008; Lin et al. 2010). Thus provided the longest telomeres are within the PCR amplifiable length range of up to 25 kb, the full spectrum of telomere lengths can be detected using STELA. Many organisms contain complex subtelomeric repeat sequence structures and interstitial telomere repeats, which can confound the interpretation of TRF-, Q-FISH- and Q-PCR-based approaches. By reducing the complexity and analysing specific chromosome ends, STELA could in principle obviate these issues. However, the success of STELA is dependent upon the existence of unique telomere-adjacent sequence and the lack of these sequences is likely to be the key factor limiting STELA for use in additional organisms. Telomere-adjacent sequences are not easy to characterize and are often not represented in genome sequencing projects, indeed many of these regions of the human genome are still yet to be fully characterized (Riethman 2008). However, simple PCR-based strategies have been used to characterize telomere-adjacent sequences in humans and related species (Royle, Hill & Jeffreys 1992; Royle, Baird & Jeffreys 1994; Baird & Royle 1997), and these approaches could be used to characterize sufficient telomere-adjacent sequences for STELA in organisms with poorly characterized genomic sequence.
The dot blot telomere assay
Kimura & Aviv (2011) recently developed a method for measuring TL based on dot blot analysis. This method has the advantage that it requires only small amounts of DNA and is relatively easy and inexpensive. It also avoids the need to find a suitable non-variable copy number gene as in the q-PCR method, which in some species is not straightforward. As yet, the dot blot method has been little used in telomere measurement, but offers considerable potential for use on non-model organisms and where laboratory facilities are relatively limited (see Kimura & Aviv 2011 for details of protocol). It requires the use of a Bio-Dot microfiltration apparatus. In brief, their method was as follows. A standard of known average telomere length (established from TRF analysis) was selected. Samples and different concentrations of the standard were loaded into the wells in triplicate and subjected to a gentle vacuum. The membrane was removed, DNA blot staining applied (SYBR Dx stain), and the fluorescence signal measured. The amount of DNA in each sample was calculated from the standards. A labelled telomeric probe was then applied to the washed membrane and exposed on X-ray film. The amount of telomeric repeats was then estimated by comparison with the standard using image analysis software. Results for this method were found to correlate well with that provided by the TRF method (r = 0·97 in two separate studies of 28 and 42 samples), which was slightly better than the correlation between TRF and relative qPCR measurement in those same samples (r = 0·85 in the study of 28 samples). The authors did not report the correlation between the dot blot TL estimates and the qPCR estimates. This method has great potential for use in non-model species; however, one current stumbling block to its wider application is the difficulty and cost of obtaining the SYBR Dx stain from its suppliers, Invitrogen, as it is only currently produced to specific order. In 2012, the authors of this article organized a bulk purchase of this reagent that kept costs down, and combining orders among laboratories seems the best way to obtain this stain cheaply. Readers interested in utilizing the technique and finding out more about such orders can contact the corresponding author.
Which method to choose, and is one method enough?
The decision as to which method to use in a given setting or system cannot be prescribed, as each method has different strengths and weaknesses (Table1). As Aubert, Hills & Lansdorp (2012) eloquently put it: ‘at present there is no single technique that can accurately, easily and rapidly measure telomere length. Selection of a method must therefore be made based on the specific scientific questions that need to be addressed'. Although many studies in non-model organisms used the so-called gold standard TRF method (e.g. Shiels et al. 1999; Pauliny et al. 2006; Hartmann et al. 2009; Benetos et al. 2011; Gomes et al. 2011; Bauch, Becker & Verhulst 2013), an increasing number of studies within evolutionary ecology are turning to the qPCR methodology to allow more rapid survey of TL variation in larger numbers of longitudinally collected blood samples. Such studies are revealing interesting effects of either naturally varying or experimentally altered environmental conditions on TLs and also links between TL and life-history traits and life span that appear to be independent of chronological age (e.g. Bize et al. 2009; Brown et al. 2012; Heidinger et al. 2012; Angelier et al. 2013; Barrett et al. 2013). A question that has been raised repeatedly in our discussions relating to best practice methodology is: Do studies using qPCR in a new species need to validate the method through correlation with TRF? If one turns to the most recent comprehensive methodological review from the literature on human telomeres, the answer is unequivocal:
although the qPCR methods are very attractive for their short timeline and costs, variability within and between samples remains relatively high. Each laboratory adopting a qPCR method should therefore conduct an initial calibration to a non-PCR-based telomere length measurement, [and] optimize the technique until a high r2 coefficient is reached.
To date, studies have compared TRF and qPCR methods in humans and birds and found strong correlations between the resulting estimates of average TL (e.g. Criscuolo et al. 2009; Aviv et al. 2011; Angelier et al. 2013). However, a growing number of published studies using qPCR in non-human animals have not validated their qPCR methodology against TRF. Our feeling is that the qPCR method can be validated internally and used alone, as long as: (i) full methodological details are presented, including complete descriptions of how amplification specificities and efficiencies were determined and used in quality control and calculations of TL, (ii) high within and among-plate repeatability can be demonstrated, and (iii) analyses and interpretations do not stretch beyond relative differences in TL among the samples in the specific study or experiment. That said, there are important reasons other than simply producing cross-method correlations that researchers might want to have more than one weapon in their methodological arsenal. While capable of generating large data sets rapidly, qPCR gives only a narrow window on telomere dynamics compared with some of the other available methods. It estimates average genomic telomere sequence content and does not capture the variation in TL present within a sample, which all other methods except the dot blot technique do provide in some form (Table1). Growing evidence points to important links between the range of TLs and cellular function, in particular the presence of critically short TLs (Hemann et al. 2001). Indeed, a recent study using a high-throughput adaptation of the Q-FISH method provides the first link between an increase in the number of very short telomeres and survival in laboratory mice (Vera et al. 2012). It may ultimately prove very important to move beyond the qPCR methodology if we want to address the importance of variation in TL or the presence of very short telomeres. Furthermore, although techniques other than qPCR and TRF may require considerable additional investment of time and money to set up and validate, it is important to appreciate the additional insights such techniques could offer. For instance, STELA could provide important insights into the relevance of critically short telomeres for whole organism function and fitness, while flow-FISH could provide a means of dissecting similarities and differences in the telomere dynamics among different kinds of blood cell.
A further consideration when choosing a telomere measurement technique and interpreting its results is the presence of interstitial telomeric repeats, which are found within the chromosomes of some organisms including many birds and mammals (Delany, Krupkin & Miller 2000; Ruiz-Herrera et al. 2009). Measurements using the qPCR, dot blot and denaturing TRF methods will incorporate both terminal and interstitial telomeric sequences (Table1). Non-denaturing in-gel hybridization TRF methods measure only terminal sequences, as do STELA and FISH techniques. Notably, a recent small-scale study of several passerine species used sequential application of non-denaturing and denaturing TRF gels to infer the relative amount of interstitial telomere sequence present (Foote, Vleck & Vleck 2013). The results suggest variation in interstitial telomere signal can be present at species, among- and within-individual levels, and may add noise to TL data possibly making it harder to find patterns. However, how this finding generalizes to other species or the mechanisms responsible evident variation in interstitial telomeric sequence are currently unclear (Foote, Vleck & Vleck 2013).
Pitfalls in the analysis of longitudinal telomere data
Two recent studies in the epidemiological telomere literature highlight serious statistical pitfalls that researchers in that field have repeatedly fallen foul of over the last decade or so, as longitudinal data on human telomere dynamics has become increasingly available (Steenstrup et al. 2013; Verhulst et al. 2013). We briefly discuss these in the hope that this will help alert ecologists and evolutionary biologists to the relevant issues and avoid similar mistakes being repeated and promulgated. Several longitudinal studies of humans have made the error of correlating the change in TL between two measurements with TL at the initial time point (Verhulst et al. 2013). The presence of a strong correlation has been interpreted as evidence that rates of telomere attrition are dependent on initial TL (e.g. Aviv et al. 2009; Nordfjall et al. 2009; Farzaneh-Far et al. 2010). However, such a correlation is expected as the result of a regression to the mean, and a recent analysis conclusively showed that a large proportion of the observed relationship between initial TL and change in TL is a statistical artefact (Verhulst et al. 2013). Researchers should avoid directly correlating a change in TL between two time points with measures at one of those time points, and if they feel they must do this should apply appropriate corrections to their analyses (see Verhulst et al. 2013). Several longitudinal human studies have also found that, despite the expectation that TL should decline with time or age, a sizeable proportion of individuals can show stable or increasing TL across a sampling period (e.g. Martin-Ruiz et al. 2005; Nordfjall et al. 2009; Svensson et al. 2011). A recent re-evaluation demonstrates that, in the majority of such studies, the proportion of individuals showing apparent telomere ‘elongation’ is well within that expected purely as a result of measurement error (Steenstrup et al. 2013). Another recent article offers a simple way of correcting for measurement error if the objective is to test for the presence of telomere elongation in a longitudinal sample (Simons, Stulp & Nakagawa 2013).
These recent studies highlight the importance of (i) calculating and presenting clear details of the measurement error associated with telomere length measurement in any publication, (ii) having longitudinal studies incorporating more than two time points and (iii) the application of statistical models that directly estimate and account for sampling error (e.g. Kim et al. 2011; Brown et al. 2012) and estimate individual variation in the rate of change in TL and its association with initial TL without falling foul of regression to the mean (e.g. random regression: Steenstrup et al. 2013; van de Pol 2012). Finally, several recent studies of wild birds suggest that environmental conditions experienced by individuals predict patterns of telomere length change (e.g. Mizutani et al. 2013; Young et al. 2013). Longitudinal ecological studies of telomere dynamics need to consider and account for differences in the environmental experiences of individuals but could offer potentially important insights into the environmental drivers of telomere length variation.
Conclusions
Measuring telomere length is technically challenging and requires a high level of expertise whatever the method used. Although the application of TRF and qPCR methods by evolutionary biologists and ecologists has been criticized (Nakagawa, Gemmell & Burke 2004; Horn, Robertson & Gemmell 2010), the emergence of longitudinal studies over the last few years has brought with it increasing evidence that TL is an important predictor of life span in both laboratory and field (Bize et al. 2009; Salomons et al. 2009; Heidinger et al. 2012; Angelier et al. 2013; Barrett et al. 2013) and is associated with previous stress, growth rates and reproduction (Geiger et al. 2012; Haussmann et al. 2012; Bauch, Becker & Verhulst 2013). Any researchers wishing to embark on a new study of telomere length may have various options when it comes to selecting the tissue or tissues to sample, the way to collect and store them, the protocol for DNA extraction and storage, and the method used to measure telomere length and analyse the resulting data. We hope to have provided a clear overview of the options available to researchers (Fig.1), and the potential advantages and drawbacks of different methods (Table1). Researchers within ecology and evolutionary biology should carefully consider the issues and options before embarking on a telomere study, and report details of their methodology, quality control thresholds and measurement error to the fullest extent possible when they publish. As long as due consideration and care are given to methodological rigour, consistency and clarity of reporting, we feel the study of telomere dynamics within evolutionary and ecological contexts has an exciting future.
Acknowledgments
This review is the result of discussions and collaborations emerging from a workshop on telomere dynamics in non-model organisms. The workshop was supported by a BBSRC International Workshop Grant and additional support from the Genetics Society and Agilent Technologies, and from a European Research Council Advanced Investigator Award to PM. We are grateful to all attendees at the workshop for their input into our discussions of telomere measurement methods, and to Abraham Aviv, Hannah Froy and Francois Criscuolo for their comments on draft manuscripts. DHN is supported by a BBSRC David Phillips fellowship.
Supporting Information
Additional Supporting Information may be found in the online version of this article.
List of species and tissue storage and DNA extraction methods and their suitability for subsequent telomere length analysis, based on past experience of the authors and personal communications with colleagues. AE and TE refer to commonly used buffer solutions: AE is a mixture of sodium acetate and EDTA, TE of Tris solution and EDTA.
References
- Angelier F, Vleck CM, Holberton RL. Marra PP. Telomere length, non-breeding habitat and return rate in male American redstarts. Functional Ecology. 2013;27:342–350. [Google Scholar]
- Armanios M. Blackburn EH. The telomere syndromes. Nature Reviews Genetics. 2012;13:693–704. doi: 10.1038/nrg3246. [DOI] [PMC free article] [PubMed] [Google Scholar]
- Aubert G, Hills M. Lansdorp PM. Telomere length measurement: caveats and a critical assessment of the available technologies and tools. Mutation Research. 2012;730:59–67. doi: 10.1016/j.mrfmmm.2011.04.003. [DOI] [PMC free article] [PubMed] [Google Scholar]
- Aubert G. Lansdorp PM. Telomeres and aging. Physiological Reviews. 2008;88:557–579. doi: 10.1152/physrev.00026.2007. [DOI] [PubMed] [Google Scholar]
- Aviv A, Valdes AM. Spector TD. Human telomere biology: pitfalls of moving from the laboratory to epidemiology. International Journal of Epidemiology. 2006;35:1424–1429. doi: 10.1093/ije/dyl169. [DOI] [PubMed] [Google Scholar]
- Aviv A, Chen W, Gardner JP, Kimura M, Brimacombe M, Cao XJ, Srinivasan SR. Berenson GS. Leukocyte telomere dynamics: longitudinal findings among young adults in the Bogalusa Heart Study. American Journal of Epidemiology. 2009;169:323–329. doi: 10.1093/aje/kwn338. [DOI] [PMC free article] [PubMed] [Google Scholar]
- Aviv A, Hunt SC, Lin J, Cao XJ, Kimura M. Blackburn E. Impartial comparative analysis of measurement of leukocyte telomere length/DNA content by Southern blots and qPCR. Nucleic Acids Research. 2011;39:1–5. doi: 10.1093/nar/gkr634. [DOI] [PMC free article] [PubMed] [Google Scholar]
- Baerlocher GM, Vulto I, de Jong G. Lansdorp PM. Flow cytometry and FISH to measure the average length of telomeres (flow FISH) Nature Protocols. 2006;1:2365–2376. doi: 10.1038/nprot.2006.263. [DOI] [PubMed] [Google Scholar]
- Baird DM. Mechanisms of telomeric instability. Cytogenetic and Genome Research. 2008;122:308–314. doi: 10.1159/000167817. [DOI] [PubMed] [Google Scholar]
- Baird DM. Royle NJ. Sequences from higher primates orthologous to the human Xp/Yp telomere junction region reveal gross rearrangements and high levels of divergence. Human Molecular Genetics. 1997;6:2291–2299. doi: 10.1093/hmg/6.13.2291. [DOI] [PubMed] [Google Scholar]
- Baird DM, Rowson J, Wynford-Thomas D. Kipling D. Extensive allelic variation and ultrashort telomeres in senescent human cells. Nature Genetics. 2003;33:203–207. doi: 10.1038/ng1084. [DOI] [PubMed] [Google Scholar]
- Barrett ELB, Boner W, Mulder E, Monaghan P, Verhulst S. Richardson DS. Absolute standards as a useful addition to the avian quantitative PCR telomere assay. Journal of Avian Biology. 2012;43:571–576. [Google Scholar]
- Barrett ELB, Burke TA, Hammers M, Komdeur J. Richardson DS. Telomere length and dynamics predict mortality in a wild longitudinal study. Molecular Ecology. 2013;22:249–259. doi: 10.1111/mec.12110. [DOI] [PubMed] [Google Scholar]
- Bauch C, Becker PH. Verhulst S. Telomere length reflects phenotypic quality and costs of reproduction in a long-lived seabird. Proceedings of the Royal Society B: Biological Sciences. 2013;280:20122540. doi: 10.1098/rspb.2012.2540. [DOI] [PMC free article] [PubMed] [Google Scholar]
- Benetos A, Kimura M, Labat C, Buchoff GM, Huber S, Labat L, Lu X. Aviv A. A model of canine leukocyte telomere dynamics. Aging Cell. 2011;10:991–995. doi: 10.1111/j.1474-9726.2011.00744.x. [DOI] [PMC free article] [PubMed] [Google Scholar]
- Benetos A, Kark JD, Susser E, Kimura M, Sinnreich R, Chen W, et al. Tracking and fixed ranking of leukocyte telomere length across the adult life course. Aging Cell. 2013;12:615–621. doi: 10.1111/acel.12086. [DOI] [PMC free article] [PubMed] [Google Scholar]
- Bize P, Criscuolo F, Metcalfe NB, Nasir L. Monaghan P. Telomere dynamics rather than age predict life expectancy in the wild. Proceedings of the Royal Society B: Biological Sciences. 2009;276:1679–1683. doi: 10.1098/rspb.2008.1817. [DOI] [PMC free article] [PubMed] [Google Scholar]
- Blackburn EH. Structure and function of telomeres. Nature. 1991;350:569–573. doi: 10.1038/350569a0. [DOI] [PubMed] [Google Scholar]
- Britt-Compton B, Rowson J, Locke M, Mackenzie I, Kipling D. Baird DM. Structural stability and chromosome-specific telomere length is governed by cis-acting determinants in humans. Human Molecular Genetics. 2006;15:725–733. doi: 10.1093/hmg/ddi486. [DOI] [PubMed] [Google Scholar]
- Brown D, Dechow C, Liu W, Harvatine K. Ott T. Association of telomere length with age, herd, and culling in lactating Holsteins. Journal of Dairy Science. 2012;95:6384–6387. doi: 10.3168/jds.2012-5593. [DOI] [PubMed] [Google Scholar]
- Bustin SA, Benes V, Garson JA, Hellemans J, Huggett J, Kubista M, et al. The MIQE guidelines: minimum information for publication of quantitative real-time PCR experiments. Clinical Chemistry. 2009;55:611–622. doi: 10.1373/clinchem.2008.112797. [DOI] [PubMed] [Google Scholar]
- Cawthon RM. Telomere measurement by quantitative PCR. Nucleic Acids Research. 2002;30:e47. doi: 10.1093/nar/30.10.e47. [DOI] [PMC free article] [PubMed] [Google Scholar]
- Cawthon RM. Telomere length measurement by a novel monochrome multiplex quantitative PCR method. Nucleic Acids Research. 2009;37:e21. doi: 10.1093/nar/gkn1027. [DOI] [PMC free article] [PubMed] [Google Scholar]
- Chang E. Harley CB. Telomere length and replicative aging in human vascular tissues. Proceedings of the National Academy of Sciences of the United States of America. 1995;92:11190–11194. doi: 10.1073/pnas.92.24.11190. [DOI] [PMC free article] [PubMed] [Google Scholar]
- Cheung I, Schertzer M, Baross A, Rose AM, Lansdorp PM. Baird DM. Strain-specific telomere length revealed by single telomere length analysis in Caenorhabditis elegans. Nucleic Acids Research. 2004;32:3383–3391. doi: 10.1093/nar/gkh661. [DOI] [PMC free article] [PubMed] [Google Scholar]
- Criscuolo F, Bize P, Nasir L, Metcalfe NB, Foote CG, Griffiths K, Gault EA. Monaghan P. Real-time quantitative PCR assay for measurement of avian telomeres. Journal of Avian Biology. 2009;40:342–347. [Google Scholar]
- Cunningham JM, Johnson RA, Litzelman K, Skinner HG, Seo S, Engelman CD, et al. Telomere length varies by DNA extraction method: implications for epidemiologic research. Cancer Epidemiology Biomarkers & Prevention. 2013;22:2047–2054. doi: 10.1158/1055-9965.EPI-13-0409. [DOI] [PMC free article] [PubMed] [Google Scholar]
- Daniali L, Benetos A, Susser E, Kark JD, Labat C, Kimura M, Desai K, Granick M. Aviv A. Telomeres shorten at equivalent rates in somatic tissues of adults. Nature Communications. 2013;4:1597. doi: 10.1038/ncomms2602. [DOI] [PMC free article] [PubMed] [Google Scholar]
- Delany ME, Krupkin AB. Miller MM. Organization of telomere sequences in birds: evidence for arrays of extreme length and for in vivo shortening. Cytogenetics and Cell Genetics. 2000;90:139–145. doi: 10.1159/000015649. [DOI] [PubMed] [Google Scholar]
- Derveaux S, Vandesompele J. Hellemans J. How to do successful gene expression analysis using real-time PCR. Methods. 2010;50:227–230. doi: 10.1016/j.ymeth.2009.11.001. [DOI] [PubMed] [Google Scholar]
- Epel ES, Blackburn EH, Lin J, Dhabhar FS, Adler NE, Morrow JD. Cawthon RM. Accelerated telomere shortening in response to life stress. Proceedings of the National Academy of Sciences of the United States of America. 2004;101:17312–17315. doi: 10.1073/pnas.0407162101. [DOI] [PMC free article] [PubMed] [Google Scholar]
- Farzaneh-Far R, Lin J, Epel E, Lapham K, Blackburn E. Whooley MA. Telomere length trajectory and its determinants in persons with coronary artery disease: longitudinal findings from the heart and soul study. PLoS ONE. 2010;5:e8612. doi: 10.1371/journal.pone.0008612. [DOI] [PMC free article] [PubMed] [Google Scholar]
- Foote CG, Vleck D. Vleck CM. Extent and variability of interstitial telomeric sequences and their effects on estimates of telomere length. Molecular Ecology Resources. 2013;13:417–428. doi: 10.1111/1755-0998.12079. [DOI] [PubMed] [Google Scholar]
- Geiger S, Le Vaillant M, Lebard T, Reichert S, Stier A, Le Maho Y. Criscuolo F. Catching-up but telomere loss: half-opening the black box of growth and ageing trade-off in wild king penguin chicks. Molecular Ecology. 2012;21:1500–1510. doi: 10.1111/j.1365-294X.2011.05331.x. [DOI] [PubMed] [Google Scholar]
- Gomes NMV, Shay JW. Wright WE. Telomere biology in Metazoa. Febs Letters. 2010a;584:3741–3751. doi: 10.1016/j.febslet.2010.07.031. [DOI] [PMC free article] [PubMed] [Google Scholar]
- Gomes NMV, Shay JW. Wright WE. Telomeres and telomerase. In: Wolf NS, editor; The Comparative Biology of Ageing. London: Springer; 2010b. pp. 227–258. [Google Scholar]
- Gomes NMV, Ryder OA, Houck ML, Charter SJ, Walker W, Forsyth NR, et al. Comparative biology of mammalian telomeres: hypotheses on ancestral states and the roles of telomeres in longevity determination. Aging Cell. 2011;10:761–768. doi: 10.1111/j.1474-9726.2011.00718.x. [DOI] [PMC free article] [PubMed] [Google Scholar]
- Hao L-Y, Armanios M, Strong MA, Karim B, Feldser DM, Huso D. Greider CW. Short telomeres, even in the presence of telomerase, limit tissue renewal capacity. Cell. 2005;123:1121–1131. doi: 10.1016/j.cell.2005.11.020. [DOI] [PubMed] [Google Scholar]
- Harley CB, Futcher AB. Greider CW. Telomeres shorten during ageing of human fibroblasts. Nature. 1990;345:458–460. doi: 10.1038/345458a0. [DOI] [PubMed] [Google Scholar]
- Hartmann N, Reichwald K, Lechel A, Graf M, Kirschner J, Dorn A, et al. Telomeres shorten while Tert expression increases during ageing of the short-lived fish Nothobranchius furzeri. Mechanisms of Ageing and Development. 2009;130:290–296. doi: 10.1016/j.mad.2009.01.003. [DOI] [PubMed] [Google Scholar]
- Haussmann MF. Marchetto NM. Telomeres: linking stress and survival, ecology and evolution. Current Zoology. 2010;56:714–727. [Google Scholar]
- Haussmann MF. Mauck RA. New strategies for telomere-based age estimation. Molecular Ecology Resources. 2008;8:264–274. doi: 10.1111/j.1471-8286.2007.01973.x. [DOI] [PubMed] [Google Scholar]
- Haussmann MF, Salomons H. Verhulst S. Telomere measurement tools: telometric produces biased estimates of telomere length. Heredity. 2011;107:371. doi: 10.1038/hdy.2011.10. [DOI] [PMC free article] [PubMed] [Google Scholar]
- Haussmann MF. Vleck CM. Telomere length provides a new technique for aging animals. Oecologia. 2002;130:325–328. doi: 10.1007/s00442-001-0827-y. [DOI] [PubMed] [Google Scholar]
- Haussmann MF, Longenecker AS, Marchetto NM, Juliano SA. Bowden RM. Embryonic exposure to corticosterone modifies the juvenile stress response, oxidative stress and telomere length. Proceedings of the Royal Society of London, Series B: Biological Sciences. 2012;279:1447–1456. doi: 10.1098/rspb.2011.1913. [DOI] [PMC free article] [PubMed] [Google Scholar]
- Heidinger BJ, Blount JD, Boner W, Griffiths K, Metcalfe NB. Monaghan P. Telomere length in early life predicts lifespan. Proceedings of the National Academy of Sciences of the United States of America. 2012;109:1743–1748. doi: 10.1073/pnas.1113306109. [DOI] [PMC free article] [PubMed] [Google Scholar]
- Hemann MT, Strong MA, Hao L-Y. Greider CW. The shortest telomere, not average telomere length, is critical for cell viability and chromosome stability. Cell. 2001;107:67–77. doi: 10.1016/s0092-8674(01)00504-9. [DOI] [PubMed] [Google Scholar]
- Horn T, Robertson BC. Gemmell NJ. The use of telomere length in ecology and evolutionary biology. Heredity. 2010;105:497–506. doi: 10.1038/hdy.2010.113. [DOI] [PubMed] [Google Scholar]
- Kim S, Sandler DP, Carswell G, Weinberg CR. Taylor JA. Reliability and short-term intra-individual variability of telomere length measurement using monochrome multiplexing quantitative PCR. PLoS ONE. 2011;6:e25774. doi: 10.1371/journal.pone.0025774. [DOI] [PMC free article] [PubMed] [Google Scholar]
- Kimura M. Aviv A. Measurement of telomere DNA content by dot blot analysis. Nucleic Acids Research. 2011;39:1–7. doi: 10.1093/nar/gkr235. [DOI] [PMC free article] [PubMed] [Google Scholar]
- Kimura M, Gazitt Y, Cao X, Zhao X, Lansdorp PM. Aviv A. Synchrony of telomere length among hematopoietic cells. Experimental Hematology. 2010a;38:854–859. doi: 10.1016/j.exphem.2010.06.010. [DOI] [PMC free article] [PubMed] [Google Scholar]
- Kimura M, Stone RC, Hunt SC, Skurnick J, Lu XB, Cao XJ, Harley CB. Aviv A. Measurement of telomere length by the Southern blot analysis of terminal restriction fragment lengths. Nature Protocols. 2010b;5:1596–1607. doi: 10.1038/nprot.2010.124. [DOI] [PubMed] [Google Scholar]
- Lansdorp PM, Verwoerd NP, van de Rijke FM, Dragowska V, Little M-T, Dirks RW, Raap AK. Tanke HJ. Heterogeneity in telomere length of human chromosomes. Human Molecular Genetics. 1996;5:685–691. doi: 10.1093/hmg/5.5.685. [DOI] [PubMed] [Google Scholar]
- Lin TT, Letsolo BT, Jones RE, Rowson J, Pratt G, Hewamana S, Fegan C, Pepper C. Baird DM. Telomere dysfunction and fusion during the progression of chronic lymphocytic leukemia: evidence for a telomere crisis. Blood. 2010;116:1899–1907. doi: 10.1182/blood-2010-02-272104. [DOI] [PubMed] [Google Scholar]
- Martin-Ruiz CM, Gussekloo J, van Heemst D, von Zglinicki T. Westendorp RGJ. Telomere length in white blood cells is not associated with morbidity or mortality in the oldest old: a population-based study. Aging Cell. 2005;4:287–290. doi: 10.1111/j.1474-9726.2005.00171.x. [DOI] [PubMed] [Google Scholar]
- Mizutani Y, Tomita N, Niizuma Y. Yoda K. Environmental perturbations influence telomere dynamics in long-lived birds in their natural habitat. Biology Letters. 2013;9:20130511. doi: 10.1098/rsbl.2013.0511. [DOI] [PMC free article] [PubMed] [Google Scholar]
- Monaghan P. Crossing the great divide: telomeres and ecology. Heredity. 2010a;105:574–575. doi: 10.1038/hdy.2010.120. [DOI] [PubMed] [Google Scholar]
- Monaghan P. Telomeres and life histories: the long and the short of it. Annals of the New York Academy of Sciences. 2010b;1206:130–142. doi: 10.1111/j.1749-6632.2010.05705.x. [DOI] [PubMed] [Google Scholar]
- Monaghan P. Haussmann MF. Do telomere dynamics link lifestyle and lifespan? Trends in Ecology & Evolution. 2006;21:47–53. doi: 10.1016/j.tree.2005.11.007. [DOI] [PubMed] [Google Scholar]
- Nakagawa S, Gemmell NJ. Burke T. Measuring vertebrate telomeres: applications and limitations. Molecular Ecology. 2004;13:2523–2533. doi: 10.1111/j.1365-294X.2004.02291.x. [DOI] [PubMed] [Google Scholar]
- Nordfjall K, Svenson U, Norrback K-F, Adolfsson R, Lenner P. Roos G. The individual blood cell telomere attrition rate is telomere length dependent. Plos Genetics. 2009;5:e1000375. doi: 10.1371/journal.pgen.1000375. [DOI] [PMC free article] [PubMed] [Google Scholar]
- O'Callaghan NJ, Dhillon VS, Thomas P. Fenech M. A quantitative real-time PCR method for absolute telomere length. BioTechniques. 2008;44:807–809. doi: 10.2144/000112761. [DOI] [PubMed] [Google Scholar]
- Olsen MT, Berube M, Robbins J. Palsboll PJ. Empirical evaluation of humpback whale telomere length estimates; quality control and factors causing variability in the singleplex and multiplex qPCR methods. BMC Genetics. 2012;13:77. doi: 10.1186/1471-2156-13-77. [DOI] [PMC free article] [PubMed] [Google Scholar]
- Pauliny A, Wagner RH, Augustin J, Szep T. Blomqvist D. Age-independent telomere length predicts fitness in two bird species. Molecular Ecology. 2006;15:1681–1687. doi: 10.1111/j.1365-294X.2006.02862.x. [DOI] [PubMed] [Google Scholar]
- Pfaffl MW. A new mathematical model for relative quantification in real-time RT-PCR. Nucleic Acids Research. 2001;29:e45. doi: 10.1093/nar/29.9.e45. [DOI] [PMC free article] [PubMed] [Google Scholar]
- van de Pol M. Quantifying individual variation in reaction norms: how study design affects the accuracy, precision and power of random regression models. Methods in Ecology and Evolution. 2012;3:268–280. [Google Scholar]
- Poon SS, Martens UM, Ward RK. Lansdorp PM. Telomere length measurements using digital fluorescence microscopy. Cytometry. 1999;36:267–278. doi: 10.1002/(sici)1097-0320(19990801)36:4<267::aid-cyto1>3.0.co;2-o. [DOI] [PubMed] [Google Scholar]
- Riethman H. Human subtelomeric copy number variations. Cytogenetic and Genome Research. 2008;123:244–252. doi: 10.1159/000184714. [DOI] [PMC free article] [PubMed] [Google Scholar]
- Royle NJ, Baird DM. Jeffreys AJ. A subterminal satellite located adjacent to telomeres in chimpanzees is absent from the human genome. Nature Genetics. 1994;6:52–56. doi: 10.1038/ng0194-52. [DOI] [PubMed] [Google Scholar]
- Royle NJ, Hill MC. Jeffreys AJ. Isolation of telomere junction fragments by anchored polymerase chain reaction. Proceedings of the Royal Society of London. Series B: Biological Sciences. 1992;247:57–67. doi: 10.1098/rspb.1992.0009. [DOI] [PubMed] [Google Scholar]
- Rufer N, Dragowska W, Thornbury G, Roosnek E. Lansdorp PM. Telomere length dynamics in human lymphocyte subpopulations measured by flow cytometry. Nature Biotechnology. 1998;16:743–747. doi: 10.1038/nbt0898-743. [DOI] [PubMed] [Google Scholar]
- Ruijter JM, Ramakers C, Hoogaars WMH, Karlen Y, Bakker O, van den Hoff MJB. Moorman AFM. Amplification efficiency: linking baseline and bias in the analysis of quantitative PCR data. Nucleic Acids Research. 2009;37:e45. doi: 10.1093/nar/gkp045. [DOI] [PMC free article] [PubMed] [Google Scholar]
- Ruiz-Herrera A, Nergadze S, Santagostino M. Giulotto E. Telomeric repeats far from the ends: mechanisms of origin and role in evolution. Cytogenetic and Genome Research. 2009;122:219–228. doi: 10.1159/000167807. [DOI] [PubMed] [Google Scholar]
- Salomons HM, Mulder GA, van de Zande L, Haussmann MF, Linskens MHK. Verhulst S. Telomere shortening and survival in free-living corvids. Proceedings of the Royal Society B: Biological Sciences. 2009;276:3157–3165. doi: 10.1098/rspb.2009.0517. [DOI] [PMC free article] [PubMed] [Google Scholar]
- Schroeder T. Hematopoietic stem cell heterogeneity: subtypes, not unpredictable behavior. Cell Stem Cell. 2010;6:203–207. doi: 10.1016/j.stem.2010.02.006. [DOI] [PubMed] [Google Scholar]
- Shiels PG, Kind AJ, Campbell KH, Waddington D, Wilmut I, Colman A. Schnieke AE. Analysis of telomere lengths in cloned sheep. Nature. 1999;399:316–317. doi: 10.1038/20580. [DOI] [PubMed] [Google Scholar]
- Simons MJP, Stulp G. Nakagawa S. A statistical approach to distinguish telomere elongation from error in longitudinal data sets. Biogerontology. 2013;15:99–103. doi: 10.1007/s10522-013-9471-2. [DOI] [PubMed] [Google Scholar]
- Smith S, Turbill C. Penn DJ. Chasing telomeres, not red herrings, in evolutionary ecology. Heredity. 2011;107:372–373. doi: 10.1038/hdy.2011.14. [DOI] [PMC free article] [PubMed] [Google Scholar]
- Steenstrup T, Hjelmborg JV, Kark JD, Christensen K. Aviv A. The telomere lengthening conundrum-artifact or biology? Nucleic Acids Research. 2013;41:e131. doi: 10.1093/nar/gkt370. [DOI] [PMC free article] [PubMed] [Google Scholar]
- Svensson U, Nordfjall K, Baird DM, Roger L, Osterman P, Hellenius M-L. Roos G. Blood cell telomere length is a dynamic feature. PLoS ONE. 2011;6:e21485. doi: 10.1371/journal.pone.0021485. [DOI] [PMC free article] [PubMed] [Google Scholar]
- Turbill C, Smith S, Deimel C. Ruf T. Daily torpor is associated with telomere length change over winter in Djungarian hamsters. Biology Letters. 2012;8:304–307. doi: 10.1098/rsbl.2011.0758. [DOI] [PMC free article] [PubMed] [Google Scholar]
- Vera E, Bernardes de Jesus B, Foronda M, Flores JM. Blasco MA. The rate of increase of short telomeres predicts longevity in mammals. Cell Reports. 2012;2:732–737. doi: 10.1016/j.celrep.2012.08.023. [DOI] [PubMed] [Google Scholar]
- Verhulst S, Aviv A, Benetos A, Berenson GS. Kark JD. Do leukocyte telomere length dynamics depend on baseline telomere length? An analysis that corrects for regression to the mean. European Journal of Epidemiology. 2013;11:859–866. doi: 10.1007/s10654-013-9845-4. [DOI] [PubMed] [Google Scholar]
- Wang Z, Rhee DB, Lu J, Bohr CT, Zhou F, Vallabhaneni H, de Souza-Pinto NC. Liu Y. Characterization of oxidative guanine damage and repair in mammalian telomeres. Plos Genetics. 2010;6:e1000951. doi: 10.1371/journal.pgen.1000951. [DOI] [PMC free article] [PubMed] [Google Scholar]
- Weng N-P. Interplay between telomere length and telomerase in human leukocyte differentiation and aging. Journal of Leukocyte Biology. 2001;70:861–867. [PubMed] [Google Scholar]
- Young RC, Kitaysky AS, Haussmann MF, Descamps S, Orben RA, Elliott KH. Gaston AJ. Age, sex, and telomere dynamics in a long-lived seabird with male-biased parental care. PLoS ONE. 2013;8:e74931. doi: 10.1371/journal.pone.0074931. [DOI] [PMC free article] [PubMed] [Google Scholar]
- von Zglinicki T. Oxidative stress shortens telomeres. Trends in Biochemical Sciences. 2002;27:339–344. doi: 10.1016/s0968-0004(02)02110-2. [DOI] [PubMed] [Google Scholar]
Associated Data
This section collects any data citations, data availability statements, or supplementary materials included in this article.
Supplementary Materials
List of species and tissue storage and DNA extraction methods and their suitability for subsequent telomere length analysis, based on past experience of the authors and personal communications with colleagues. AE and TE refer to commonly used buffer solutions: AE is a mixture of sodium acetate and EDTA, TE of Tris solution and EDTA.