

Abstract
Our previous studies indicated that decreasing visceral adipose tissue by surgical removal of the parametrial fat pads inhibited UVB-induced carcinogenesis in SKH-1 mice fed a high fat diet (HFD), but not a low fat diet (LFD) indicating that the parametrial fat tissue from mice fed a HFD played a role in skin carcinogenesis.
Objective
In the present study, we sought to investigate how a HFD may influence the intrinsic properties of the parametrial fat tissue to influence UVB-induced skin tumor formation.
Methods and results
Immunohistochemical staining, adipokine array, and flow cytometry showed that parametrial fat tissue from mice fed a HFD had a higher density of macrophage-fused dead adipocytes (crown-like structures), more adipokines, and stimulated the production of more reactive oxygen species compared with parametrial fat tissue from mice fed a LFD. These differences between parametrial fat tissue from mice fed a HFD and LFD were associated with their effect on the in vitro transformation of mouse epidermal JB6 cells. Our results indicated that fat tissue filtrate (an aqueous filtrate made from the parametrial fat pad) from mice fed a HFD enhanced the conversion of JB6 cells from an epithelial-like morphology to cells with a fibroblast-like morphology to a greater extent than fat tissue filtrate from mice fed a LFD. Studies indicated that the fibroblast-like cells had decreased levels of E-cadherin, increased levels of Twist as assayed by western blot. Fat tissue filtrate made from the parametrial fat tissue of mice fed a HFD had 160% more transforming activity than that from mice fed a LFD and formed malignant mesenchymal tumors in vivo.
Conclusion
These studies provide the first in vitro demonstration of a parametrial fat tissue-induced transformation of an epidermal cell.
Keywords: high fat diet, parametrial fat tissue, JB6 cell transformation
Introduction
Non-melanoma skin cancer is the most common neoplasm in the United States with over 2 million new cases diagnosed per year caused predominantly by exposure to UVA and UVB in sunlight, the most prevalent environmental carcinogen (1). Epidemiological studies indicate that high fat diets are associated with an increased risk of non-melanoma skin cancer, and patients who reduce their intake of calories from fat have a reduced reoccurrence of prior actinic keratoses and non-melanoma skin cancers (2, 3). Our previous research demonstrated that feeding a high fat diet to SKH-1 mice enhanced UVB-induced skin cancer (4, 5) and that reducing parametrial fat tissue (visceral fat around the uterus) by caffeine administration, voluntary exercise or directly removal of the parametrial fat pad by surgical procedure inhibited UVB-induced skin tumor formation (6–9). Interestingly, decreasing visceral adipose tissue by surgical removal of the parametrial fat pads inhibited UVB-induced carcinogenesis in SKH-1 mice fed a high fat diet (HFD), but not a low fat diet (LFD) indicating that the parametrial fat tissue from mice fed a HFD played a role in skin carcinogenesis. These data suggested that the parametrial fat tissue from mice fed a HFD secretes tumorigenic substances that promote skin tumor formation. Next, we sought to investigate how a HFD may influence the intrinsic properties of the parametrial fat tissue to influence UVB-induced skin tumor formation. As the mouse Balb/C epidermal JB6 P+ cell line has been utilized as a well-characterized in vitro model for neoplastic transformation by tumor promoters such as 12-O-tetradecanoylphorbol-13-acetate (TPA) (10), to determine the differences between visceral fat tissue from mice fed either a HFD or LFD in carcinogenesis, we tested the effect of an aqueous filtrate made from parametrial fat tissue on the in vitro transformation of JB6 epidermal cells.
Methodology
Animals, parametrial fat pad isolation and diet
Female SKH-1 hairless mice (6–7 weeks old) were purchased from Charles River Breeding Laboratories. Mice (six per group) were fed the low fat chow or high fat diets for 4 months prior to performing parametrial fat pad isolation by sterile technique as described previously. Isolated parametrial fat pads were weighed and placed in a sterilized tube for future use. The 13.5% kcal Purina laboratory chow 5001 chow diet was purchased from the Ralston Purina Co. (St. Louis, MO). The 60% kcal high fat diet is AIN 76A modified Rodent OpenSource Diet and purchased from Research Diets, Inc. (New Brunswick, NJ). This diet contains 34.9% fat by weight, and 54.4% of the total calories come from lard as described in (11).
Measurement of crown-like structures (CLS) by immunohistochemistry
Parametrial fat tissue was dissected and fixed in 10% buffer-formalin overnight at room temperature and embedded in paraffin. Four micron-thick sections were cut, deparaffinized in xylene, rehydrated in a graded ethanol series, and used for staining. Immunohistochemical staining was performed using a standard protocol. Serial sections were microwave-treated in 10 mmol/l citrate buffer (pH 6.0) and then incubated for 1 h at room temperature with primary antibodies, mouse monoclonal F4/80 (Abcam, Cambridge, MA). After rinsing in PBS buffer containing 0.25% Triton X-100 (pH 7.2), sections were incubated with secondary biotinylated goat anti-mouse (Abcam) antibodies. Avidin-biotin peroxidase complexes (Vector Laboratories, Burlingame, CA) were added followed by visualization with 3.3′-diaminobenzidine tetrachloride (Vector). All sections were counterstained with Harris hematoxylin. For each sample, the numbers of crown-like structures within the entire section were counted by two independent observers using a light microscope and normalized for the total section area as expressed as CLS per mm2 of tissue section.
Preparation of fortified minimum essential medium and protein measurements
A homogenate of the parametrial fat tissue was placed in a Millicell hanging polyethylene terephthalate insert (a 15-mm wide insert that has 0.4 μm pores which permitted the diffusion of small molecules pass through into the medium) and placed in 1 mL of minimal essential medium (MEM) (phenol-red free) to make MEM fortified with an aqueous filtrate of the parametrial fat pads. This method allowed the minimization of lipid diffusion and the enrichment of protein. Homogenized fat tissue was made using the Qiagen TissueRuptor on medium speed at 10 sec per 100 mg fat tissue. Substances as well as other fat tissue constituents passed through the 0.4 μm pores membrane of the insert into the medium were collected. Protein concentration in fortified medium was quantified using the Thermo Scientific™ Pierce™ BCA Protein Assay kit.
Adipokine array
Measurement of mouse adipokines (detection of 38 adipokines) from fat tissue filtrates was performed using the Mouse Adipopkine Antibody Array kit (purchased from R&D Systems) as previously described (7). Briefly, membranes were treated with 2 mL of blocking buffer and then incubated overnight with 1 mL of fat tissue filtrates containing 150 μg protein at 4 °C. After washing, 1 mL of a mixture of biotinconjugated antibodies that are specific to the different targets on the array were added for 1 h and then incubated with 2 mL of HRP-conjugated streptavidin at room temperature for 2 h. The membranes were then treated with 500 μL of detection buffer for 2 min and, finally, exposed to X-ray film using film developer. By comparing the signal intensities, relative expression levels of cytokines were determined and quantified by densitometry using Image J software. Positive controls were used to normalize the results. Adipokine array was performed at least 3 times for each treatment group.
Cell Culture and Reagents
JB6 P+ cells (Cl 41-5a; JB6 cells) were obtained from the American Type Culture Collection (Manassas, VA). The JB6 cells were cultured in monolayers at 37°C, 5% CO2 with Eagle’s minimal essential medium (MEM) (Sigma) containing 5% fetal bovine serum (FBS) (Sigma), 2 mM L-glutamine, penicillin 100 (units/mL) and streptomycin (100 μg/mL). Difco Agar was purchased from Becton Dickson and Company (Franklin Lakes, NJ).
Measurement of reactive oxygen species by flow cytometry
JB6 cells (70% confluent) were treated with fat tissue filtrate (50 μg protein/mL), 5% FBS, or TPA (10 ng/mL) with 5% FBS for 1, 4, 8, 24 and 48 hours, respectively. During the last 30 minutes of culture, cells were incubated with 10 μM 2′, 7′-dichlorodihydrofluorescein diacetate (H2DCF-DA) at 37°C. Cells were then washed with PBS, trypsinized and resuspended in PBS for measurement of fluorescence on a Beckman Coulter FC500 flow cytometer. The conversion of dichlorodihydrofluorescein (H2DCF-DA; non-fluorescent) to 2′,7′-dichlorofluorescein (DCF; fluorescent) detects a broad range of oxidants, including superoxide, peroxynitrate, hydrogen peroxide, and nitric oxide (NO). Mean fluorescence intensity of the 2′, 7′-dichlorofluorescein (DCF) of 5,000 events was calculated.
JB6 cell proliferation and transformation
JB6 cells were seeded at 100 cells per well of a 6-well plate in 1 ml of MEM containing 5% FBS. 24 hours later, the medium was removed and fresh MEM containing fat tissue filtrate only (without FBS) was added. JB6 cells were cultured for 7 days, washed with 5% PBS and fixed in 90% ice cold ethanol for 10 minutes. Clones were stained with Giemsa solution for 10 minutes, air-dried and counted. Clone morphology were analyzed by light microscopy.
Following a 7 day culture of JB6 cells treated with fat tissue filtrate (50 μg protein/mL) alone or with 5% FBS as a control, 104 cells in 1.5 mL of 0.33% Difco Agar in MEM containing 5% FBS were plated over 7 mL of 0.5% Difco Agar in MEM containing 10% FBS in 60 mm dishes. The cultures were maintained at 37°C in a 5% CO2 incubator for 14 days. Cell colonies that grew on soft agar were scored by counting the number of colonies with 8 or more cells in a 40-fold light microscopic magnification.
Western blotting analysis
Cells (105) were incubated with 50 μL lysis buffer supplemented with phenylmethanesulfonylfluoride on ice. Samples were clarified by centrifugation at 22,000 × g for 5 min at 4°C. Lysates containing equal amounts of total protein (20 μg) were separated in Bio-Rad mini Protean gels (Hercules, CA). Gels were run and transferred onto polyvinylidene difluoride transfer membranes (Millipore, Bedford, MA). Membranes were blocked with the Odyssey infrared imaging system blocking buffer (LI-COR, Lincoln, NE) probed with primary antibodies to E-cadherin (ab53033; 1:500) or Twist (ab50887; 1:50), purchased from Abcam, Cambridge, MA, overnight at 4°C. Membranes were washed and incubated with goat anti-rabbit IRDye 800 (Rockland Immunochemicals, Gilbertsville, PA) or goat anti-mouse IRDye 680 Infrared (Li-COR) for 30 min at room temperature. Membranes were washed and fluorescence was detected using the Odyssey infrared imaging system (LI-COR).
Statistical analysis
Student’s t tests (unpaired, two-tailed) were used to determine differences between treatments using Microsoft Excel. The data were expressed as the mean ± SEM. Differences were considered significant at P < 0.05.
Results
Cellular and molecular differences between HFD and LFD fat tissue
Our previous studies indicated that decreasing visceral adipose tissue by surgical removal of the parametrial fat pads inhibited UVB-induced carcinogenesis in SKH-1 mice fed a HFD, but not a LFD indicating that the parametrial fat tissue from mice fed a HFD played a role in skin carcinogenesis. To understand how a HFD may influence the intrinsic properties of the parametrial fat tissue to influence UVB-induced skin tumor formation we investigated differences between HFD and LFD fat tissue in the expression of crown-like structures (CLS), the surrogate marker for dead adipocytes. CLS are indicated by an F4/80 macrophage stain to show resident macrophages that infiltrated to engulf necrotic adipose tissue. Mice fed a HFD for 4 months had more parametrial fat tissue (Fig. 1A) that was characterized larger adipocytes and a higher density of CLS (88.8 ± 8.0 mm2; dark brown stain) compared with mice fed a LFD (0.9 ± 0.2 mm2; Fig. 1B).
Figure 1. Effect of high fat diet feeding on parametrial fat pad size and crown-like structure density.

A. Picture demonstrating parametrial fat pad (fat tissue) size after 4 months of LFD or HFD feeding. B. Parametrial fat was fixed in formalin and immunohistochemically stained with F4/80 for CLS. Pictures were taken under 100× microscopic magnification with a light microscope and are representative of data obtained from more than three mice. Parametrial fat from mice fed a HFD demonstrated larger adipocytes and a higher density of CLS (88.8 ± 8.0 mm2; dark brown stain) compared with mice fed a LFD (0.9 ± 0.2 mm2).
To determine if the presence of CLS was associated with adipokine expression, parametrial fat pads were isolated under sterile conditions from mice fed a HFD or LFD. The parametrial fat tissue was homogenized, and 500 μL (approximately 0.5 g) was placed in a 15-mm wide insert with 0.4 μm pores which permitted the diffusion of small molecules released from the fat tissue to pass through into the minimal essential medium (MEM; Fig. 2A). The fat tissue homogenate in the insert was incubated at 37°C and the medium was collected hourly (0–8 h) for protein quantitation (Fig. 2B). Protein levels increased over time and plateaued at 4 h (Fig. 2B). Therefore, we collected the fortified medium of fat tissue filtrate at 4 h for experimental treatments. In addition, we found that more protein was filtrated into MEM from the fat tissue filtrate of mice fed a LFD than from mice fed a HFD (Fig. 2B). Similar results were observed for non-homogenized fat tissue. Fat tissue filtrates from mice fed a HFD for 3–6 months demonstrated higher levels of adipokines compared with that from mice fed a LFD. Elevated amounts of monocyte chemoattractant protein-1 (MCP-1), interleukin-6 (IL-6), leptin, Serpin E1/plasminogen activator inhibitor-1 (PAI-1) and intracellular adhesion molecule-1 (ICAM-1) were released from the parametrial fat tissue of mice fed a HFD compared with a LFD (Fig. 2C). Of these elevated adipokines, only ICAM-1 was present in fat tissue filtrate of mice fed a LFD (Fig. 2C).
Figure 2. Effect of high fat diet feeding on adipokine production and reactive oxygen species stimulation.

A. Parametrial fat pad homogenate (0.5 g fat) from female SKH-1 mice that had been fed a 60% kcal high fat diet (HFD) or low fat chow diet (LFD) for 4 months was placed in 1.0 mL of MEM on a hanging well insert. Cytokines and other fat constituents passed through a polyethylene terephthalate membrane with 0.4 μm pores in the insert for 4 hours to provide fat tissue filtrate in MEM. B. Fat was isolated and fat tissue filtrate was made as described in (A). Graph demonstrates the amount of protein in MEM following culture with parametrial fat tissue homogenate or parametrial fat pad secretions from an intact piece of fat. C. Elevated amounts of monocyte chemoattractant protein-1 (MCP-1), interleukin-6 (IL-6), leptin, Serpin E1/plasminogen activator inhibitor-1 (PAI-1) and intracellular adhesion molecule-1 (ICAM-1) were released from the parametrial fat of mice fed a HFD compared with a LFD. D. Mean fluorescence intensity of the 2′, 7′-dichlorofluorescein (DCF) (excitation 488 nm; fluorescence 530 nm) +/− 15 of 5,000 events was measured. Fat tissue filtrate (50 μg protein/mL), or TPA (10 ng/mL) induced ROS in JB6 cells. HFD fat tissue filtrate treatment stimulated the formation of ROS 48% more than LFD fat tissue filtrate as measured by DCF fluorescence at 8 hours **P<0.01. All data are mean ± SEM, Student t test (unpaired, two-tailed).
Both macrophages and adipokines have been shown to cause the release of and stimulate the production of reactive oxygen species (ROS) from tissue, so we next looked at the effect of the fat tissue filtrate on the induction of ROS in JB6 cells. Cells were treated with TPA as a control because JB6 cell transformation by TPA is dependent on the generation of ROS (12). Treatment of JB6 cells with fat tissue filtrate (50 μg protein/mL) from mice fed a LFD or HFD for 4 months resulted in a rapid increase in ROS as measured by DCF fluorescence starting as early as 1 h post-fat tissue filtrate treatment (Fig. 2D). There was an approximate 50- and 80-fold increase, respectively, in the level of ROS in JB6 cells treated with fat pad filtrate from mice fed a LFD or HFD compared with cells treated with 5% FBS at 8 h after treatment (time of peak response) (Fig. 2D). ROS levels were 48% higher (**P<0.01) at 8 h in JB6 cells treated with fat tissue filtrate from mice fed a LFD compared with a HFD (Fig. 2D). ROS was still 10-fold higher in JB6 cells treated with fat tissue filtrate from mice fed a LFD or HFD compared with cells treated with 5% FBS at 24–48 h (Fig. 2D). Treatment of JB6 cells with TPA (10 ng/mL) as a control resulted in a 25- to 30-fold increase in ROS at 4 h post-treatment (time of peak response), and ROS returned to control levels by 24–48 h post-treatment. TPA treatment in the absence of FBS stimulated ROS formation to a higher extent than the other treatments, however, this caused cell death (data not shown). In summary, the fat tissue filtrate from mice fed HFD was more active than fat tissue filtrate from mice fed the LFD, and TPA had the least activity for stimulating the formation of ROS.
Fat tissue filtrate from mice fed a high fat diet stimulates the proliferation of JB6 cells growing in liquid medium
JB6 cells were treated with fat tissue filtrate (50 μg protein/mL) from mice fed a LFD or HFD in the absence of FBS or with 1 or 5% FBS as controls. Cell number was counted at 1, 3, 5, and 7 days of incubation. Fat tissue filtrate (50 μg protein/mL) from mice fed a HFD stimulated JB6 cell proliferation in the absence of serum to about the same extent as was observed for cells cultured with 5% FBS and significantly more than that from mice fed a LFD (*P<0.05, Fig. 3A). To determine the dose response of the fat tissue filtrate, cells were treated with 25, 50 and 100 μg protein/mL of the fat tissue filtrate or with 5% FBS as a control. After 7 days of treatment, cloning efficiency was measured by the number of well-separated Giemsa stained clones. Fat tissue filtrate from mice fed a LFD or HFD for 4 months dose-dependently increased the number of JB6 clones (Fig. 3B). Cloning efficiency was increased by 166% with 25 μg protein/mL, by 50% with 50 μg protein/mL, and by 29% with 100 μg protein/mL of fat pad filtrate from mice fed a HFD compared with fat pad filtrate from mice fed a LFD (*P<0.05, Fig. 3B).
Figure 3. Fat tissue filtrate from mice fed a high fat diet stimulates the proliferation of JB6 cells growing in liquid medium.
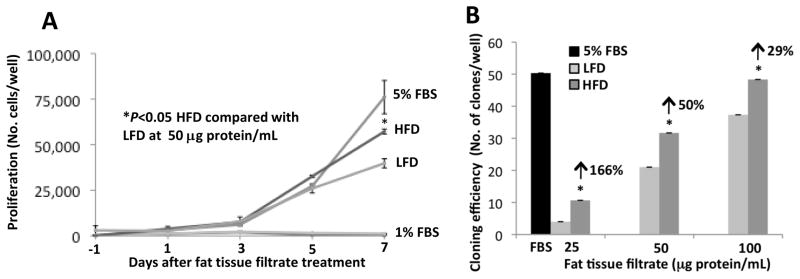
A. JB6 cells were treated with 1% FBS, 5% FBS or fat tissue filtrate (50 μg protein/mL) from mice fed a LFD or HFD for 4 months and were counted at 1, 3, 5, and 7 days. The fat tissue filtrate from mice fed a HFD stimulated JB6 cell proliferation to about the same extent as 5% FBS and significantly more than that from mice fed a LFD (* P<0.05). One well = 9.6 cm2. B. JB6 cells were seeded at 100 cells per well in a 6-well plate. Cells were treated with 5% FBS or fat tissue filtrate from mice fed a HFD for 7 days and stained with Giemsa. Cloning efficiency, as measured by the number of Giemsa-stained clones, was significantly increased to a greater extent in JB6 cells cultured with fat tissue filtrate from mice fed a HFD for 4 months compared with cells cultured with fat tissue filtrate from mice fed a LFD for 4 months (*P<0.05). Arrows indicate % increase in cloning efficiency at the different doses. One well = 9.6 cm2. Data are mean ± SEM, Student t test (unpaired, two-tailed).
Fat tissue filtrate from mice fed a high fat diet stimulates the formation of a fibroblast-like morphology of JB6 cells growing in liquid medium
JB6 cells were plated at 100 cells per well in a 6-well plate and treated with fat tissue filtrate (25–100 μg protein/mL) from mice fed a HFD. Giemsa staining of JB6 cells after growing in liquid medium for 7 days showed clones that were characterized as either having an epithelial-like or a fibroblast-like morphology (Fig. 4A, B). Exposure of JB6 cells to fat tissue filtrate from mice fed a HFD for 7 days increased the number of clones with a fibroblast-like morphology (Fig. 4A). Many of the fibroblast-like clones showed the piling up of cells suggestive of foci formation and the loss of contact dependent growth inhibition (Fig. 4A), key features of transformed cells. The fibroblast-like clones pictured were characterized as being either early-(A2), middle-(A3), or late-stage (A3) depending upon the size of the foci formed (Fig. 4A). Morphological changes present in JB6 cells following exposure of the cells to fat tissue filtrate from mice fed a HFD were consistent with those associated with an epithelial-mesenchymal transition. Therefore we examined hallmark characteristics of this process and found that treatment of JB6 cells with fat tissue filtrate from mice fed a HFD resulted in the loss of E-cadherin and the induction of Twist, a transcriptional repressor of E-cadherin (Fig. 4B). Our results suggest that treatment of JB6 cells with fat tissue filtrate from mice fed a HFD enhanced epithelial-mesenchymal transition.
Figure 4. Fat tissue filtrate from mice fed a high fat diet stimulates the formation of a fibroblast-like morphology of JB6 cells growing in liquid medium.

A. JB6 cells were seeded at 100 cells per well in a 6-well plate. Cells were treated with 5% FBS or fat tissue filtrate from mice fed a HFD for 7 days and stained with Giemsa. The picture shows a comparison of epithelial-like morphology and fibroblast-like morphology of JB6 cells (magnification = 400×). The fibroblast-like clones pictured were characterized as being either early-(A2), middle-(A3), or late-stage (A3) depending upon the size of the foci formed. B. JB6 cells were treated for 7 days with 5% FBS or fat tissue filtrate (50 μg protein/mL) from mice fed a HFD. E-cadherin, Twist and β-Actin levels were determined in the epithelial-like and fibroblast-like clones by western blotting. C. JB6 cells were seeded and treated as described in (A). JB6 cells treated with fat tissue filtrate (50 or 100 μg protein/mL) from mice fed a HFD had a greater ratio of clones with fibroblast-like to epithelial-like cells when compared with cells cultured with fat tissue filtrate from mice fed a LFD (*P<0.05). Arrows indicate % increase in the ratio of fibroblast-like to epithelial-like clones at the different doses. One well = 9.6 cm2. All data are mean ± SEM, Student t test (unpaired, two-tailed).
The ratio of clones with fibroblast-like cells to clones with epithelial-like cells was increased in JB6 cells cultured with fat tissue filtrate from mice fed HFD or LFD when compared with JB6 cells cultured with 5% FBS (Fig. 4C). In addition, JB6 cells treated with fat tissue filtrate from mice fed the HFD had a greater ratio of clones with fibroblast-like morphology to epithelial-like morphology when compared with cells cultured with fat tissue filtrate from mice fed the LFD at 50 and 100 μg protein/mL by 66% and 152% (*P<0.05, Fig. 4C). Although a similar difference was observed between the two groups when JB6 cells were treated with a lower concentration of fat tissue filtrate (25 μg protein/mL), the results were not statistically significant, which may be due to the low number of clones (Fig. 4C). Overall, these data suggest that fat tissue filtrate from mice fed a HFD will stimulate the conversion from an epithelial to a mesenchymal phenotype to a greater extent than that from mice fed a LFD.
Fat tissue filtrate from mice fed a high fat diet stimulates the transformation of JB6 cells more than fat tissue filtrate from mice fed a low fat diet as measured by growth in soft agar
Following 7 days of treatment with fat tissue filtrate, JB6 cells were plated directly in soft agar for an anchorage independent colony formation assay. JB6 cells cultured with fat tissue filtrate formed more colonies in soft agar than cells cultured with 5% FBS, and JB6 cells treated with fat tissue filtrate of mice fed HFD demonstrated the highest capacity to form colonies in soft agar (Fig. 5A–B). Overall, fat tissue filtrate from mice fed the HFD stimulated colony formation in soft agar 160% more than fat pad filtrate from mice fed the LFD, and the colonies formed were larger (mostly greater than 32 cells; *P<0.05, Fig. 5A-B). To determine if transformation of JB6 cells by fat pad filtrate was a reversible or irreversible process, transformed cells (colonies growing in soft agar) that were previously treated with a fat tissue filtrate in liquid medium were isolated from soft agar and grown for 16 passages (approximately 8 weeks) in 5% FBS. After 16 passages in liquid medium, confluent cells were placed in soft agar for 14 days to determine colony formation and reversibility of the transformation. Stable transformation was observed since cells that grew in soft agar retained their ability to grow in soft agar after 16 passages with a similar cloning efficiency.
Figure 5. Fat tissue filtrate stimulates the transformation of JB6 cells.

A. JB6 cells were treated with 5% FBS or fat tissue filtrate (50 μg protein/mL) for 7 days, and then 104 cells were placed in soft agar for 14 days. The picture shows JB6 cells growing in soft agar that were cultured with fat tissue filtrate from mice fed either LFD or HFD (magnification = 400×). B. Cells were treated as described in (A). Fat tissue filtrate from mice fed a HFD stimulated colony formation in soft agar 160% more than fat pad filtrate from mice fed a LFD (*P<0.05). Data was obtained from 3 separate clones per treatment group. One dish = 20 cm2. All data are mean ± SEM, Student t test (unpaired, two-tailed). C. Mice were injected with 2 × 10⁶ JB6 cells subcutaneously in the right and left flank of a SCID mouse. Mice were injected with cells treated with fat tissue filtrate as described in Figure 2. Data shows picture of tumor formation in SCID mice 10 days after injection. D. Immunohistochemistry of tumor in SCID mice injected with JB6 cells treated with HFD fat tissue filtrate demonstrates a fibrosarcoma at 40× and 200×magnification.
To determine if transformed cells form tumors in mice, JB6 cells (2 x 10⁶) treated with LFD or HFD fat pad filtrate were isolated and expanded from soft agar then injected subcutaneously into the left and right hind flanks of SCID mice. Tumor formation was analyzed at 10 days post injection. Only the cells transformed by HFD fat tissue filtrates formed tumors in mice (Fig. 5C-D). Histopathology examination determined the formation of a type of fibroblastic sarcoma, which is a malignant mesenchymal tumor derived from fibrous connective tissue and characterized by the presence of immature proliferating fibroblasts or undifferentiated anaplastic spindle cells in a storiform pattern (Fig. 5D). This tumor demonstrates invasion into muscle (Fig. 5D).
Discussion
Diet-induced obesity is increasing globally (13). It has been estimated that 68% of American adults are overweight or obese, causing significant morbidity and mortality (14). Recent research suggests that obesity can influence cancer risk, survival and reoccurrence (15, 16). However, the molecular changes induced by obesity that actually enhance cancer development are poorly understood. Obese individuals generally consume more dietary fat, which has been linked to increased cancer risk (17). Importantly, obese individuals have high amounts of adipose tissue, a metabolically active organ that, in addition to storing calories, secretes large numbers of adipokines (18, 19). Obesity alters the metabolic and endocrine functions of adipose tissue and is associated with elevated plasma free fatty acids (20) as well as proinflammatory adipokines/cytokines that may play a role in tumor development (21, 22). Several investigators have evaluated the relationship between dietary fat intake and non-melanoma skin cancer in both mice and humans. In mouse models, dietary lipid intake was shown to influence the risk of UVB-induced carcinogenesis (5, 23). Adele Green and colleagues reported in two separate prospective studies an association between high fat diets and human non-melanoma skin cancer risk (2, 3). Prior to this work, in an intervention clinical trial conducted by Homer Black and colleagues, patients with previous skin cancers who reduced their consumption of fat by 40% had significantly fewer skin cancers (24). A recent prospective study indicated that obese individuals have a lower risk of developing non-melanoma skin cancers than individuals with normal body weight, but this may be due to the lack of sun exposure (25).
Our previous studies indicated that decreasing visceral adipose tissue by surgical removal of the parametrial fat pads inhibited UVB-induced carcinogenesis in SKH-1 mice fed a high fat diet (HFD), but not a low fat diet (LFD) indicating that the parametrial fat tissue from mice fed a HFD played a role in skin carcinogenesis. In our present study, we demonstrated that an aqueous filtrate made from parametrial fat pad homogenate (fat tissue filtrate) from mice fed a HFD stimulated the transformation of epidermal JB6 P+ (JB6) cells, suggesting a positive association between diet and skin cancer in an animal model. JB6 P+ cells are promotion competent (can be stimulated to grow in soft agar by phorbol ester tumor promoters such as TPA) as established by Nancy Colburn and her colleagues (10, 26) and confirmed in our laboratory (data not presented). Interestingly, the effects of fat tissue filtrate on cell transformation were greater in JB6 cells cultured with a fat tissue filtrate from mice fed a HFD compared with that from mice fed a LFD (Fig. 5). These data correlate with our previous study that demonstrated that lipectomy surgery will reduce skin tumor formation in mice fed a HFD and not in mice fed a LFD (7). Since the adipose tissue that regenerated in the lipectomized mice had fewer CLS and reduced adipokine expression (7), we hypothesized that macrophage infiltration into adipose tissue due to HFD-feeding would stimulate adipokine production, the formation of ROS and the transformation of keratinocytes.
Consistent with several recent reports (27–29), we demonstrated by F4/80 immunostaining that the parametrial fat tissue of mice fed a HFD had a higher density of CLS (Fig. 1B). F4/80 is a well-characterized membrane protein that is used as a marker for mature mouse macrophages. CLS are surrogate markers for dead adipocytes and indicate tissue macrophage infiltration, suggesting a role for CLS in the pathogenesis of obesity and, potentially, a role in the transforming capacity of HFD fat pad filtrate. Further implicating CLS in cancer prognosis, Dannenberg and colleagues demonstrated that the presence of CLS as a predictive biomarker for post-menopausal breast cancer risk (30).
We demonstrated that HFD feeding stimulated the expression of adipokines such as intracellular adhesion molecule-1 (ICAM-1) and monocyte chemoattractant protein-1 (MCP-1) (Fig. 2C). The induction of these proteins could potentially recruit macrophages into the parametrial adipose tissue. HFD feeding also stimulated the expression of IL-6, leptin and Serpin E1/ plasminogen activator inhibitor-1 (PAI-1) (Fig. 2C). Overall, these adipokines were either absent (MCP-1, IL-6, leptin, Serpin E1/PAI-1) or present in lower abundance (ICAM-1) in the parametrial fat tissue of mice fed a LFD (Fig. 2C). A prior report demonstrated that macrophages are responsible for at least 50% of the IL-6 production in adipose tissue (31) and IL-6 was shown to be a potent JB6 cell tumor promoter by stimulating growth in soft agar (26), suggesting that macrophages could play a role in the transforming capacity of HFD fat tissue filtrate. MCP-1, leptin, ICAM-1, and IL-6 have all been shown to inhibit apoptosis and stimulate proliferation in a wide range of cell types (32–34) and levels are elevated in obesity and in some cancers (35–38). Serpin E1 has been shown to influence cell migration by interacting with vitronectin (39), cell surface receptors and regulating extracellular matrix proteolysis (40) and stimulate proliferation and survival by initiating several pathways such as MYC, AKT, and NF-κB (41). Interestingly, our previously published study demonstrated that feeding mice a HFD for 2 weeks, increased the level of Serpin E1, in the serum and the epidermis, and this increase was inhibited by the removal of the parametrial fat tissue, suggesting that this adipokine may be important for obesity-promoted skin cancer (7). Future studies will utilize neutralizing antibodies, inhibitors, siRNA and receptor antagonists to determine the role of each of these adipokines in JB6 cell transformation by HFD fat tissue fitrate.
Macrophage infiltration into parametrial adipose tissue could also stimulate the production of ROS. Fat tissue filtrate from mice fed a HFD had a greater capacity to stimulate the formation of ROS per mg protein when compared to that from mice fed a LFD (Fig. 2D). Several studies have implicated the balance between ROS and antioxidants in different stages of skin carcinogenesis. Colburn and colleagues have demonstrated that ROS, specifically superoxide production, is a key molecular mechanism of TPA-induced transformation of JB6 cells (12). ROS can stimulate pathways that promote sustained cell proliferation, inhibit cell apoptosis and promote tumor progression and have also been shown to trigger the formation of downstream molecules involved in the process of EMT (reviewed in Wang et al. (42)). Interestingly, we demonstrated that fat tissue filtrate from mice fed a HFD can stimulate changes in cell morphology (Fig. 4) characteristic of an epithelial-mesenchymal transition (EMT), a developmental process characterized by the loss of epithelial markers and gain of mesenchymal markers that increase the ability of cells to migrate or invade (43–46). Treatment of JB6 cells with fat tissue filtrate from mice fed a HFD stimulated the loss of E-cadherin, a hallmark of EMT, and increased the level of Twist, a key E-cadherin transcriptional repressor (44) (Fig. 4B). Cells were seeded and adhered with an epithelial phenotype, but after several cell divisions converted to more fibroblast-like cells. These results suggested that the morphological changes observed required proliferation. Although 5% FBS stimulated cell proliferation to the same extent as fat tissue filtrate from mice fed a HFD (Fig. 3), there was no appreciable effect on cell transformation, indicating that although proliferation may be required for transformation, it is not sufficient. Which specific reactive oxygen and nitrogen species are produced in JB6 cells and the role of ROS and antioxidants in fat tissue filtrate-induced proliferation and transformation is unknown, but will be the subject of future studies.
It was of considerable interest that JB6 cells that had a fibroblast-like morphology after culturing with fat tissue filtrate from mice fed a HFD proliferated in soft agar and formed tumors when injected into SCID mice (Fig. 5). It was previously established that JB6 cells with a more fibroblastic-like phenotype form greater numbers of and larger colonies in soft agar compared with JB6 cells with a round epithelial shape (46). These observations indicate that cells with a fibroblast-like morphology (after only 7 days of exposure to a fat tissue filtrate) are transformed as indicated by their growth in soft agar. Colonies isolated from soft agar retained their fibroblast-like morphology when grown for 16 passages in liquid medium and demonstrated the same colony forming efficiency. Continual observation of the fat tissue filtrate-transformed fibroblast-like cells and periodic testing of their ability to grow in soft agar demonstrated an irreversibility of transformation. These data are in contrast to a previous study with JB6 cells that demonstrated that TPA-induced morphological changes in JB6 cells were reversible (46). However, in these studies the experimental conditions were different and a subpopulation of cells still demonstrated anchorage independence, suggesting partial stability of a transformed phenotype (46).
The model described in the present manuscript provides a foundation for future studies on molecular mechanisms by which parametrial fat tissue promotes skin cell transformation. Further research is needed to determine whether adipocytes and/or inflammatory cells such as macrophages are the most critical contributors of adipokines and/or ROS that may be involved in the transforming capacity of the fat tissue filtrate from mice fed a HFD. It will also be of considerable interest to determine whether human fat tissue stimulates the transformation of JB6 cells or other immortalized cells such as those from the prostate, breast, colon, uterus, and kidney–tissues that are prone to obesity-enhanced carcinogenesis (15). Fat tissue filtrate-induced transformation of JB6 or other immortalized epithelial cells provides a useful in vitro model for studying molecular mechanisms of fat-induced tumor promotion as well as for evaluating the effects of potential chemopreventive agents.
In summary, parametrial fat tissue from animals fed a HFD had a higher density of macrophage-fused dead adipocytes (crown-like structures), more adipokines, and stimulated the production of more reactive oxygen species compared with parametrial fat tissue from mice fed a LFD. These differences between parametrial fat tissue from mice fed a HFD and LFD were associated with their effect on the in vitro transformation. Fat tissue filtrate made from the parametrial fat tissue of mice fed a HFD had 160% more transforming activity than that from mice fed a LFD and formed malignant mesenchymal tumors in vivo. These studies provide the first in vitro demonstration of a parametrial fat tissue-induced transformation of an epidermal cell.
Acknowledgments
Grant support
R01CA128997, from the National Cancer Institute, Training Grant ES007148, Center Grant ES005022 from the National Institute of Environmental Health Sciences (NIEHS), and funding from the Department of Chemical Biology.
Abbreviations
- LFD
low fat diet
- HFD
high fat diet
- MEM
minimum essential medium
- FBS
fetal bovine serum
Footnotes
Author contributions
Y.-P.L., J.J.B. and A.H.C. designed research; J.J.B., Y.-P.L., Y.-R.L., Q.-Y.P., T.L., P.R.V., N.D. performed research; Y-.P.L., J.J.B. and A.H.C. analyzed data; Y.-P.L. J.J.B. and A.H.C. wrote the paper and Z.D. and J.D.L. helped design experiments and reviewed the manuscript.
References
- 1.Siegel R, Ward E, Brawley O, Jemal A. Cancer statistics, 2011: the impact of eliminating socioeconomic and racial disparities on premature cancer deaths. CA Cancer J Clin. 2011;61:212–36. doi: 10.3322/caac.20121. [DOI] [PubMed] [Google Scholar]
- 2.Ibiebele TI, van der Pols JC, Hughes MC, Marks GC, Green AC. Dietary fat intake and risk of skin cancer: a prospective study in Australian adults. Int J Cancer. 2009;125:1678–84. doi: 10.1002/ijc.24481. [DOI] [PubMed] [Google Scholar]
- 3.Ibiebele TI, van der Pols JC, Hughes MC, Marks GC, Williams GM, Green AC. Dietary pattern in association with squamous cell carcinoma of the skin: a prospective study. Am J Clin Nutr. 2007;85:1401–8. doi: 10.1093/ajcn/85.5.1401. [DOI] [PubMed] [Google Scholar]
- 4.Black HS. Influence of dietary factors on actinically-induced skin cancer. Mutat Res. 1998;422:185–90. doi: 10.1016/s0027-5107(98)00191-2. [DOI] [PubMed] [Google Scholar]
- 5.Black HS, Lenger W, Phelps AW, Thornby JI. Influence of dietary lipid upon ultraviolet-light carcinogenesis. Nutr Cancer. 1983;5:59–68. doi: 10.1080/01635588309513780. [DOI] [PubMed] [Google Scholar]
- 6.Lu YP, Lou YR, Lin Y, Shih WJ, Huang MT, Yang CS, Conney AH. Inhibitory effects of orally administered green tea, black tea, and caffeine on skin carcinogenesis in mice previously treated with ultraviolet B light (high-risk mice): relationship to decreased tissue fat. Cancer Res. 2001;61:5002–9. [PubMed] [Google Scholar]
- 7.Lu YP, Lou YR, Bernard JJ, Peng QY, Li T, Lin Y, Shih WJ, Nghiem P, Shapses S, Wagner GC, Conney AH. Surgical removal of the parametrial fat pads stimulates apoptosis and inhibits UVB-induced carcinogenesis in mice fed a high-fat diet. Proc Natl Acad Sci U S A. 2012;109:9065–70. doi: 10.1073/pnas.1205810109. [DOI] [PMC free article] [PubMed] [Google Scholar]
- 8.Lu YP, Nolan B, Lou YR, Peng QY, Wagner GC, Conney AH. Voluntary exercise together with oral caffeine markedly stimulates UVB light-induced apoptosis and decreases tissue fat in SKH-1 mice. Proc Natl Acad Sci U S A. 2007;104:12936–41. doi: 10.1073/pnas.0705839104. [DOI] [PMC free article] [PubMed] [Google Scholar]
- 9.Lu YP, Lou YR, Nolan B, Peng QY, Xie JG, Wagner GC, Conney AH. Stimulatory effect of voluntary exercise or fat removal (partial lipectomy) on apoptosis in the skin of UVB light-irradiated mice. Proc Natl Acad Sci U S A. 2006;103:16301–6. doi: 10.1073/pnas.0607789103. [DOI] [PMC free article] [PubMed] [Google Scholar]
- 10.Colburn NH, Former BF, Nelson KA, Yuspa SH. Tumour promoter induces anchorage independence irreversibly. Nature. 1979;281:589–91. doi: 10.1038/281589a0. [DOI] [PubMed] [Google Scholar]
- 11.Warden CH, Fisler JS. Comparisons of diets used in animal models of high-fat feeding. Cell Metab. 2008;7:277. doi: 10.1016/j.cmet.2008.03.014. [DOI] [PMC free article] [PubMed] [Google Scholar]
- 12.Nakamura Y, Colburn NH, Gindhart TD. Role of reactive oxygen in tumor promotion: implication of superoxide anion in promotion of neoplastic transformation in JB-6 cells by TPA. Carcinogenesis. 1985;6:229–35. doi: 10.1093/carcin/6.2.229. [DOI] [PubMed] [Google Scholar]
- 13.Finkelstein EA, Khavjou OA, Thompson H, Trogdon JG, Pan L, Sherry B, Dietz W. Obesity and severe obesity forecasts through 2030. Am J Prev Med. 2012;42:563–70. doi: 10.1016/j.amepre.2011.10.026. [DOI] [PubMed] [Google Scholar]
- 14.Wang YC, McPherson K, Marsh T, Gortmaker SL, Brown M. Health and economic burden of the projected obesity trends in the USA and the UK. Lancet. 2011;378:815–25. doi: 10.1016/S0140-6736(11)60814-3. [DOI] [PubMed] [Google Scholar]
- 15.Calle EE, Rodriguez C, Walker-Thurmond K, Thun MJ. Overweight, obesity, and mortality from cancer in a prospectively studied cohort of U.S. adults. N Engl J Med. 2003;348:1625–38. doi: 10.1056/NEJMoa021423. [DOI] [PubMed] [Google Scholar]
- 16.Polednak AP. Estimating the number of U.S. incident cancers attributable to obesity and the impact on temporal trends in incidence rates for obesity-related cancers. Cancer Detect Prev. 2008;32:190–9. doi: 10.1016/j.cdp.2008.08.004. [DOI] [PubMed] [Google Scholar]
- 17.La Vecchia C. Cancers associated with high-fat diets. J Natl Cancer Inst Monogr. 1992:79–85. [PubMed] [Google Scholar]
- 18.Ouchi N, Kihara S, Funahashi T, Matsuzawa Y, Walsh K. Obesity, adiponectin and vascular inflammatory disease. Curr Opin Lipidol. 2003;14:561–6. doi: 10.1097/00041433-200312000-00003. [DOI] [PubMed] [Google Scholar]
- 19.Berg KK, Madsen HO, Garred P, Wiseth R, Gunnes S, Videm V. The additive contribution from inflammatory genetic markers on the severity of cardiovascular disease. Scand J Immunol. 2009;69:36–42. doi: 10.1111/j.1365-3083.2008.02187.x. [DOI] [PubMed] [Google Scholar]
- 20.Kelley DE, Williams KV, Price JC, McKolanis TM, Goodpaster BH, Thaete FL. Plasma fatty acids, adiposity, and variance of skeletal muscle insulin resistance in type 2 diabetes mellitus. Journal of Clinical Endocrinology and Metabolism. 2001;86:5412–9. doi: 10.1210/jcem.86.11.8027. [DOI] [PubMed] [Google Scholar]
- 21.Baillargeon J, Platz EA, Rose DP, Pollock BH, Ankerst DP, Haffner S, Higgins B, Lokshin A, Troyer D, Hernandez J, Lynch S, Leach RJ, Thompson IM. Obesity, adipokines, and prostate cancer in a prospective population-based study. Cancer Epidemiol Biomarkers Prev. 2006;15:1331–5. doi: 10.1158/1055-9965.EPI-06-0082. [DOI] [PubMed] [Google Scholar]
- 22.Ogunwobi O, Mutungi G, Beales IL. Leptin stimulates proliferation and inhibits apoptosis in Barrett’s esophageal adenocarcinoma cells by cyclooxygenase-2-dependent, prostaglandin-E2-mediated transactivation of the epidermal growth factor receptor and c-Jun NH2-terminal kinase activation. Endocrinology. 2006;147:4505–16. doi: 10.1210/en.2006-0224. [DOI] [PubMed] [Google Scholar]
- 23.Black HS. Photocarcinogenesis and diet. Fed Proc. 1987;46:1901–5. [PubMed] [Google Scholar]
- 24.Jaax S, Scott LW, Wolf JE, Jr, Thornby JI, Black HS. General guidelines for a low-fat diet effective in the management and prevention of nonmelanoma skin cancer. Nutr Cancer. 1997;27:150–6. doi: 10.1080/01635589709514517. [DOI] [PubMed] [Google Scholar]
- 25.Pothiawala S, Qureshi AA, Li Y, Han J. Obesity and the incidence of skin cancer in US Caucasians. Cancer Causes Control. 2012;23:717–26. doi: 10.1007/s10552-012-9941-x. [DOI] [PMC free article] [PubMed] [Google Scholar]
- 26.Yu CY, Wang L, Khaletskiy A, Farrar WL, Larner A, Colburn NH, Li JJ. STAT3 activation is required for interleukin-6 induced transformation in tumor-promotion sensitive mouse skin epithelial cells. Oncogene. 2002;21:3949–60. doi: 10.1038/sj.onc.1205499. [DOI] [PubMed] [Google Scholar]
- 27.Cinti S, Mitchell G, Barbatelli G, Murano I, Ceresi E, Faloia E, Wang S, Fortier M, Greenberg AS, Obin MS. Adipocyte death defines macrophage localization and function in adipose tissue of obese mice and humans. J Lipid Res. 2005;46:2347–55. doi: 10.1194/jlr.M500294-JLR200. [DOI] [PubMed] [Google Scholar]
- 28.Murano I, Barbatelli G, Parisani V, Latini C, Muzzonigro G, Castellucci M, Cinti S. Dead adipocytes, detected as crown-like structures, are prevalent in visceral fat depots of genetically obese mice. J Lipid Res. 2008;49:1562–8. doi: 10.1194/jlr.M800019-JLR200. [DOI] [PubMed] [Google Scholar]
- 29.Strissel KJ, Stancheva Z, Miyoshi H, Perfield JW, 2nd, DeFuria J, Jick Z, Greenberg AS, Obin MS. Adipocyte death, adipose tissue remodeling, and obesity complications. Diabetes. 2007;56:2910–8. doi: 10.2337/db07-0767. [DOI] [PubMed] [Google Scholar]
- 30.Subbaramaiah K, Howe LR, Bhardwaj P, Du B, Gravaghi C, Yantiss RK, Zhou XK, Blaho VA, Hla T, Yang P, Kopelovich L, Hudis CA, Dannenberg AJ. Obesity is associated with inflammation and elevated aromatase expression in the mouse mammary gland. Cancer Prev Res (Phila) 2011;4:329–46. doi: 10.1158/1940-6207.CAPR-10-0381. [DOI] [PMC free article] [PubMed] [Google Scholar] [Retracted]
- 31.Weisberg SP, McCann D, Desai M, Rosenbaum M, Leibel RL, Ferrante AW., Jr Obesity is associated with macrophage accumulation in adipose tissue. J Clin Invest. 2003;112:1796–808. doi: 10.1172/JCI19246. [DOI] [PMC free article] [PubMed] [Google Scholar]
- 32.Shi CL, Yu CH, Zhang Y, Zhao D, Chang XH, Wang WH. Monocyte chemoattractant protein-1 modulates invasion and apoptosis of PC-3M prostate cancer cells via regulating expression of VEGF, MMP9 and caspase-3. Asian Pac J Cancer Prev. 2011;12:555–9. [PubMed] [Google Scholar]
- 33.Heinrich PC, Behrmann I, Haan S, Hermanns HM, Muller-Newen G, Schaper F. Principles of interleukin (IL)-6-type cytokine signalling and its regulation. Biochem J. 2003;374:1–20. doi: 10.1042/BJ20030407. [DOI] [PMC free article] [PubMed] [Google Scholar]
- 34.Vyth-Dreese FA, Dellemijn TA, Frijhoff A, van Kooyk Y, Figdor CG. Role of LFA-1/ICAM-1 in interleukin-2-stimulated lymphocyte proliferation. Eur J Immunol. 1993;23:3292–9. doi: 10.1002/eji.1830231235. [DOI] [PubMed] [Google Scholar]
- 35.Sartipy P, Loskutoff DJ. Monocyte chemoattractant protein 1 in obesity and insulin resistance. Proc Natl Acad Sci U S A. 2003;100:7265–70. doi: 10.1073/pnas.1133870100. [DOI] [PMC free article] [PubMed] [Google Scholar]
- 36.Park HS, Park JY, Yu R. Relationship of obesity and visceral adiposity with serum concentrations of CRP, TNF-alpha and IL-6. Diabetes Res Clin Pract. 2005;69:29–35. doi: 10.1016/j.diabres.2004.11.007. [DOI] [PubMed] [Google Scholar]
- 37.Ramos EJ, Xu Y, Romanova I, Middleton F, Chen C, Quinn R, Inui A, Das U, Meguid MM. Is obesity an inflammatory disease? Surgery. 2003;134:329–35. doi: 10.1067/msy.2003.267. [DOI] [PubMed] [Google Scholar]
- 38.Cozen W, Gebregziabher M, Conti DV, Van Den Berg DJ, Coetzee GA, Wang SS, Rothman N, Bernstein L, Hartge P, Morhbacher A, Coetzee SG, Salam MT, Wang W, Zadnick J, Ingles SA. Interleukin-6-related genotypes, body mass index, and risk of multiple myeloma and plasmacytoma. Cancer Epidemiol Biomarkers Prev. 2006;15:2285–91. doi: 10.1158/1055-9965.EPI-06-0446. [DOI] [PubMed] [Google Scholar]
- 39.Hurt EM, Chan K, Serrat MA, Thomas SB, Veenstra TD, Farrar WL. Identification of vitronectin as an extrinsic inducer of cancer stem cell differentiation and tumor formation. Stem Cells. 2010;28:390–8. doi: 10.1002/stem.271. [DOI] [PMC free article] [PubMed] [Google Scholar]
- 40.Wilkins-Port CE, Ye Q, Mazurkiewicz JE, Higgins PJ. TGF-beta1 + EGF-initiated invasive potential in transformed human keratinocytes is coupled to a plasmin/MMP-10/MMP-1-dependent collagen remodeling axis: role for PAI-1. Cancer Res. 2009;69:4081–91. doi: 10.1158/0008-5472.CAN-09-0043. [DOI] [PMC free article] [PubMed] [Google Scholar]
- 41.Czekay RP, Wilkins-Port CE, Higgins SP, Freytag J, Overstreet JM, Klein RM, Higgins CE, Samarakoon R, Higgins PJ. PAI-1: An Integrator of Cell Signaling and Migration. Int J Cell Biol. 2011;2011:562481. doi: 10.1155/2011/562481. [DOI] [PMC free article] [PubMed] [Google Scholar]
- 42.Wang Z, Li Y, Sarkar FH. Signaling mechanism(s) of reactive oxygen species in Epithelial-Mesenchymal Transition reminiscent of cancer stem cells in tumor progression. Curr Stem Cell Res Ther. 2010;5:74–80. doi: 10.2174/157488810790442813. [DOI] [PMC free article] [PubMed] [Google Scholar]
- 43.Chaffer CL, Thompson EW, Williams ED. Mesenchymal to epithelial transition in development and disease. Cells Tissues Organs. 2007;185:7–19. doi: 10.1159/000101298. [DOI] [PubMed] [Google Scholar]
- 44.Lee JM, Dedhar S, Kalluri R, Thompson EW. The epithelial-mesenchymal transition: new insights in signaling, development, and disease. J Cell Biol. 2006;172:973–81. doi: 10.1083/jcb.200601018. [DOI] [PMC free article] [PubMed] [Google Scholar]
- 45.Thiery JP, Sleeman JP. Complex networks orchestrate epithelial-mesenchymal transitions. Nat Rev Mol Cell Biol. 2006;7:131–42. doi: 10.1038/nrm1835. [DOI] [PubMed] [Google Scholar]
- 46.Takahashi K, Heine UI, Junker JL, Colburn NH, Rice JM. Role of cytoskeleton changes and expression of the H-ras oncogene during promotion of neoplastic transformation in mouse epidermal JB6 cells. Cancer Res. 1986;46:5923–32. [PubMed] [Google Scholar]