

Abstract
Background:
Glioblastoma (GB) treatment remains challenging because of recurrence and poorly defined treatment options after first-line therapy. To better understand real-world application of treatment paradigms and their impact on outcomes, we describe patterns of treatment, outcomes, and use of cancer-related healthcare resource for glioblastoma in the USA.
Methods:
A retrospective, online chart-abstraction study was conducted; each participating oncologist contributed ≤5 charts. Patients were ≥18 years with biopsy-confirmed primary or secondary newly diagnosed GB on or after 1 January 2010, had received first- and second-line therapies, and had information collected for ≥3 months after initiation of second-line therapy or until death. Assessments were descriptive and included Kaplan– Meier analyses from initiation to end of second-line therapy, disease progression, or death.
Results:
One hundred sixty physicians contributed information on 503 patient charts. During first-line therapy, patients most commonly underwent temozolomide monotherapy (76.5%). During second-line therapy, patients most commonly underwent bevacizumab monotherapy (58.1%). Median duration of second-line therapy was 130 days; median time to disease progression was 113 days. Median survival was 153 days. Use of supportive care was observed to be numerically higher in first- compared with second-line therapy except for anti-depressants, growth factors, and stimulants. Frequently used resources included corticosteroids (78.8% of patients in first-line and 62.6% in second-line therapies), anti-epileptics (45.8% and 41.5%) and narcotic opioids (45.3% and 41.4%).
Conclusions:
Most GB patients received temozolomide during first-line therapy and bevacizumab monotherapy or combination therapy during second-line therapy. Use of supportive care appeared to be higher in first- compared with second-line therapy for some agents.
Keywords: treatment patterns, observational, bevacizumab, glioblastoma, first-line therapy, second-line therapy, cancer, temozolomide
Introduction
Glioblastoma (GB) is the most common and aggressive primary malignant tumor of the brain in adults in the USA. More than 10,000 new cases of GB are diagnosed each year, and ≈50,000 patients have GB [1,2]. From 1995 to 2007, overall survival in the USA was ≈35% for 1 year and <5% for 5 years [2,3]. Treatment of GB imposes an economic burden; patients with malignant brain tumors have been shown to accrue healthcare costs that are 20-fold greater than those of people without cancer [4].
Standard of care for newly diagnosed patients is resection followed by a combination of radiation and temozolomide therapy [5,6]. Aggressive therapy in newly diagnosed patients has improved median overall survival [5,7–11], but recurrence is common in almost all patients and the prognosis remains poor [7,11]. After first-line therapy of recurrent disease, standard of care is not well defined and is often patient-dependent, and options are limited [12–14]. Advances in care have resulted in only incremental improvements in overall survival [9,10]. Hence, efforts are needed to define effective strategies to treat GB, particularly during recurrence.
In this retrospective study, we explore real-world treatment patterns and outcomes for GB to better understand GB treatment paradigms in the USA. In patients with newly diagnosed GB who had received first- and second-line therapies, we wanted to describe demographics and clinical characteristics at the diagnosis, treatment patterns (including specific agents used in lines of therapy, duration of therapy, and disease progression by line of therapy), incremental improvement in survival since initiation of second-line therapy, prognostic markers and symptoms, and GB-related use of healthcare resources. Better understanding of these patient characteristics and treatment outcomes may help clarify the potential contributions of new treatments for GB.
Methods
Study design
This was a retrospective, observational study in which oncologists contributed de-identified information from patient charts in clinical practice through an online data-collection form during December 2012. The study collected information on physicians and patients. Physicians were selected randomly from a panel of practicing oncologists and invited to participate. Each physician had at least one GB-diagnosed adult patient who had received second-line systemic therapy.
To ensure that patients were selected randomly, oncologists were provided with a randomized letter of the alphabet. Oncologists were asked to pull the chart for the first patient with a surname beginning with the designated letter. If none of the patients whose surname began with the designated letter met the criteria for the study, oncologists continued to the next letter of the alphabet. Physicians could contribute up to five patient charts; collection of 500 charts was intended.
Patients were ≥18 years of age with a diagnosis of primary or secondary GB confirmed by biopsy on or after 1 January 2010 and no later than 31 December 2012. Collection of patient data was restricted to those who received first-line therapy and second-line systemic therapy and who had information collected for ≥3 months after initiation of second-line systemic therapy or until death. Adjuvant therapy using temozolomide after radiation therapy in combination with temozolomide was considered to be part of first-line therapy. Patients with malignant primary tumors other than glioma or astrocytoma were excluded.
Statistical analyses
For the characteristics of physicians and patients, frequencies and percentages were reported for categorical variables. Mean, standard deviation (SD), and median values were reported for continuous variables. Median time from initiation of second-line therapy to discontinuation because of disease progression or death (accounting for censoring) was estimated by Kaplan– Meier analyses. Time from end of first-line to initiation of second-line therapy was described by univariate analyses (mean, median, SD).
Results
Physician characteristics
160 physicians with a mean (SD) of 20.2 (32.6) patients with GB per physician contributed to a study sample of 503 patient charts (mean [SD] 3.1 [1.8] patient charts per physician). Overall prevalence of physician access/participation was 19%. Physicians had a mean (SD) of 13.8 (6.7) years of practice. 113 (70.6%) physicians specialized in general oncology and 47 (29.4%) in neuro-oncology. Practices were located in the northeastern (33.1%; n=53), southern (29.4%; n=47), western (20.0%; n=32), and midwestern (17.5%; n=28) regions of the USA. 75 (46.9%) physicians were affiliated with teaching hospitals, and 34 (21.3%) were affiliated with comprehensive cancer centers designated by the National Cancer Institute (NCI). Practice settings were: office-based separate from hospitals or foundations (52.5%; 84 physicians), office-based owned by hospitals or foundations (26.3%; n=42), hospitals (12.5%; n=20), community settings (8.8%; n=14).
Patient characteristics
Overall mean patient age at the diagnosis of GB was 58.4 years (Table 1). Most patients were male (68.6%) and Caucasian (74.0%). The mean Charlson Comorbidity Index [15,16] at the diagnosis (which excluded malignancies) was 0.65. Hypertension was present in 32.4% of patients, depression in 13.1%, anxiety in 11.5%, and diabetes mellitus without chronic complications in 9.3%. Almost all tumors (97.8%) were primary GB; 40.2% were parietal, and 29.2% were frontal.
Table 1.
Patient characteristics.
| Characteristic | All patients (N=503) |
|---|---|
| Demographic information | |
| Age (years) at GB diagnosis, mean (SD) | 58.4 (11.8) |
| Male, n (%) | 345 (68.6) |
|
| |
| Race and ethnicity, n (%) | |
| White | 372 (74.0) |
| Black or African–American | 83 (16.5) |
| Asian | 22 (4.4) |
| Hispanic or Latino | 12 (2.4) |
| Othera | 14 (2.8) |
|
| |
| Marital status, n (%) | |
| Married | 360 (71.6) |
| Single | 109 (21.7) |
| Not known | 34 (6.8) |
|
| |
| GB type, n (%) | |
| Primary | 492 (97.8) |
| Secondary | 11 (2.2) |
|
| |
| Primary site of GB tumor, n (%) | |
| Frontal | 147 (29.2) |
| Parietal | 202 (40.2) |
| Occipital | 53 (10.5) |
| Temporal | 78 (15.5) |
| Unknown and other | 23 (4.6) |
|
| |
| Charlson Comorbidity Indexb before and at the diagnosis, mean (SD) | 0.65 (1.2) |
|
| |
| Comorbidities, n (%)c | |
| Hypertension | 163 (32.4) |
| Depression | 66 (13.1) |
| Anxiety | 58 (11.5) |
| Diabetes mellitus without chronic complications | 47 (9.3) |
| Chronic pulmonary disease | 38 (7.6) |
| Peptic ulcer disease | 35 (7.0) |
| Obesity | 32 (6.4) |
| Myocardial infarction | 31 (6.2) |
|
| |
| Employment status at the diagnosis, n (%) | |
| Full-time | 183 (36.4) |
| Part-time | 83 (16.5) |
| Not employed | 205 (40.8) |
| Unknown | 32 (6.4) |
|
| |
| Health insurance plan at the diagnosis, n (%) | |
| Private health insurance | 263 (52.3) |
| Medicare | 170 (33.8) |
| Medicaid | 57 (11.3) |
| Uninsured/other | 13 (2.6) |
|
| |
| Patient has a primary caregiver, n (%) | |
| Primary caregiver present | 361 (71.8) |
| No primary caregiver | 100 (19.9) |
| Unknown | 42 (8.3) |
|
| |
| Relationship to primary caregiver, n (%) | |
| Spouse | 270 (53.7) |
| Child | 40 (8.0) |
| Extended family relative | 34 (6.8) |
| Not a family member/unknown | 17 (3.4) |
American Indian or Alaska Native, Native Hawaiian or other Pacific Islander, and other.
Metastatic solid tumors were not included. Comorbidities were included if they were recorded by the physician as occurring at any time before the diagnosis of GB.
Comorbidities with >5% occurrence are listed. BMI, body mass index; GB, glioblastoma.
Prognostic biomarkers
Fewer than 25% of patients were assessed for each prognostic biomarker. The O6 methylguanine–DNA–methyltransferase promoter was assessed in 22.5% of all patients, of whom 47.8% (n=54) tested positive. The epidermal growth factor receptor (EGFR) or EGFR variant III was assessed in 16.3%, of whom 42.7% (n=35) tested positive, and the isocitrate dehydrogenase 1 mutation was assessed in 9.7%, of whom 36.7% (n=18) tested positive.
Systemic therapy for GB
There was a mean (SD) of 434 (230) days of post-diagnosis follow-up. After the diagnosis, 94.8% of patients received radiation therapy at any time. Primary surgery after the diagnosis included biopsy (28.2%) and resection (68%); 87.1% of resections (n=298) excluded carmustine implants. Subsequent surgeries were conducted in 4.4% of patients (n=22), and a maximum of three surgical procedures after primary surgery occurred after the diagnosis of GB.
By design, all patients received first- and second-line therapies, and of those who received active second-line therapy, only 12 (2.4%) received third-line therapy. During first- and second-line therapies, chemotherapeutic agents were used as monotherapy or in combination (Table 2). The most common agents used for first-line treatment were temozolomide (p.o.; 83.9% of patients overall), bevacizumab (15.3%), and temozolomide (i.v.; 8.9%), and the most common second-line agents were bevacizumab (79.5%), irinotecan (22.5%), and temozolomide (p.o.; 5.8%).
Table 2.
Sequence of first- and second-line regimens.
| First-line regimen (N=503), n (%) | Temozolomidea,b | Temozolomidea + bevacizumab | Temozolomidea + bevacizumab + otherc | Temozolomidea + otherd | Other monotherapy or combinations |
|
| |||||
| 385 (76.5) | 50 (9.9) | 13 (2.6) | 12 (2.4) | 43 (8.5) | |
|
| |||||
| Second-line regimene | |||||
| Bevacizumab | 246 (63.9) | 30 (60.0) | 4 (30.8) | 1 (8.3) | 11 (25.6) |
| Bevacizumab + irinotecan | 70 (18.2) | 4 (8.0) | 3 (23.1) | 3 (25.0) | 2 (4.7) |
| Bevacizumab + temozolomidea | 10 (2.6) | 1 (2.0) | 0 (0) | 1 (8.3) | 0(0) |
| Bevacizumab + otherf | 5 (1.3) | 3 (6.0) | 3 (23.1) | 0 (0) | 3 (7.0) |
| Irinotecan | 20 (5.2) | 3 (6.0) | 0 (0) | 3 (25.0) | 3 (7.0) |
| Temozolomidea | 20 (5.2) | 1 (2.0) | 1 (7.7) | 0 (0) | 11 (25.6) |
| Other monotherapy or combinations | 14 (3.6) | 8 (16.0) | 2 (15.4) | 4 (33.3) | 13 (30.2) |
Includes p.o. and i.v.
Example: overall, 76.5% of patients were treated with temozolomide during first-line therapy. Of those, 63.9% were treated with only bevacizumab during second-line therapy, and 18.2% had bevacizumab–irinotecan combination therapy.
Other agent(s) combined with temozolomide include carboplatin, chloroquine, cyclophosphamide, cisplatin, irinotecan, lomustine, methotrexate, thalidomide, and polifeprosan 20 with carmustine implant.
Other agent(s) combined with temozolomide + bevacizumab include carboplatin, carmustine, investigational treatment PLX3396, lomustine, irinotecan, and thalidomide.
As a proportion of first-line therapy.
Other agent(s) combined with bevacizumab include carboplatin, carmustine, cisplatin, erlotinib, etoposide, lomustine, investigational treatment PLX3396, and combination irinotecan + temozolomide.
First-line systemic therapy
During first-line systemic therapy, patients most commonly received temozolomide (p.o. or i.v.) as monotherapy (76.5%) or in combination with bevacizumab (9.9%) (Table 2). Chemotherapy was administered concomitant and adjuvant to radiation therapy in 53.5% of patients. Radiographic evidence (43.1%) was used to assess the response to first-line therapy more frequently than clinical assessment (12.9%), though radiographic and clinical assessments were reported for 43.9% of patients. Radiographic response in first-line patients was most often assessed using McDonald criteria (77.8%). Partial response was the most common best response to first-line therapy in 40.8% of patients (Table 3). Disease progression was the most frequently reported reason for ending first-line therapy (57.3% of patients who ended first-line therapy).
Table 3.
Duration of survival, response to therapy, and treatment characteristics in first- and second-line therapies.
| Overall treatment patterns and characteristics | First-line therapy patients (N=503) | Second-line therapy patientsa (N=503) |
|---|---|---|
| Duration and survivalb | ||
| Median duration of therapy, days (n=487c) | — | 130 |
| Median time to progression, days (n=304d,e) | — | 113 |
| Median duration of survival, days (n = 487c) | — | 153 |
|
| ||
| Time from first-line to second-line therapy (days), mean (SD) medianf | 77 (132) 24 | |
|
| ||
| Best response to therapy, n (%) | ||
| Complete response | 84 (16.7) | 13 (2.6) |
| Partial response | 205 (40.8) | 95 (18.9) |
| Stable response | 104 (20.7) | 193 (38.4) |
| Progression | 94 (18.7) | 155 (30.8) |
| Unknown | 16 (3.2) | 47 (9.3) |
|
| ||
| Performance status (ECOG), mean (SD)g | 1.15 (0.7) | 1.60 (0.7) |
|
| ||
| Enrolled in clinical trial, n (%) | 6 (1.2) | 11 (2.2) |
|
| ||
| Maximum number of treatment cycles, mean (SD)h | 5.9 (3.3) | 5.6 (3.8) |
|
| ||
| Reasons for ending therapy among patients who discontinued use of at least one agent, n (%)i | ||
| Disease progression | 288 (57.3) | 86 (28.6) |
| End conformed to treatment protocol | 176 (35.0) | 11 (3.7) |
| Patient refusal to continue treatment protocol | 41 (8.2) | 12 (4.0) |
| Adverse event/toxicity | 29 (5.8) | 9 (3.0) |
| Lack of benefit | 23 (4.6) | 7 (2.3) |
| Cost | 8 (1.6) | 1 (0.3) |
| Other, unknown, and missing | 24 (4.8) | 190 (63.1) |
Collection of patient data was restricted to those patients who received first- and second-line therapies.
Measured from start of second-line therapy.
Sixteen patients with invalid death dates were excluded.
Additional patients who ended a therapy for unknown reasons were excluded; four patients’ time to progression was censored by death.
Kaplan–Meier analyses were conducted for patients who had ongoing second-line therapy or who ended second-line therapy and gave at least one reason for ending therapy and had a valid death date.
Average number of days from end date of last agent in first-line therapy to start date of first agent administered in second-line therapy.
Karnofsky scores were converted to ECOG scores (ECOG 0 = KS 90–100; ECOG 1 = KS 70–80; ECOG 2 = KS 50–60; ECOG 3 = KS 30–40; ECOG 4 = KS 10–20). Twenty-six patients during first-line therapy and 31 patients during second-line therapy had unknown performance status.
Greatest number of cycles reported for any first- or second-line agent.
If ever reported for any first- or second-line agent. Multiple reasons for ending therapy could have been recorded. Patients with ongoing second-line therapy were excluded.
ECOG, Eastern Cooperative Oncology Group; GB, glioblastoma; KS, Karnofsky score.
Second-line systemic therapy
During second-line therapy, patients most commonly received bevacizumab as monotherapy (58.1%), bevacizumab–irinotecan combination therapy (16.3%), or irinotecan monotherapy (5.8%). Of those physicians who prescribed bevacizumab during second-line treatment, 47.5% were affiliated with a teaching hospital, and 21% were affiliated with an NCI-designated comprehensive cancer center.
Radiographic evidence was reportedly used to assess response in 41.4% of patients, whereas clinical assessment was used in 19.1%, and radiographic and clinical assessments were used in 39.5%. As in first-line therapy, the radiographic response was most often assessed using McDonald criteria (76.7%). Stable response was the most common best response to second-line therapy (38.4% of patients) (Table 3). Median duration of second-line therapy was 130 days, median time to disease progression was 113 days, and median duration of survival was 153 days. The most frequently reported reason for ending second-line therapy was disease progression (28.6%).
Sequencing of therapy
Sequencing of therapies in first- and second-line treatments is shown in Table 2. Patients most commonly received temozolomide (p.o. or i.v.) monotherapy during first-line therapy (n=385). Of these, 63.9% during second-line therapy received bevacizumab only, and 18.2% received a bevacizumab–irinotecan combination. Of those who received temozolomide and bevacizumab as first-line therapy (9.9%, n=50), 76% received bevacizumab again in the second-line setting, most commonly as monotherapy (60%, n=30).
Symptoms
During first- and second-line therapies, disease- or treatment-related headaches were reported in 65.8% of patients, neurologic/neurocognitive deficiency in 37.0%, disability in 20.1%, seizures in 20.1%, and pain in 18.9% (Figure 1). During first-line treatment, most symptoms were disease-related rather than treatment-related as reported by the physician. For example, of those with physician-reported symptoms, 89.7% (n=297) of headaches, 86.6% (n=161) of neurologic deficits, and 96.0% (n=97) of seizures were attributed to GB. Disease-related symptoms were also more common than treatment-related symptoms during second-line therapy. Among the three most common symptoms, 90.7% (n=311) of headaches, 94.6% (n=175) of neurologic deficits, and 95.9% (n=117) of disability were attributed to GB rather than second-line therapy.
Figure 1.
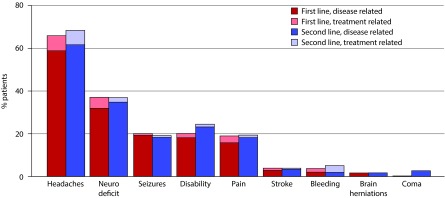
Physician-reported symptoms experienced during first- and second-line therapies.
Neuro deficit = neurologic or neurocognitive deficit. The total percentage of patients on first-line therapy experiencing ‘other’ symptoms was 0.8%, and the total percentage on second-line therapy was 1.4%.
Cancer-related use of healthcare resources
Overall, the resources for supportive care used frequently during first- and second-line therapies were corticosteroids (83.0% of patients overall, 78.8% during first-line therapy and 62.6% during second-line therapy), anti-epileptics (50.7%, 45.8%, and 41.5%), narcotic opioids (48.9%, 45.3%, and (41.4%), proton pump inhibitors (47.6%, 45.2%, and 40.0%), and anti-depressants (26.4%, 21.1%, and 23.9%) (Table 4).
Table 4.
Physician-reported use of healthcare resources.
| Resource, n (%) | Overalla,b | First Lineb | Second Lineb |
|---|---|---|---|
| Supportive care | |||
| Corticosteroids | 399 (83.0) | 379 (78.8) | 301 (62.6) |
| Anti-epileptics | 247 (50.7) | 223 (45.8) | 202 (41.5) |
| Narcotic opioids | 235 (48.9) | 218 (45.3) | 199 (41.4) |
| Proton pump inhibitors | 232 (47.6) | 220 (45.2) | 195 (40.0) |
| Anti-depressants | 129 (26.4) | 103 (21.1) | 117 (23.9) |
| Growth factors | 61 (12.5) | 31 (6.4) | 40 (8.2) |
| Transfusions | 50 (10.1) | 36 (7.3) | 26 (5.3) |
| Stimulants | 22 (4.5) | 11 (2.2) | 18 (3.7) |
|
| |||
| Inpatient hospitalizations | 60 (13.0) | 46 (10.0) | 23 (5.0) |
|
| |||
| Oncology clinic/oncologist | 383 (99.2) | 381 (98.7) | 379 (98.2) |
|
| |||
| Emergency room | 104 (44.3) | 72 (30.6) | 65 (27.7) |
|
| |||
| Radiotherapist | 217 (94.3) | 217 (94.3) | 58 (25.2) |
|
| |||
| Palliative care | 46 (21.6) | 22 (10.3) | 41 (19.2) |
|
| |||
| Pain specialist | 27 (13.2) | 25 (12.3) | 19 (9.3) |
|
| |||
| Rehabilitation services | 75 (39.9) | 66 (35.1) | 50 (26.6) |
|
| |||
| General practitioner | 64 (42.7) | 62 (41.3) | 47 (31.3) |
|
| |||
| Home visits | 29 (17.1) | 20 (11.8) | 20 (11.8) |
|
| |||
| Skilled nursing facility | 11 (6.1) | 6 (3.3) | 9 (5.0) |
|
| |||
| Hospice unit stays | 27 (13.0) | 8 (3.9) | 20 (9.7) |
‘Overall’ denotes the number of patients observed for physician-reported use of supportive care in first-line therapy and/or second-line therapy.
Excludes unknowns (observations where physicians could not recall if patient used the service) and third-line resource use.
Overall, 94.8% of patients received radiation therapy after the diagnosis of GB. Mean (SD) total dose of radiation was 50.5 (13.6) Gy among patients who received radiation during first- or second-line treatments. During first-line treatment, 84.9% received radiation with a mean (SD) total dose of 50.8 (12.5) Gy. During second-line treatment, 5.0% received radiation with a mean (SD) total dose of 40.2 (15.3) Gy. MRI, CT, and PET were used by 85.3%, 45.5%, and 13.7% during first-line therapy and 79.5%, 32.4%, and 10.3% during second-line therapy, respectively.
Inpatient hospitalizations were reported in 13.0% of patients (10.0% during first- and 5.0% during second-line therapies). Mean (SD) number of inpatient hospitalizations was 1.3 (0.7) per patient with a hospitalization (1.1 [0.3] for first- and 1.2 [0.4] for second-line therapies). The most frequently reported reasons for inpatient hospitalizations were GB-related treatment (43.3% of patients) and management of GB symptoms (40.0%). The emergency room was used by 44.3% (30.6% during first- and 27.7% during second-line therapies). In patients who had undergone a visit to the emergency room, the mean (SD) number of visits was 2.1 (1.6) (1.2 [0.7] for first- and 1.8 [1.3] for second-line therapies). The most frequently reported reason for use of the emergency room was management of GB symptoms (52.9%).
Discussion
In patients with GB, the prognosis is poor and the likelihood of disease recurrence is high. Incremental improvements in therapy have resulted in prolonged survival, but the treatment of GB is not curative. To better understand real-world application of the paradigms of GB treatment in the USA, we described treatment patterns and outcomes in this retrospective chart-abstraction study.
National Comprehensive Cancer Network (NCCN) Clinical Practice Guidelines in Oncology [6] recommend tumor resection followed by radiation and/or temozolomide chemotherapy as first-line treatment, which is the standard of care [5,6]. Patients in the present study most commonly underwent temozolomide (p.o.) monotherapy (76.5%) or temolozamide–bevacizumab combination therapy (9.9%) as first-line therapy. This strategy was consistent with NCCN guidelines and the literature [2,17–20]. In a large population-based study using data on commercial claims, temozolomide was administered as first-line therapy in ≈40% of patients after surgery [21]. In that study, median survival (529 days) was higher in patients receiving neither temozolomide nor radiation therapy compared with temozolomide monotherapy (331 days). The authors postulated that the high median survival of patients with neither treatment may suggest lower-grade tumors for which standard-of-care therapy (radiation therapy with or without temozolomide) did not seem warranted. Inclusion of bevacizumab in combination with temozolomide as first-line therapy in the present analyses may suggest increasing use of bevacizumab [22–25]. In the present analyses, few patients (<5%) were enrolled in clinical trials, thereby highlighting a possible trend in the use of bevacizumab for routine care.
For recurrent disease, according to the NCCN, reoperation should be considered first, followed by chemotherapeutic options beginning with bevacizumab (bevacizumab with/without other chemotherapy, temozolomide, nitrosourea or combination procarbazine/lomustine/vincristine, cyclophosphamide, or platinum-based regimens). For only a subset of patients with recurrent disease, reoperation or repeat irradiation is recommended with or without chemotherapy [6], and additional subgroup recommendations are not available. Thus, recommendations for second-line therapy do not represent a definitive standard of care for recurrent disease and have largely been absent in treatment paradigms, thereby highlighting a pressing unmet treatment need [12–14]. An important finding of these analyses is the use of bevacizumab in GB treatment, particularly during second-line systemic therapy (58.1% of patients received bevacizumab monotherapy in this setting). The US Food and Drug Administration (FDA) provided accelerated approval of bevacizumab as a single agent for patients with GB whose disease progressed after previous first-line therapy but not in newly diagnosed patients [26]. Since the approval of bevacizumab for GB treatment, few studies have described the specific use of bevacizumab for GB treatment outside of clinical trials. Our study confirms the common use of bevacizumab for second-line systemic therapy, suggesting a pattern of second-line treatment for GB in routine care consistent with the indicated use for bevacizumab. Treatment patterns, patient populations, and outcomes may differ depending on the site of care [27,28]. Thus, it is noteworthy that approximately half of the physicians who prescribed bevacizumab during second-line treatment were affiliated with facilities that included teaching hospitals, whereas a lower percentage of physicians who prescribed bevacizumab were affiliated with NCI-designated comprehensive cancer centers.
Some evidence suggests that the use of bevacizumab for the treatment of progressive GB may be associated with prolonged survival. Analyses of the survival of GB patients who died before and after approval of bevacizumab by the US FDA demonstrated that median survival of patients with GB improved after bevacizumab approval [9]. Median survival for patients who died before bevacizumab approval in 2006 and 2008 was 8 months and 7 months, respectively, and median survival for patients who died after bevacizumab approval in 2010 was 9 months.
Incremental advances have been observed in overall survival, but improvements have not been seen across all demographics. Improvement has been observed in patients who received the recommended multidisciplinary treatment of complete resection followed by postoperative radiation therapy [10,29]. However, evidence suggests that not all patients receive recommended treatment [30,31], which may depend on patient factors and geographic distribution of oncology services. In a study of adult patients in the USA in the Surveillance, Epidemiology, and End Results database, postoperative radiation therapy was less likely in older and unmarried patients, and more likely in patients in higher-income geographic areas or those with a high prevalence of radiation centers [30]. In another study, radiation therapy was less likely in patients with higher age; lower annual income; unmarried status; subtotal resection/biopsy; and African– American, Asian–American, or Hispanic race. However, overall survival improved for patients who received radiation therapy [29]. It has been shown that a six-week delay in radiation therapy reduces median survival by 11 weeks [32]. In the present study, 94.8% of patients received radiation therapy after a diagnosis of GB.
In the Glioma Outcomes Project (GO Project), which assessed patients treated in academic and community practices, only 54% of patients received chemotherapy [33]. Resource use consistent between the GO Project and the present study included MRI (92% use in GO Project, 85% in the present study) and corticosteroid use (99% and 83%, respectively). Use of anti-epileptic medication was more frequent in the GO Project (88% vs 51%), and use of anti-depressant medication was more frequent in the present study (26% vs 8% in GO Project). Assessment of the frequency of inpatient hospitalizations and emergency-room visits, each 0.2 admissions per month [4], was consistent with that of the present study, which had 1.3 and 2.1 admissions per patient with a hospitalization or visit to an emergency room, respectively.
Symptoms of headaches, neurologic deficit, seizures, disability, and pain were consistent with the literature [34–38]. Some preoperative factors, such as cognitive, language, and motor deficits, have been found to be associated with a poorer prognosis [35]. Venous thromboembolisms have been associated with a higher risk of two-year mortality [39]. Thromboembolisms were not commonly reported in the present study.
Limitations of this study include those typical of chart-abstraction studies. Extent of physician participation was low (19%), which could limit the generalizability of the information. Information obtained from randomly selected physicians may have been different from that obtained from physicians who did not participate, thereby potentially limiting the generalization of study results. Completeness and accuracy of patient information was dependent upon the medical history available to the physician and accuracy of the information transferred by the physician from the patient chart. Due to exclusion of patients censored in the first 3 months after initiation of second-line therapy, survival from initiation of second-line treatment was potentially underestimated, and time to progression and duration of second-line treatment might have been biased. Patients who did not progress to second-line therapy were excluded from the study, thereby limiting generalization of these results to a smaller patient population with GB.
Conclusions
Symptomatic burden and survival represent a pressing unmet need for advanced therapies and therapeutic strategies for patients with GB, particularly during disease recurrence. In this observational study, most patients with GB received temozolomide during first-line therapy and bevacizumab (as monotherapy or in combination with other agents) during second-line therapy. Use of supportive care appeared to be higher in first-line therapy than in second-line therapy with the exception of anti-depressants, growth factors, and stimulants. These analyses suggest potential trends in the treatment of patients with GB in the USA and may aid in the design of future studies to help define effective treatment options for GB.
Acknowledgments
We thank Anita Chawla, PhD (Analysis Group, Inc.) for her consulting support and Joseph Giaconia, MS (INC Research, Raleigh, NC, USA) for his writing support. The chart abstraction study was conducted online by All Global (New York, NY, USA).
Abbreviations
- FDA
Food and Drug Administration
- GB
glioblastoma
- GO Project
Glioma Outcomes Project
- NCI
National Cancer Institute
- NCCN
National Comprehensive Cancer Network
- SD
standard deviation
Footnotes
Contributions
Allicia Girvan, Gebra Carter, Li Li, and Michael Lahn participated in study design. Anna Kaltenboeck, Jasmina Ivanova, Maria Koh, Jessi Stevens, and Eleanor Hayes-Larson were involved in data collection. All authors participated in data interpretation, drafting of the manuscript, and approval of the final version of the manuscript.
Potential conflicts of interest
The International Committee of Medical Journal Editors’ (ICMJE) Potential Conflicts of Interests forms for the authors are available for download at: http://www.drugsincontext.com/wp-content/uploads/2015/03/dic.212274-COI.pdf
Allicia Girvan, Gebra Carter, Li Li, and Michael Lahn are employees of and hold stock in Eli Lilly and Co. Anna Kaltenboeck, Anita Chawla, Jasmina Ivanova, Maria Koh, and Jessi Stevens are employees of Analysis Group, Inc. (New York, NY, USA), which received funding from Lilly for the conduct of this study.
Funding declaration
This study was funded by Eli Lilly and Co. and/or one of its wholly owned subsidiaries.
References
- 1.Dunn GP, Rinne ML, Wykosky J, et al. Emerging insights into the molecular and cellular basis of glioblastoma. Genes Dev. 2012;26:756–84. doi: 10.1101/gad.187922.112. http://dx.doi.org/10.1101/gad.187922.112. [DOI] [PMC free article] [PubMed] [Google Scholar]
- 2.Chamberlain MC, Cloughsey T, Reardon DA, et al. A novel treatment for glioblastoma: integrin inhibition. Expert Rev Neurother. 2012;12:421–35. doi: 10.1586/ern.11.188. http://dx.doi.org/10.1586/ern.11.188. [DOI] [PubMed] [Google Scholar]
- 3.Central Brain Tumor Registry of the United States CBTRUS statistical report: primary brain and central nervous system tumors diagnosed in the United States in 2004–2007. 2011. Available at: http://www.cbtrus.org/2011-NPCR-SEER/WEB-0407-Report-3-3-2011.pdf. [Last accessed: July 1, 2013].
- 4.Kutikova L, Bowman L, Chang S, et al. Utilization and cost of health care services associated with primary malignant brain tumors in the United States. J Neurooncol. 2007;81:61–5. doi: 10.1007/s11060-006-9197-y. http://dx.doi.org/10.1007/s11060-006-9197-y. [DOI] [PubMed] [Google Scholar]
- 5.Stupp R, Mason WP, van den Bent MJ, et al. Radiotherapy plus concomitant and adjuvant temozolomide for glioblastoma. N Engl J Med. 2005;352:987–96. doi: 10.1056/NEJMoa043330. http://dx.doi.org/10.1056/NEJMoa043330. [DOI] [PubMed] [Google Scholar]
- 6.National Comprehensive Cancer Network NCCN Guidelines for Treatment of Cancer by Site: Central Nervous System Cancer. 2013. Version 2.2013. Available at: http://www.nccn.org/professionals/physician_gls/pdf/cns.pdf [Last accessed: October 2013].
- 7.Filippini G, Falcone C, Boiardi A, et al. Prognostic factors for survival in 676 consecutive patients with newly diagnosed primary glioblastoma. Neuro Oncol. 2008;10:79–87. doi: 10.1215/15228517-2007-038. http://dx.doi.org/10.1215/15228517-2007-038. [DOI] [PMC free article] [PubMed] [Google Scholar]
- 8.Grossman SA, Ye X, Piantadosi S, et al. Survival of patients with newly diagnosed glioblastoma treated with radiation and temozolomide in research studies in the United States. Clin Cancer Res. 2010;16:2443–9. doi: 10.1158/1078-0432.CCR-09-3106. http://dx.doi.org/10.1158/1078-0432.CCR-09-3106. [DOI] [PMC free article] [PubMed] [Google Scholar]
- 9.Johnson DR, Leeper HE, Uhm JH. Glioblastoma survival in the United States improved after Food and Drug Administration approval of bevacizumab: a population-based analysis. Cancer. 2013;119:3489–95. doi: 10.1002/cncr.28259. http://dx.doi.org/10.1002/cncr.28259. [DOI] [PubMed] [Google Scholar]
- 10.Koshy M, Villano JL, Dolecek TA, et al. Improved survival time trends for glioblastoma using the SEER 17 population-based registries. J Neurooncol. 2012;107:207–12. doi: 10.1007/s11060-011-0738-7. http://dx.doi.org/10.1007/s11060-011-0738-7. [DOI] [PMC free article] [PubMed] [Google Scholar]
- 11.Wen PY, Kesari S. Malignant gliomas in adults. N Engl J Med. 2008;359:492–507. doi: 10.1056/NEJMra0708126. http://dx.doi.org/10.1056/NEJMra0708126. [DOI] [PubMed] [Google Scholar]
- 12.Chang SM, Butowski NA, Sneed PK, et al. Standard treatment and experimental targeted drug therapy for recurrent glioblastoma multiforme. Neurosurg Focus. 2008;20:E4. [PubMed] [Google Scholar]
- 13.Gilbert MR. Recurrent glioblastoma: a fresh look at current therapies and emerging novel approaches. Semin Oncol. 2011;38(suppl 4):S21–S33. doi: 10.1053/j.seminoncol.2011.09.008. http://dx.doi.org/10.1053/j.seminoncol.2011.09.008. [DOI] [PubMed] [Google Scholar]
- 14.Hou LC, Veeravagu A, Hsu AR, et al. Recurrent glioblastoma multiforme: a review of natural history and management options. Neurosurg Focus. 2006;20:E5. doi: 10.3171/foc.2006.20.4.2. http://dx.doi.org/10.3171/foc.2006.20.4.2. [DOI] [PubMed] [Google Scholar]
- 15.Charlson ME, Pompei P, Ales KL, et al. A new method of classifying prognostic comorbidity in longitudinal studies: development and validation. J Chronic Dis. 1987;40:373–383. doi: 10.1016/0021-9681(87)90171-8. http://dx.doi.org/10.1016/0021-9681(87)90171-8. [DOI] [PubMed] [Google Scholar]
- 16.Romano P, Roos L, Jollis J. Adapting a clinical comorbidity index for use with ICD-9-CM administrative data: differing perspectives. J Clin Epidemiol. 1993;46:1075–9. doi: 10.1016/0895-4356(93)90103-8. http://dx.doi.org/10.1016/0895-4356(93)90103-8. [DOI] [PubMed] [Google Scholar]
- 17.Stupp R, Hegi ME, van den Bent MJ, Mason WP, et al. Changing paradigms–an update on the multidisciplinary management of malignant glioma. Oncologist. 2006;11:165–80. doi: 10.1634/theoncologist.11-2-165. http://dx.doi.org/10.1634/theoncologist.11-2-165. [DOI] [PubMed] [Google Scholar]
- 18.Martin V, Liu D, Gomez-Manzano C. Encountering and advancing through antiangiogenesis therapy for gliomas. Curr Pharm Des. 2009;15:353–64. doi: 10.2174/138161209787315819. http://dx.doi.org/10.2174/138161209787315819. [DOI] [PubMed] [Google Scholar]
- 19.Neyns B, D’haeseleer M, Rogiers A, et al. The role of cytotoxic drugs in the treatment of central nervous system gliomas. Acta Neurol Belg. 2010;110:1–14. [PubMed] [Google Scholar]
- 20.van den Bent MJ, Hegi ME, Stupp R. Recent developments in the use of chemotherapy in brain tumours. Eur J Cancer. 2006;42:582–8. doi: 10.1016/j.ejca.2005.06.031. [DOI] [PubMed] [Google Scholar]
- 21.Ray S, Bonafede MM, Mohile NA. Treatment patterns, survival, and healthcare costs of patients with malignant gliomas in a large us commercially insured population. Am Health Drug Benefits. 2014;7(3):140–9. [PMC free article] [PubMed] [Google Scholar]
- 22.Chamberlain MC. Emerging clinical principles on the use of bevacizumab for the treatment of malignant gliomas. Cancer. 2010;116:3988–99. doi: 10.1002/cncr.25256. http://dx.doi.org/10.1002/cncr.25256. [DOI] [PubMed] [Google Scholar]
- 23.Chinot OL, de La Motte Rouge T, Moore N, et al. AVAglio: Phase 3 trial of bevacizumab plus temozolomide and radiotherapy in newly diagnosed glioblastoma multiforme. Adv Ther. 2011;28:334–40. doi: 10.1007/s12325-011-0007-3. http://dx.doi.org/10.1007/s12325-011-0007-3. [DOI] [PubMed] [Google Scholar]
- 24.Nishikawa R. Standard therapy for glioblastoma—a review of where we are. Neurol Med Chir (Tokyo) 2010;50:713–9. doi: 10.2176/nmc.50.713. http://dx.doi.org/10.2176/nmc.50.713. [DOI] [PubMed] [Google Scholar]
- 25.Specenier P. Bevacizumab in glioblastoma multiforme. Expert Rev Anticancer Ther. 2012;12:9–18. doi: 10.1586/era.11.179. http://dx.doi.org/10.1586/era.11.179. [DOI] [PubMed] [Google Scholar]
- 26.Genentech, Inc Avastin® (bevacizumab) prescribing information. 2009. Available at: http://www.accessdata.fda.gov/drugsatfda_docs/label/2009/125085s0169lbl.pdf [Last accessed: October 2013].
- 27.Fayanju OM, Stoll CR, Fowler S, Colditz GA, Jeffe DB, Margenthaler JA. Geographic and temporal trends in the management of occult primary breast cancer: a systematic review and meta-analysis. Ann Surg Oncol. 2013;20(10):3308–16. doi: 10.1245/s10434-013-3157-5. Epub 2013 Aug 22. http://dx.doi.org/10.1245/s10434-013-3157-5. [DOI] [PMC free article] [PubMed] [Google Scholar]
- 28.Keegan KA, Zaid HB, Patel SG, Chang SS. Increasing utilization of neoadjuvant chemotherapy for muscle-invasive bladder cancer in the United States. Curr Urol Rep. 2014;15(4):394. doi: 10.1007/s11934-014-0394-5. http://dx.doi.org/10.1007/s11934-014-0394-5. [DOI] [PMC free article] [PubMed] [Google Scholar]
- 29.Aizer AA, Ancukiewicz M, Nguyen PL, et al. Underutilization of radiation therapy in patients with glioblastoma: predictive factors and outcomes. Cancer. 2014;120:238–43. doi: 10.1002/cncr.28398. http://dx.doi.org/10.1002/cncr.28398. [DOI] [PubMed] [Google Scholar]
- 30.Aneja S, Khullar D, Yu JB. The influence of regional health system characteristics on the surgical management and receipt of post operative radiation therapy for glioblastoma multiforme. J Neurooncol. 2013;112:393–401. doi: 10.1007/s11060-013-1068-8. http://dx.doi.org/10.1007/s11060-013-1068-8. [DOI] [PMC free article] [PubMed] [Google Scholar]
- 31.Sherwood PR, Dahman BA, Donovan HS, et al. Treatment disparities following the diagnosis of an astrocytoma. J Neurooncol. 2011;101:67–74. doi: 10.1007/s11060-010-0223-8. http://dx.doi.org/10.1007/s11060-010-0223-8. [DOI] [PubMed] [Google Scholar]
- 32.Irwin C, Hunn M, Purdie G, et al. Delay in radiotherapy shortens survival in patients with high grade glioma. J Neurooncol. 2007;85:339–43. doi: 10.1007/s11060-007-9426-z. http://dx.doi.org/10.1007/s11060-007-9426-z. [DOI] [PubMed] [Google Scholar]
- 33.Chang SM, Parney IF, Huang W, et al. Patterns of care for adults with newly diagnosed malignant glioma. JAMA. 2005;293:557–64. doi: 10.1001/jama.293.5.557. http://dx.doi.org/10.1001/jama.293.5.557. [DOI] [PubMed] [Google Scholar]
- 34.Bock HC, Puchner MJ, Lohmann F, et al. First-line treatment of malignant glioma with carmustine implants followed by concomitant radiochemotherapy: a multicenter experience. Neurosurg Rev. 2010;33:441–9. doi: 10.1007/s10143-010-0280-7. http://dx.doi.org/10.1007/s10143-010-0280-7. [DOI] [PMC free article] [PubMed] [Google Scholar]
- 35.Chaichana KL, Chaichana KK, Olivi A, et al. Surgical outcomes for older patients with glioblastoma multiforme: preoperative factors associated with decreased survival. J Neurosurg. 2011;114:587–94. doi: 10.3171/2010.8.JNS1081. http://dx.doi.org/10.3171/2010.8.JNS1081. [DOI] [PMC free article] [PubMed] [Google Scholar]
- 36.Daigle K, Fortin D, Mathieu D, et al. Effects of surgical resection on the evolution of quality of life in newly diagnosed patients with glioblastoma: a report on 19 patients surviving to follow-up. Curr Med Res Opin. 2013;29:1307–13. doi: 10.1185/03007995.2013.823858. http://dx.doi.org/10.1185/03007995.2013.823858. [DOI] [PubMed] [Google Scholar]
- 37.Minniti G, Scaringi C, Baldoni A, et al. Health-related quality of life in elderly patients with newly diagnosed glioblastoma treated with short-course radiation therapy plus concomitant and adjuvant temozolomide. Int J Radiat Oncol Biol Phys. 2013;86:285–91. doi: 10.1016/j.ijrobp.2013.02.013. http://dx.doi.org/10.1016/j.ijrobp.2013.02.013. [DOI] [PubMed] [Google Scholar]
- 38.Shah U, Morrison T. A review of the symptomatic management of malignant gliomas in adults. J Natl Compr Canc Netw. 2013;11:424–9. doi: 10.6004/jnccn.2013.0057. [DOI] [PubMed] [Google Scholar]
- 39.Semrad TJ, O’Donnell R, Wun T, et al. Epidemiology of venous thromboembolism in 9489 patients with malignant glioma. J Neurosurg. 2007;106:601–8. doi: 10.3171/jns.2007.106.4.601. http://dx.doi.org/10.3171/jns.2007.106.4.601. [DOI] [PubMed] [Google Scholar]