

Abstract
In a motor vehicle collision (MVC), survivors often receive mild traumatic brain injuries (mTBI). Although there have been some reports of early white matter changes after an mTBI, much less is known about early cortical structural changes. To investigate early cortical changes within a few days after an MVC, we compared cortical thickness of mTBI survivors with non-mTBI survivors, then reexamined cortical thickness in the same survivors 3 months later. MVC survivors were categorized as mTBI or non-mTBI based on concussive symptoms documented in emergency departments (EDs). Cortical thickness was measured from MRI images using FreeSurfer within a few days and again at 3 months after MVC. Post-traumatic stress symptoms and physical conditions were also assessed. Compared with the non-mTBI group (n=23), the mTBI group (n=21) had thicker cortex in the left rostral middle frontal (rMFG) and right precuneus gyri, but thinner cortex in the left posterior middle temporal gyrus at 7.2±3.1 days after MVC. After 3 months, cortical thickness had decreased in left rMFG in the mTBI group but not in the non-mTBI group. The cortical thickness of the right precuneus region in the initial scans was positively correlated with acute traumatic stress symptoms for all survivors and with the number of reduced activity days for mTBI survivors who completed the follow-up. The preliminary results suggest that alterations in cortical thickness may occur at an early stage of mTBI and that frontal cortex structure may change dynamically over the initial 3 months after mTBI.
Key words: : cortical thickness, mild TBI, motor vehicle collision, progression, subacute
Introduction
In the United States, approximately 1.7 million traumatic brain injuries (TBIs) occur each year. Of these, approximately 75% are categorized as mild (mTBI) (http://www.cdc.gov/traumaticbraininjury/causes.html). Symptoms that characterize mTBI include brief loss of consciousness (LOC; <30 min), post-trauma amnesia (PTA; <24 h), alterations in mental state (e.g., dizziness or disorientation), or focal neurological deficit(s).1 mTBI survivors, however, show minimal abnormalities on conventional neuroradiological examinations or none at all. Relative to non-mTBI survivors, mTBI survivors experience significantly more subjective physical, emotional, and cognitive symptoms, possibly associated with brain changes caused by mTBI.2–6 Although most symptoms resolve spontaneously in the majority of survivors 3 to 6 months after a single mTBI, about 5% of survivors continue having some symptoms years after trauma, suggesting sustained changes in brain structure or function in these chronic mTBI survivors.7,8 In addition, those who experience mTBIs repeatedly over their lifetime may develop a progressive neurodegenerative condition known as chronic traumatic encephalopathy.9,10
Identifying brain changes in the early stage after mTBI remains a challenge, because conventional radiological examinations detect few changes. Recent diffusion tensor imaging (DTI) studies reported differences in fractional anisotropy (FA) or mean, radial, or axial diffusivity in the white matter of mTBI survivors compared with persons without mTBI, suggesting changes in white matter integrity after mTBI.11–17 Less is known about early changes in cortical structure after mTBI. Animal studies suggest that mTBI can cause rapid alterations in the cortex of affected animals.18–20 For example, a study in rats reported that a mild impact on the cortical surface produced rapid focal cortical thickening in the periphery of impact regions within a day of injury, with thickened cortex progressively thinning in the subsequent 21 days.21 These animal findings raise a possibility that mTBI may alter cortical thickness of survivors in the early post-trauma period. Until recently, however, it was not possible to make a detailed examination of cortical thickness in mTBI survivors after the trauma.
A recent analytical advance, automated vertex-based measurements of cortical thickness, now allows assessment of cortical changes using high resolution T1-weighted anatomical MRI (aMRI) images. Recent studies using this approach revealed progressive cortical thinning in moderate to severe TBI in children and adults.22–24 To date, however, few studies have examined cortical thickness in mTBI survivors during the early post-mTBI period.
A study of veterans reported thinner regions in left dorsal superior frontal and superior temporal gyri at an average of 3 months after mTBI caused by blast compared with healthy controls, suggesting early effects of mTBI on the cerebral cortex.25 In contrast, a second study examining the cortical structures of survivors who experienced a heterogeneous set of head traumas reported no differences in cortical thickness at approximately 14 days and at 4 months after mTBI compared with healthy controls.16 Finally, a study using thickness-based measures of gray matter volume (thickness times surface area) reported no volumetric difference in the initial weeks (average 23 days) after heterogeneous head traumas, while finding a significant decrease in the gray matter volume of right precuneus cortex from initial weeks to a year after mTBI, compared with healthy controls.26
Currently, cortical thickness studies conducted shortly after an mTBI remain inconclusive, with several factors potentially contributing to differences in findings. The animal study cited above suggests that detecting dynamic changes in cortical thickness after mTBI may depend on the timing of the investigation.21 For example, some cortical thickening may occur rapidly after mild cortical impact, but may not be detectable at several weeks after mTBI because of subsequent thinning of the same region. Thus, repeated studies soon after trauma might be needed to detect alterations of cortical thickness after mTBI. Another important factor may be the character of the mTBI. For example, a study of a homogeneous injury mechanism (all survivors had blast injuries) detected change in cortical thickness,25 but a study of heterogeneous injuries did not.16 Different injury mechanisms may result in different pathophysiological processes and patterns of injuries. Therefore, studying a homogeneous injury mechanism may increase the likelihood of detecting subtle, dynamic cortical thickness changes after mTBI.27
In the current study, we examined cortical thickness in mTBI survivors within 2 weeks after a motor vehicle collision (MVC) to address the question of early cortical thickness alteration after mTBI. Cortical thickness was also re-examined in survivors who completed a follow-up session 3 months later to explore subsequent progressive changes in the cortex. MVC is the leading cause of mTBI treated in emergency departments (EDs) in the United States.28,29 The injury mechanism of TBI caused by MVC is characterized by very forceful acceleration-deceleration of the head and/or the head striking an object.30,31 We compared cortical thicknesses in survivors who experienced mTBI symptoms in the peritrauma period after MVC and MVC survivors who did not experience mTBI symptoms.
Methods
Survivors and assessment
Survivors who had an MVC and visited an ED within 48 h of the accident were recruited from EDs of local Level I centers. The study included English-speaking adults (18–60 years old) of all races/ethnicities, but excluded pregnant women or survivors who were under the influence of alcohol or recreational drugs when the accident happened. Survivors were also excluded if they had Glasgow Coma Scale (GCS) scores less than 13 or any abnormality on conventional CT examination in the ED. An Abbreviated Injury Scale (AIS) score was calculated to evaluate the severity of physical injury in each survivor (Association for the Advancement of Automotive Medicine, 1998 update), and survivors with an AIS score greater than 3 were excluded. All survivors gave written Institutional Review Board approved informed consent. All survivors were alert and oriented on testing. Most selected survivors had severe acute pain as measured with the Numeric Rating Scale (NRS; ≥6) in the ED.
Survivors completed self-report measures in the ED that included questionnaires about the incidence and duration of LOC and PTA, as well as other information about the MVC. To provide information on traumatic stress symptoms at each MRI session, survivors completed a post-traumatic stress disorder (PTSD) Checklist-Stressor Version (PCL) questionnaire, in which the MVC was specified as the index traumatic event.32,33 Survivors' physical health was evaluated during the follow-up session using questionnaires, during which they were asked to estimate the number of days when some of their usual activities could not be performed. Police traffic reports were obtained from the Ohio Department of Public Safety https://ext.dps.state.oh.us/CrashRetrieval/OHCrashRetrieval.aspx to confirm information on the MVC collected in EDs.
mTBI diagnosis
mTBI was diagnosed by reviewing ED medical records and self-report questionnaires. According to the American Congress of Rehabilitation Medicine (ACRM) criteria, persons who experienced head impact or acceleration-deceleration during MVC are considered to have sustained mTBI if they had LOC for <30 min, PTA for <24 h, or severe neurological symptoms such as disorientation, dizziness, or headache.1 Survivors with a GCS score less than 13 or positive radiological examinations for any brain lesions were excluded. Survivors who did not experience any concussive symptoms served as a non-mTBI control group. All survivors were invited to undergo an initial MRI session within 2 weeks and a follow-up MRI session at 3 months after MVC.
MRI data acquisition
Survivors were scanned using a 3.0 Tesla General Electric Signa HDX MRI scanner at the University of Toledo. Survivors were positioned in the MRI scanner with their heads comfortably restrained to reduce movement. Heart rate and respiration were monitored throughout the experiment. A high-resolution T1-weighted aMRI image was obtained with a 3-D Volume Inversion Recovery Fast Spoiled Gradient Recall Echo (IR-FSPGR) protocol (repetition time [TR]=7.9 msec, echo time [TE]=3 msec, TI=650 msec, field of view [FOV]=25.6×25.6 cm, matrix=256×256, slice thickness=1 mm with no gap, voxel dimensions=1×1×1mm, 164 contiguous axial slices to cover the whole brain).34 T2*-weighted images were acquired with Echo Planar Imaging pulse sequence: multiphase gradient echo pulse sequence, (TR=2000 msec, TE=30 msec, flip angle (FA)=90°, FOV=3.75×3.75 mm, matrix=64×64, slice thickness=3.5 mm with no gap, 34 axial interleveled slices to cover the whole brain. Both images were reviewed by an experienced radiologist to screen for any clinical abnormalities.
Cortical thickness measurement
Automated cortical thickness measurements were made on a Linux workstation from the aMRI images with FreeSurfer programs (version 4.5.1) (http://www.surfer.nmr.mgh.harvard.edu/fswiki)35–37 that have been shown to be valid and reliable.34,38–40 Structural analyses involved preprocessing high resolution T1-weighted MRI data (including motion correction, transformation to Talairach space, intensity normalization, skull stripping, segmentation, tessellation, smoothing of the cortical gray/white border, and inflating sulci to create a spherical model of each hemisphere).
Thickness measures were based on spatial intensity gradients of white matter, gray matter, and cerebrospinal fluid and were derived from determination of the average of the shortest distances from the gray/white border to pial surface and from the pial surface to gray/white border for each vertex (1×1 mm2 area on the surface). Cortical thickness measure iteration of this process provided a continuous grid of vertex thickness measures covering each hemisphere (approximately 150,000 vertices/hemisphere). All individual MRI slices were visually inspected and inaccuracies in borders were manually corrected if necessary.
A vertex-based group analysis was performed using Freesurfer. Individual spherical models of hemispheres were normalized to the spherical atlas of Freesurfer based on alignment of the cortical folding patterns.41 The normalized cortical thickness maps of individuals were spatially smoothed along the surface using a two-dimensional Gaussian filter with a full width at half maximum (FWHM) kernel of 8 mm. Group comparisons of cortical thickness were performed at every vertex using a general linear model (GLM) of two independently sampled t tests, controlling for age and sex.
A cluster-wise correction for multiple comparisons within each hemisphere was performed by means of Z Monte Carlo simulations as implemented in Freesurfer.42–44 The data were tested against an empirical null distribution of maximum cluster size across 5000 iterations synthesized with an initial cluster forming at vertex-wise threshold of p<0.01. Differences were considered significant after a multiple comparison correction with a cluster-wise p value<0.05 and a surface area >50 mm2.43,45 The minimal size is set relatively low to detect the small, subtle brain changes that are characteristic of mTBI. The cluster-wise p value is a False Positive Rate (FPR), meaning that a cluster of the given size would occur by chance only 5% of the time (p<0.05). The cluster-wise correction using Z Monte Carlo simulations is considered suitable for surface-based analysis and is recommended by the FreeSurfer group. These significant clusters were defined as regions of interest (ROIs) and were studied longitudinally by extracting and comparing regional mean cortical thickness from each survivor's initial and follow-up scans.
Statistical analysis
SPSS (Version 21) was used for statistical analyses. Age and intervals between MVC and the MRI sessions were compared using two-sample t tests between mTBI and non-mTBI groups. The univariate analysis of variance (ANOVA) of PCL scores and acute NRS pain scores at ED admission were conducted using mTBI diagnosis as an independent variable. Changes in the mean regional cortical thickness of each ROI were compared over time from acute to 3 months after MVC within each group using the general linear model of repeated measures—RM-ANOVA. Sex was used as a random factor, and age was used as a covariate in all ANCOVAs. In all the repeated measures ANOVA, the Mauchly Test of Sphericity indicated that the assumption of sphericity had not been violated, supporting the validity of the F-statistic.
Relationships between cortical alteration and stress symptoms were examined using a partial correlation analysis between the mean regional cortical thickness of each ROI and PCL scores, controlling for age and sex. Spearman Rho nonparametric correlations were used to examine the association between mean regional cortical thickness and the survivors' estimate of the number of days when some of their usual activities could not be performed. The results are reported as mean±standard deviation, with p<0.05 considered to be significant.
Results
Demographics and acute traumatic symptoms
Forty-four MVC survivors who were recruited from EDs completed the initial scan session within 2 weeks after the MVC. The majority experienced a frontal/rear collision. All survivors reported dramatic acceleration/deceleration of the head during the MVC, and 16 also reported the head striking an object. None had a GCS of <15 or significant radiological findings in the ED. Twenty-one experienced symptoms that met the diagnostic criteria of mTBI, including altered state of consciousness (confused/disoriented, [n=2], PTA [n=8], and/or LOC [n=10]), and/or neurological symptoms (dizziness [n=2], headache/nausea/vomiting [n=9]). The remaining 23 survivors were free of any mTBI symptoms. The characteristics of the two groups are summarized in Table 1.
Table 1.
Demographic and Behavioral Information
| mTBI | non-mTBI | ||||
|---|---|---|---|---|---|
| Initial MRI session | |||||
| Post-MVC days (range) | 7.2±3.1 (3–14) | 9.0±4.6 (2–20) | T=-1.5 | df=42 | p=0.13 |
| N (male/female) | 21 (9/12) | 23 (9/14) | |||
| Age (years) | 34.3±11.2 | 33.8±11.0 | T=0.15 | df=42 | p=0.88 |
| Frontal/rear vs. lateral/angle collision | 15 vs. 6 | 19 vs. 4 | |||
| NRS pain scores at ED admission | 6.71±2.24 | 6.73±227 | F=0.01 | df=1,39 | p=0.92 |
| PCL scores | 39.69±14.51 | 36.26±15.38 | F=0.54 | df=1,39 | p=0.47 |
| Follow-up MRI session | |||||
| Post-MVC days (range) | 114.2±12.9 (95–137) | 104.3±16.0 (88–137) | T=1.6 | df=21 | p=0.12 |
| N (male/female) | 11 (4/7) | 12 (3/9) | |||
| Age | 31.5±10.1 | 36±12.9 | T=-0.91 | df=21 | p=0.37 |
| Frontal/rear vs. lateral/angle collision | 7 vs. 4 | 9 vs. 3 | |||
mTBI, mild traumatic brain injury; MRI, magnetic resonance imaging; MVC, motor vehicle collision; NRS, Numeric Rating Scale; ED, emergency department; PCL, Post-Traumatic Stress Ddisorder Checklist-Stressor Version.
There were no significant differences between the mTBI and non-mTBI groups with respect to age or the interval between MVC and the initial MRI session (mTBI: 7.2±3.1 days vs. non-mTBI: 9.0±4.6 days; t tests, p>0.1, Table 1). Gender and direction of collision were similarly distributed in both groups. The NRS pain scores at ED admission and the PCL scores at the initial MRI session did not significantly differ when age and gender were controlled (univariate ANOVA, Table 1).
Early cortical thickness differences between mTBI and non-mTBI groups
Vertex-based group comparisons revealed that the mTBI group had thicker regions in left rostral middle frontal gyrus (rMFG) (peak vertex [-21.4, 50.6, −4.8], p=10−3.581) and in right precuneus (peak vertex [9.2, −51.2, 54.6], p=10−4.237) at the initial MRI session, compared with the non-mTBI group (Fig. 1, Table 2). A region in the left posterior middle temporal gyrus (pMTG) was thinner in the mTBI group than in the non-mTBI group at this time [peak vertex (-47.9, −59.1, 2.4), p=10−3.433; Fig. 1, Table 2].
FIG. 1.
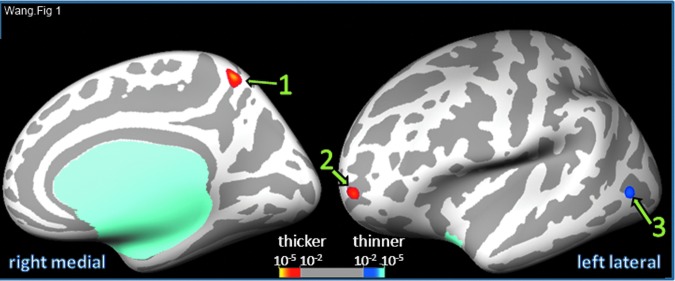
Vertex-based comparison of cortical thickness in the mild traumatic brain injury (mTBI) and non-mTBI groups at initial days after motor vehicle collision. Numbers 1–3 correspond respectively to the suprathreshold clusters in right precuneus, left rostral middle frontal gyrus, and left middle temporal gyrus. Color image is available online at www.liebertpub.com/neu
Table 2.
Cortical Thickness Differences at Post-Motor Vehicle Collision Days and Progressive Changes in Region of Interest Cortical Thickness Over Initial Post-Motor Vehicle Collision 3 Months
| Cluster # | 1 | 2 | 3 | ||||
|---|---|---|---|---|---|---|---|
| Location | Right precuneus | Left rostral middle frontal gyrus | Left middle temporal gyrus | ||||
| Thickness in days | mTBI>non-mTBI | mTBI>non-mTBI | mTBI<non-mTBI | ||||
| Peak vertex | p value | 10−4.237 | 10−3.581 | 10−3.433 | |||
| Talairach (x,y,z) | 9.2, −51.2, 54.6 | −21.4, 50.6, −4.8 | −47.9, −59.1, 2.4 | ||||
| Size (mm2) | 112.17 | 69.69 | 78.56 | ||||
| ROI mean thickness | mTBI (n=21) | 2.33±0.49 | 2.27±0.43 | 2.37±0.29 | |||
| non-mTBI (N=23) | 2.27±0.40 | 2.20±0.39 | 2.44±0.39 | ||||
| ROI thickness change over 3 months | No | No | Decrease* | No | No | No | |
| 11 mTBI | 12 non-mTBI | mTBI | Non-mTBI | mTBI | Non-mTBI | mTBI | Non-mTBI |
| ROI mean thickness | Initial days | 2.50±0.47 | 2.32±0.35 | 2.43±0.43 | 2.31±0.39 | 2.40±0.28 | 2.40±0.35 |
| 3 months | 2.53±0.44 | 2.32±0.34 | 2.29±0.25 | 2.17±0.36 | 2.39±0.37 | 2.48±0.41 | |
| RM-ANOVA | p value | 0.45 | 0.33 | 0.03 | 0.5 | 0.75 | 0.3 |
| F;dfa;η2 | 0.6; 1,8; 0.1 | 1.1; 1,9; 0.1 | 18; 1,8; 0.7 | 0.5;1,9;0.1 | 0.2;1,8;0.0 | 1.2;1,9;0.1 | |
mTBI, mild traumatic brain injury; ROI, region of interest; RM-ANOVA, repeated measures analysis of variance.
Statistically significant at p<0.05 level.
Degrees of freedom (dfs): hypothesis and error.
The mean cortical thicknesses of regions with significant group differences were calculated using individual thickness measures. After controlling for age and sex, the mean cortical thicknesses of the region in the right precuneus were positively correlated (R=0.37, df=40, p=0.02) with the survivors' PCL scores at the initial MRI session pooling data from both the mTBI and the non-mTBI groups (N=44, Fig. 2). There was not a significant correlation unless the data were pooled across diagnostic groups (mTBI: R = −0.09, df=16, p=0.74; non-mTBI: R=0.20, df=19, p=0.38).
FIG. 2.

Relationship between post-traumatic stress disorder Checklist-Stressor Version (PCL) scores and the regional mean cortical thickness of right precuneus region (cluster 1) defined from the vertex-based group difference at initial magnetic resonance imaging (MRI) session. The positive correlation is significant (R=0.37, df=40, p=0.02) across all survivors (mild traumatic brain injury [mTBI] and non-mTBI). ROI, region of interest.
Follow-up at 3 months after MVC
Subgroups of 11 mTBI survivors and 12 non-mTBI survivors completed a follow-up MRI session at 114.2±12.9 days after MVC. The characteristics of the two groups are summarized in Table 1. These groups were not significantly different in age or interval since MVC (Table 1), and sex and direction of collision were similarly distributed (Table 1). The left rMFG, pMTG, and right precuneus regions where group thickness differences were found at the initial MRI session were used as ROIs to determine individual regional cortical thicknesses from the follow-up MRI session data. The mean thickness of the left rMFG region significantly decreased from the first scan to the 3 months after MVC scan in the mTBI survivors (repeated measure Greenhouse-Geisser F=18.1, dfs=1,8, p=0.03; Table 2). In contrast, the mean thickness of this region did not change in non-mTBI survivors (F=4.99, dfs=1,9, p=0.50). Regional mean thickness changes over time in the other regions were not significant in either group (Table 2).
During the initial 3 months after MVC, the number of days when some usual activities could not be performed ranged from 0–90 days in the mTBI survivors (Fig. 3). A similar range was seen in non-mTBI survivors. The number of days of reduced usual activities was positively correlated with the mean cortical thicknesses of the right precuneus region during the initial scan in the mTBI subgroup (Spearman Rho test, R=0.715, n=11, p=0.01) (Fig. 3). This relationship was not seen in the non-mTBI subgroup (Spearman Rho test, R=0.419, n=14, p=0.14).
FIG. 3.

Relationship between the number of reduced usual activity days over the initial 3 months after motor vehicle collision and the regional mean cortical thickness of right precuneus region (cluster 1) in the mild traumatic brain injury (mTBI) survivors. The positive correlation was significant (Spearmas Rho test, R=0.715, n=11, p=0.01) in mTBI group, but correlation in the non-mTBI group was not significant. ROI, region of interest.
All high-resolution sMRI and low resolution T2*-weighted images were reviewed by an experienced radiologist, and no clinical abnormalities were found.
Discussion
Previous findings on alterations in cortical thickness after mTBI are limited and inconsistent. In this pilot study, we used vertex-based analyses and found thickness increases in left rMFG and right precuneus and thickness decreases in left pMTG, comparing mTBI survivors with non-mTBI survivors at an average of 7 days after MVC. Interestingly, the early increased thickness of left rMFG subsequently decreased in the mTBI group at 3 months, with no similar change in the non-mTBI group.
While a study of heterogeneous head trauma found no changes in cortical thickness at 13 days and at 4 months, we have found significant changes studying mainly uniaxial frontal-rear MVC survivors at an average of 7 days after the MVC. Given that early brain responses to mTBI are likely to be subtle, dynamic and highly dependent on the specific nature of the head trauma,27 the homogeneity of the injury mechanism we studied and the early time points for scans may have enhanced our detection of subtle and transient cortical thickness changes.21,31
In our control group of injured survivors with a similar trauma, we were able to document comparable levels of body injuries and psychological distress, thus controlling for potentially important confounding factors, such as stress and pain.46,47 Differences in cortical thickness findings between our study and a previous study that assessed cortical thickness 3 months after a blast injury may be attributed to differences in trauma types, post-trauma durations, or the nature of the control groups.48
Early cortical thickening in mTBI survivors after MVC
We have identified thickness increases in the left rMFG around the Brodmann area (BA) 10 region. This region is reportedly involved in a range of cognitive functions, including working memory, executive functions, and emotion regulation.49,50 Interestingly, a similar region in mTBI survivors showed decreased activation during high processing load conditions of an auditory working memory task at around 26 days after head trauma.51 The current findings raise the possibility that early changes in working memory activations after mTBI may involve mTBI related changes in frontal cortical thickness.
The cortical thickness of this region decreased from initial days to 3 month after MVC in mTBI survivors, but not in non-mTBI survivors. Similar progressive normalization of cortical thickness reported in the animal model of mTBI suggests that cortical thickness changes may reflect recovery from brain lesion.21 Meanwhile, in children from 3 to 18 months with moderate and severe TBI, longitudinal thickness changes in the medial frontal cortices of patients with TBI appear correlated with deficits in behavioral regulation and emotional control measures at 18 months after TBI.23 The functional relevance of progressive structural cortical changes in adults soon after mTBI is still unclear, however.26 Progressive thickness changes in left rMFG may affect working memory activation in mTBI survivors, as evidenced by co-localization of abnormal working memory in this region soon after mTBI. This possibility needs to be tested by future studies that concurrently examine progressive structural and functional changes after mTBI.
We have also found thickening in the right precuneus region of mTBI survivors. The thickness of the right precuneus region has been linked to symptom severity in psychiatric survivors. In veterans with chronic symptoms years after mTBI, the cortical thickness of the right precuneus was negatively correlated with current or cumulative post-traumatic stress symptoms, as measured with the Clinician Administrated PTSD Scale (CAPS), in combined groups of veterans who did and did not have PTSD.52
In our study, precuneus thickness was associated with overall stress levels as reflected by PCL, combining our mTBI and non-mTBI survivor groups. The correlation we found was in a different direction, however. It is possible that the timing of the measures could influence these relationships, because progressive atrophic changes in this region would be suggested by decreased gray matter volume and density of precuneus from 1 month to 1 year after mTBI.26 Interestingly, the increased cortical thickness of mTBI survivors at initial days after MVC was significantly correlated with the number of reduced usual activity days over the initial 3 months after MVC. An MVC can impair the quality of life of injured survivors, and a prolonged reduction in usual activities may reflect poor health.53
The current findings raise the possibility that the thickness of the right precuneus may predict health status of mTBI survivors in subsequent months. It is also possible that precuneus thickness changes are linked to memory deficits reported after mTBI. Precuneus is involved in episodic memory retrieval,54 and the cortical thickness of a region in the right precuneus was positively correlated with the response time and errors of a working memory task in children without TBI.24 Moderate to severe TBI altered these relationships in children as early as 4 days after head trauma.24 Cortical thickness of a region including the left precuneus has been positively correlated with performance on a declarative memory task in adult survivors with severe TBI.22 This possible link to memory function remains interesting but speculative because we did not assess memory function.
We did not explore the mechanisms that may contribute to cortical thickening in the current pilot study, but several possibilities in this context can be considered. In animal studies, regional micro-edema has been found in thickened cortical regions within a day after cortical impact.21 In the current study, we identified cortical thickening in rMFG and precuneus areas that are vulnerable to direct impacts from coup/contrecoup injury in frontal-rear axis head injury.31,55 If the mTBI caused a local release of excitotoxins from damaged cells in these regions,56 these in turn can contribute to inflammatory reactions, possibly including micro-edema.57–59 Consistent with this possibility, a recent study reported elevated cortical fractional anisotropy in similar regions, 14 days to 4 months after mTBI, which could also be the consequence of cytotoxic edema.16 Acute cerebral inflammatory reactions have been reported to resolve within months after injury and likewise thickened cortical regions in animal studies underwent thinning over 21 days with reduction of micro-edema.21 Our finding of subsequent thinning of the initially thickened left rMFG region over 3 months after MVC may reflect similar dynamics and recovery from early inflammatory reactions.
Localized micro-hemorrhages may also contribute to the precuneus thickening we found. The thickened right precuneus region lies within the mesial extent of BA 7 that is bordered by the falx cerebri in the interhemispheric fissure and nearby sagittal sinus and bridging veins. Front-end MVCs frequently cause intracranial hemorrhages adjacent to the falx, likely from the movement of the brain against the falx.31 Thus, given the fact that a majority of our survivors experienced frontal or rear collisions, direct cerebral contusion or micro-hematoma may have contributed to cortical thickening in this region, a possibility that will need to be confirmed in the future studies.
Unlike the progressive reversal of focal thickening in rMFG over the initial 3 months after MVC, the focally thickened precuneus region did not show thinning over the subsequent 3 months in the current study. Another study did find reductions of gray matter volume (measured based on cortical thickness and surface area) and density (volume-based morphometry) in the right precuneus 1 month to 1 year post-injury, raising the possibility that duration of recovery may be a factor contributing to these differences in findings.26
The reported low resolution T2*-weighted echo planar images are only suitable clinically for the diagnosis of large hematomas. Detecting micro-hemorrhaging and edema underlying subtle cortical thickness changes may necessitate quantitative vertex-based analyses of concurrent high-resolution and sensitive diffusion- and susceptibility-weighted images. These mechanisms remain speculative until examined by future studies.
Early cortical thinning in mTBI survivors after MVCs
Regarding the thinning we found in the left pMTG in mTBI survivors compared with non-mTBI survivors at an average of 7 days after MVC, no significant relationship between thinning in this area and functional symptomatology was found in our cohort. The affected region is located at the junction of BA 21, 20, and 37. This region has been linked to higher-level modality-nonspecific language processing and word generation,60,61 as well as reasoning.62 Thinning in this region might affect language generation and similar functions in mTBI survivors, which in turn could contribute to impairment of cognitive and social functions in mTBI survivors. These possibilities raise issues to be addressed in future studies.
This pilot study did not examine the mechanisms of early cortical thinning after an mTBI, but we have some conjectures based on existing literature. The mechanism of cortical thinning could involve cell loss because cortical thickness is related to cell density,63 and chronic cortical thinning after mild, moderate, or severe TBI has been attributed to loss of cells or neuritis.22,23,52 Similar atrophic changes have been detected in some cortical regions at 3 days after mTBI in a mice model,64 which raises the possibility that cortical thinning because of atrophy may start in the early post-mTBI period. Other pathological mechanisms to consider for explaining cortical thinning at an early stage after mTBI would include vascular changes,65 and acute (less than 72 h) hypoperfusion, as has been reported in the cortex of concussed survivors with persistence in several survivors over the following months.58,66–68
Acute hypoperfusions are attributed to reversible micro-vasoconstriction in a rat model of mTBI,69 and acute vasoconstriction has been reported within an hour after TBI in human survivors with subarachnoid hemorrhage.70,71 Further, even transient hypoperfusion may produce prolonged changes in cortical thickness as evidenced by decreased cortical thickness and less fMRI activation in rats at 4 months after a single episode of hypoxia-ischemia.72 Future studies that simultaneously measure cortical thickness and perfusion at an early stage after mTBI may shed light on this relationship.
Limitations
Our current study has meaningful limitations. First, the number of subjects involved in both imaging sessions is modest, and the use of trauma-exposed controls does not allow assessment of non-specific trauma factors. A trauma-free healthy control group is needed for identifying these effects on cortical structures. Second, effects of other confounding factors (e.g., previous head trauma, handedness) also need systematic investigation. These factors may have limited our ability to detect more subtle progressive changes after mTBI. Further, we have only limited data regarding functional significance of the cortical changes we have observed. Future studies should use additional functional outcome measures in combination with advanced imaging analyses. Finally, while we have used advanced cortical surface-based analysis to address a gap in current knowledge of early cerebral cortical changes in mTBI survivors, the current study was limited to examining neocortex. Subcortical and archicortical structure were excluded from the current analysis. We plan to examine the structural alterations in other brain structures using different analytical approaches.
Conclusion
Cortical thickness changes detected in the current study suggest that structural cortical alteration may occur at early post-mTBI stages and these cortical changes might be linked to functional outcomes in mTBI survivors. It has been suggested that cortical reactions to mTBI are dynamic over the initial period. We have detected changes in the thickness of the frontal region over time that is consistent with this viewpoint. The specific correlation of thickness in precuneus, the severity of early traumatic stress symptoms, and the number of reduced usual activity days during the initial 3 months suggest possible links between cortical thickness and specific post-mTBI symptomology. The predictive value of early cortical structural findings may ultimately prove to be of clinical usefulness.
The promising results of this pilot study raise many interesting possibilities for future investigations. Additional studies of cortical thickness in larger samples are needed to further examine early cortical alteration after mTBI and its contribution to symptomatology and functional outcomes of mTBI survivors. Quantitative analyses of high-resolution diffusion- or perfusion- and susceptibility-weighted images can explore the mechanisms of structural changes. It is also important to examine the relationship between alterations of cortical thickness and severity of TBI.
Acknowledgment
The work is funded by NIH R21MH098198-01. We thank Dr. Michael M. Dennis, Cindy Grey, Susan Yeager, Lindsey Katschke, Michelle Haunus, and the Department of Radiology at the University of Toledo for technical support, Drs. Joe Migliori, Jr., and Eric Ferguson for clinical support, Dr. John Wall and Ms. Carol Brikmanis, MA, for editing the manuscript, and Karen Brenner, RN, and Rochelle Armola, RN, of ProMedica Health System for survivor recruitment.
Author Disclosure Statement
No competing financial interests exist.
References
- 1.The American Congress of Rehabilitation Medicine (1993). Definition of mild traumatic brain injury. J Head Trauma Rehabil 8, 86–87 [Google Scholar]
- 2.Ruff R.M. (2011). Mild traumatic brain injury and neural recovery: rethinking the debate. NeuroRehabilitation 28, 167–180 [DOI] [PubMed] [Google Scholar]
- 3.Bryant R.A., and Harvey A.G. (1998). Relationship between acute stress disorder and posttraumatic stress disorder following mild traumatic brain injury. Am. J. Psychiatry 155, 625–629 [DOI] [PubMed] [Google Scholar]
- 4.Friedland J.F., and Dawson D.R. (2001). Function after motor vehicle accidents: a prospective study of mild head injury and posttraumatic stress. J. Nerv. Ment. Dis. 189, 426–434 [DOI] [PubMed] [Google Scholar]
- 5.Zhang S.R., Carroll L.J., Cassidy J.D., and Paniak C. (2009). Factors influencing self-rated mild traumatic brain injury. J. Rehabil. Med. 41, 1062–1067 [DOI] [PubMed] [Google Scholar]
- 6.Krainin B.M., Forsten R.D., Kotwal R.S., Lutz R.H., and Guskiewicz K.M. (2011). Mild traumatic brain injury literature review and proposed changes to classification. J. Spec. Oper. Med. 11, 38–47 [DOI] [PubMed] [Google Scholar]
- 7.Belanger H.G., Vanderploeg R.D., Curtiss G., and Warden D.L. (2007). Recent neuroimaging techniques in mild traumatic brain injury. J. Neuropsychiatry Clin. Neurosci. 19, 5–20 [DOI] [PubMed] [Google Scholar]
- 8.Iverson G.L. (2005). Outcome from mild traumatic brain injury. Curr. Opin. Psychiatry 18, 301–317 [DOI] [PubMed] [Google Scholar]
- 9.Baugh C.M., Stamm J.M., Riley D.O., Gavett B.E., Shenton M.E., Lin A., Nowinski C.J., Cantu R.C., McKee A.C., and Stern R.A. (2012). Chronic traumatic encephalopathy: neurodegeneration following repetitive concussive and subconcussive brain trauma. Brain Imaging Behav. 6, 244–254 [DOI] [PubMed] [Google Scholar]
- 10.Gavett B.E., Stern R.A., Cantu R.C., Nowinski C.J., and McKee A.C. (2010). Mild traumatic brain injury: a risk factor for neurodegeneration. Alzheimers Res. Ther. 2, 18. [DOI] [PMC free article] [PubMed] [Google Scholar]
- 11.Shenton M.E., Hamoda H.M., Schneiderman J.S., Bouix S., Pasternak O., Rathi Y., Vu M.A., Purohit M.P., Helmer K., Koerte I., Lin A.P., Westin C.F., Kikinis R., Kubicki M., Stern R.A., and Zafonte R. (2012). A review of magnetic resonance imaging and diffusion tensor imaging findings in mild traumatic brain injury. Brain Imaging Behav 6, 137–192 [DOI] [PMC free article] [PubMed] [Google Scholar]
- 12.Bigler E.D. (2013). Neuroimaging biomarkers in mild traumatic brain injury (mTBI). Neuropsychol. Rev. 23, 169–209 [DOI] [PubMed] [Google Scholar]
- 13.Niogi S.N., and Mukherjee P. (2010). Diffusion tensor imaging of mild traumatic brain injury. J. Head Trauma Rehabil. 25, 241–255 [DOI] [PubMed] [Google Scholar]
- 14.Fox W.C., Park M.S., Belverud S., Klugh A., Rivet D., and Tomlin J.M. (2013). Contemporary imaging of mild TBI: the journey toward diffusion tensor imaging to assess neuronal damage. Neurol. Res. 35, 223–232 [DOI] [PubMed] [Google Scholar]
- 15.Gardner A., Kay-Lambkin F., Stanwell P., Donnelly J., Williams W.H., Hiles A., Schofield P., Levi C., and Jones D.K. (2012). A systematic review of diffusion tensor imaging findings in sports-related concussion. J. Neurotrauma 29, 2521–2538 [DOI] [PubMed] [Google Scholar]
- 16.Ling J.M., Klimaj S., Toulouse T., and Mayer A.R. (2013). A prospective study of gray matter abnormalities in mild traumatic brain injury. Neurology 81, 2121–2127 [DOI] [PMC free article] [PubMed] [Google Scholar]
- 17.Hulkower M.B., Poliak D.B., Rosenbaum S.B., Zimmerman M.E., and Lipton M.L. (2013). A decade of DTI in traumatic brain injury: 10 years and 100 articles later. AJNR Am. J. Neuroradiol. 34, 2064–2074 [DOI] [PMC free article] [PubMed] [Google Scholar]
- 18.Weber J.T. (2007). Experimental models of repetitive brain injuries. Prog. Brain Res. 161, 253–261 [DOI] [PubMed] [Google Scholar]
- 19.Signoretti S., Vagnozzi R., Tavazzi B., and Lazzarino G. (2010). Biochemical and neurochemical sequelae following mild traumatic brain injury: summary of experimental data and clinical implications. Neurosurg. Focus 29, E1. [DOI] [PubMed] [Google Scholar]
- 20.Bigler E.D. (2008). Neuropsychology and clinical neuroscience of persistent post-concussive syndrome. J. Int. Neuropsychol. Soc. 14, 1–22 [DOI] [PubMed] [Google Scholar]
- 21.Lewen A., Fredriksson A., Li G.L., Olsson Y., and Hillered L. (1999). Behavioural and morphological outcome of mild cortical contusion trauma of the rat brain: influence of NMDA-receptor blockade. Acta Neurochir. (Wien) 141, 193–202 [DOI] [PubMed] [Google Scholar]
- 22.Palacios E.M., Sala-Llonch R., Junque C., Fernandez-Espejo D., Roig T., Tormos J.M., Bargallo N., and Vendrell P. (2012). Long-term declarative memory deficits in diffuse TBI: correlations with cortical thickness, white matter integrity and hippocampal volume. Cortex 49, 646–657 [DOI] [PubMed] [Google Scholar]
- 23.Wilde E.A., Merkley T.L., Bigler E.D., Max J.E., Schmidt A.T., Ayoub K.W., McCauley S.R., Hunter J.V., Hanten G., Li X., Chu Z.D., and Levin H.S. (2012). Longitudinal changes in cortical thickness in children after traumatic brain injury and their relation to behavioral regulation and emotional control. Int. J. Dev. Neurosci. 30, 267–276 [DOI] [PMC free article] [PubMed] [Google Scholar]
- 24.Wilde E.A., Newsome M.R., Bigler E.D., Pertab J., Merkley T.L., Hanten G., Scheibel R.S., Li X., Chu Z., Yallampalli R., Hunter J.V., and Levin H.S. (2011). Brain imaging correlates of verbal working memory in children following traumatic brain injury. Int. J. Psychophysiol 82, 86–96 [DOI] [PMC free article] [PubMed] [Google Scholar]
- 25.Tate D.F., York G.E., Reid M.W., Cooper D.B., Jones L., Robin D.A., Kennedy J.E., and Lewis J. (2014). Preliminary findings of cortical thickness abnormalities in blast injured service members and their relationship to clinical findings. Brain Imaging Behav. 8, 102–109 [DOI] [PMC free article] [PubMed] [Google Scholar]
- 26.Zhou Y., Kierans A., Kenul D., Ge Y., Rath J., Reaume J., Grossman R.I., and Lui Y.W. (2013). Mild traumatic brain injury: longitudinal regional brain volume changes. Radiology 267, 880–890 [DOI] [PMC free article] [PubMed] [Google Scholar]
- 27.Rosenbaum S.B., and Lipton M.L. (2012). Embracing chaos: the scope and importance of clinical and pathological heterogeneity in mTBI. Brain Imaging Behav. 6, 255–282 [DOI] [PubMed] [Google Scholar]
- 28.Laker S.R. (2011). Epidemiology of concussion and mild traumatic brain injury. PM R 3, S354–358 [DOI] [PubMed] [Google Scholar]
- 29.Mayou R.A., Black J., and Bryant B. (2000). Unconsciousness, amnesia and psychiatric symptoms following road traffic accident injury. Br. J. Psychiatry 177, 540–545 [DOI] [PubMed] [Google Scholar]
- 30.Yoganandan N., Pintar F.A., Zhang J., and Baisden J.L. (2009). Physical properties of the human head: Mass, center of gravity and moment of inertia. J. Biomech. 42, 1177–1192 [DOI] [PubMed] [Google Scholar]
- 31.Lillie E.M., Urban J.E., Lynch S.K., Whitlow C.T., and Stitzel J.D. (2013). Evaluation of the extent and distribution of diffuse axonal injury from real world motor vehicle crashes—biomed 2013. Biomed. Sci. Instrum. 49, 297–304 [PubMed] [Google Scholar]
- 32.McDonald S.D., and Calhoun P.S. (2010). The diagnostic accuracy of the PTSD checklist: A critical review. Clin. Psychol. Rev. 30, 976–987 [DOI] [PubMed] [Google Scholar]
- 33.Wilkins K.C., Lang A.J., and Norman S.B. (2011). Synthesis of the psychometric properties of the PTSD checklist (PCL) military, civilian, and specific versions. Depress. Anxiety 28, 596–606 [DOI] [PMC free article] [PubMed] [Google Scholar]
- 34.Wang X., Gerken M., Dennis M., Mooney R., Kane J., Khuder S., Xie H., Bauer W., Apkarian A.V., and Wall J. (2010). Profiles of precentral and postcentral cortical mean thicknesses in individual subjects over acute and subacute time-scales. Cereb. Cortex 20, 1513–1522 [DOI] [PMC free article] [PubMed] [Google Scholar]
- 35.Fischl B. (2012). FreeSurfer. Neuroimage 62, 774–781 [DOI] [PMC free article] [PubMed] [Google Scholar]
- 36.Dale W.E., and Blaine E.H. (1999). Effects of enalaprilat on neointimal growth of cultured rabbit aorta following balloon injury. Can. J. Physiol. Pharmacol. 77, 763–769 [PubMed] [Google Scholar]
- 37.Fischl B., and Dale A.M. (2000). Measuring the thickness of the human cerebral cortex from magnetic resonance images. Proceedings of the Natl. Acad. Sci. U.S.A. 97, 11050–11055 [DOI] [PMC free article] [PubMed] [Google Scholar]
- 38.Han X., Jovicich J., Salat D., van der Kouwe A., Quinn B., Czanner S., Busa E., Pacheco J., Albert M., Killiany R., Maguire P., Rosas D., Makris N., Dale A., Dickerson B., and Fischl B. (2006). Reliability of MRI-derived measurements of human cerebral cortical thickness: the effects of field strength, scanner upgrade and manufacturer. Neuroimage 32, 180–194 [DOI] [PubMed] [Google Scholar]
- 39.Wang X., Bauer W., Chiaia N., Dennis M., Gerken M., Hummel J., Kane J., Kenmuir C., Khuder S., Lane R., Mooney R., Bazeley P., Apkarian V., and Wall J. (2008). Longitudinal MRI evaluations of human global cortical thickness over minutes to weeks. Neurosci. Lett. 441, 145–148 [DOI] [PubMed] [Google Scholar]
- 40.Warner M.A., Marquez de la Plata C., Spence J., Wang J.Y., Harper C., Moore C., Devous M., and Diaz-Arrastia R. (2010). Assessing spatial relationships between axonal integrity, regional brain volumes, and neuropsychological outcomes after traumatic axonal injury. J Neurotrauma 27, 2121–2130 [DOI] [PMC free article] [PubMed] [Google Scholar]
- 41.Makris N., Kaiser J., Haselgrove C., Seidman L.J., Biederman J., Boriel D., Valera E.M., Papadimitriou G.A., Fischl B., Caviness V.S., and Kennedy D.N. (2006). Human cerebral cortex: A system for the integration of volume- and surface-based representations. Neuroimage 33, 139–153 [DOI] [PubMed] [Google Scholar]
- 42.Forman S.D., Cohen J.D., Fitzgerald M., Eddy W.F., Mintun M.A., and Noll D.C. (1995). Improved assessment of significant activation in functional magnetic resonance imaging (fMRI): use of a cluster-size threshold. Magn. Res. Med. 33, 636–647 [DOI] [PubMed] [Google Scholar]
- 43.Hagler D.J., Jr., Saygin A.P., and Sereno M.I. (2006). Smoothing and cluster thresholding for cortical surface-based group analysis of fMRI data. Neuroimage 33, 1093–1103 [DOI] [PMC free article] [PubMed] [Google Scholar]
- 44.Hayasaka S., Phan K.L., Liberzon I., Worsley K.J., and Nichols T.E. (2004). Nonstationary cluster-size inference with random field and permutation methods. Neuroimage 22, 676–687 [DOI] [PubMed] [Google Scholar]
- 45.Cruz-Orive L.M., Gelsvartas J., and Roberts N. (2014). Sampling theory and automated simulations for vertical sections, applied to human brain. J. Microsc. 253, 119–150 [DOI] [PubMed] [Google Scholar]
- 46.Sekiguchi A., Sugiura M., Taki Y., Kotozaki Y., Nouchi R., Takeuchi H., Araki T., Hanawa S., Nakagawa S., Miyauchi C.M., Sakuma A., and Kawashima R. (2013). Brain structural changes as vulnerability factors and acquired signs of post-earthquake stress. Mol Psychiatry 18, 618–623 [DOI] [PubMed] [Google Scholar]
- 47.DaSilva A.F., Becerra L., Pendse G., Chizh B., Tully S., and Borsook D. (2008). Colocalized structural and functional changes in the cortex of patients with trigeminal neuropathic pain. PLoS One 3, e3396. [DOI] [PMC free article] [PubMed] [Google Scholar]
- 48.Tate D.F., Shenton M.E. and Bigler E.D. (2012). Introduction to the brain imaging and behavior special issue on neuroimaging findings in mild traumatic brain injury. Brain Imaging Behav. 6, 103–107 [DOI] [PubMed] [Google Scholar]
- 49.Liberzon I., and Martis B. (2006). Neuroimaging studies of emotional responses in PTSD. Ann. N. Y. Acad. Sci. 1071, 87–109 [DOI] [PubMed] [Google Scholar]
- 50.Ramnani N., and Owen A.M. (2004). Anterior prefrontal cortex: insights into function from anatomy and neuroimaging. Nat. Rev. Neurosci. 5, 184–194 [DOI] [PubMed] [Google Scholar]
- 51.McAllister T.W., Sparling M.B., Flashman L.A., Guerin S.J., Mamourian A.C., and Saykin A.J. (2001). Differential working memory load effects after mild traumatic brain injury. Neuroimage 14, 1004–1012 [DOI] [PubMed] [Google Scholar]
- 52.Lindemer E.R., Salat D.H., Leritz E.C., McGlinchey R.E., and Milberg W.P. (2013). Reduced cortical thickness with increased lifetime burden of PTSD in OEF/OIF Veterans and the impact of comorbid TBI. Neuroimage Clin. 2, 601–611 [DOI] [PMC free article] [PubMed] [Google Scholar]
- 53.Read K.M., Kufera J.A., Dischinger P.C., Kerns T.J., Ho S.M., Burgess A.R., and Burch C.A. (2004). Life-altering outcomes after lower extremity injury sustained in motor vehicle crashes. J. Trauma 57, 815–823 [DOI] [PubMed] [Google Scholar]
- 54.Cavanna A.E., and Trimble M.R. (2006). The precuneus: a review of its functional anatomy and behavioural correlates. Brain 129, 564–583 [DOI] [PubMed] [Google Scholar]
- 55.Urban J.E., Whitlow C.T., Edgerton C.A., Powers A.K., Maldjian J.A., and Stitzel J.D. (2012). Motor vehicle crash-related subdural hematoma from real-world head impact data. J. Neurotrauma 29, 2774–2781 [DOI] [PMC free article] [PubMed] [Google Scholar]
- 56.Barkhoudarian G., Hovda D.A., and Giza C.C. (2011). The molecular pathophysiology of concussive brain injury. Clin. Sports Med. 30, 33–48 [DOI] [PubMed] [Google Scholar]
- 57.Iadecola C., Arneric S.P., and Reis D.J. (1989). Local and remote microvascular changes in excitotoxin-induced focal brain lesions. Brain Res. 501, 188–193 [DOI] [PubMed] [Google Scholar]
- 58.Kan E.M., Ling E.A., and Lu J. (2012). Microenvironment changes in mild traumatic brain injury. Brain Res. Bull. 87, 359–372 [DOI] [PubMed] [Google Scholar]
- 59.Patterson Z.R., and Holahan M.R. (2012). Understanding the neuroinflammatory response following concussion to develop treatment strategies. Front. Cell Neurosci. 6, 58. [DOI] [PMC free article] [PubMed] [Google Scholar]
- 60.Vorobyev V.A., Alho K., Medvedev S.V., Pakhomov S.V., Roudas M.S., Rutkovskaya J.M., Tervaniemi M., van Zuijen T.L., and Näätänen R. (2004). Linguistic processing in visual and modality-nonspecific brain areas: PET recordings during selective attention. Brain Res. Cogn. Brain Res. 20, 309–322 [DOI] [PubMed] [Google Scholar]
- 61.Friedman L., Kenny J.T., Wise A.L., Wu D., Stuve T.A., Miller D.A., Jesberger J.A., and Lewin J.S. (1998). Brain activation during silent word generation evaluated with functional MRI. Brain Lang. 64, 231–256 [DOI] [PubMed] [Google Scholar]
- 62.Goel V. (2007). Anatomy of deductive reasoning. Trends Cogn. Sci. 11, 435–441 [DOI] [PubMed] [Google Scholar]
- 63.Carlo C.N., and Stevens C.F. (2013). Structural uniformity of neocortex, revisited. Proc. Natl. Acad. Sci. U. S. A. 110, 1488–1493 [DOI] [PMC free article] [PubMed] [Google Scholar]
- 64.Gao X. and Chen J. (2011). Mild traumatic brain injury results in extensive neuronal degeneration in the cerebral cortex. J. Neuropathol. Exp. Neurol. 70, 183–191 [DOI] [PMC free article] [PubMed] [Google Scholar]
- 65.Tsai P.S., Kaufhold J.P., Blinder P., Friedman B., Drew P.J., Karten H.J., Lyden P.D., and Kleinfeld D. (2009). Correlations of neuronal and microvascular densities in murine cortex revealed by direct counting and colocalization of nuclei and vessels. J. Neurosci. 29, 14553–14570 [DOI] [PMC free article] [PubMed] [Google Scholar]
- 66.Maugans T.A., Farley C., Altaye M., Leach J., and Cecil K.M. (2012). Pediatric sports-related concussion produces cerebral blood flow alterations. Pediatrics 129, 28–37 [DOI] [PMC free article] [PubMed] [Google Scholar]
- 67.Len T.K., and Neary J.P. (2010). Cerebrovascular pathophysiology following mild traumatic brain injury. Clin. Physiol. Funct. Imaging 31, 85–93 [DOI] [PubMed] [Google Scholar]
- 68.Abu-Judeh H.H., Parker R., Aleksic S., Singh M.L., Naddaf S., Atay S., Kumar M., Omar W., El-Zeftawy H., Luo J.Q., and Abdel-Dayem H.M. (2000). SPECT brain perfusion findings in mild or moderate traumatic brain injury. Nucl. Med. Rev. Cent. East. Eur. 3, 5–11 [PubMed] [Google Scholar]
- 69.Park E., Bell J.D., Siddiq I.P., and Baker A.J. (2009). An analysis of regional microvascular loss and recovery following two grades of fluid percussion trauma: a role for hypoxia-inducible factors in traumatic brain injury. J. Cereb. Blood Flow Metab. 29, 575–584 [DOI] [PubMed] [Google Scholar]
- 70.Caner B., Hou J., Altay O., Fujii M., and Zhang J.H. (2012). Transition of research focus from vasospasm to early brain injury after subarachnoid hemorrhage. J. Neurochem. 123, Suppl 2, 12–21 [DOI] [PubMed] [Google Scholar]
- 71.Bederson J.B., Levy A.L., Ding W.H., Kahn R., DiPerna C.A., Jenkins A.L., 3rd, and Vallabhajosyula P. (1998). Acute vasoconstriction after subarachnoid hemorrhage. Neurosurgery 42, 352–362 [DOI] [PubMed] [Google Scholar]
- 72.Tuor U.I., Hudzik T.J., Malisza K., Sydserff S., Kozlowski P., and Del Bigio M.R. (2001). Long-term deficits following cerebral hypoxia-ischemia in four-week-old rats: correspondence between behavioral, histological, and magnetic resonance imaging assessments. Exp. Neurol. 167, 272–281 [DOI] [PubMed] [Google Scholar]