

Abstract
Introduction
Trial design for SMA depends on meaningful rating scales to assess outcomes. In this study Rasch methodology was applied to 9 motor scales in spinal muscular atrophy (SMA).
Methods
Data from all 3 SMA types were provided by research groups for 9 commonly used scales. Rasch methodology assessed the ordering of response option thresholds, tests of fit, spread of item locations, residual correlations, and person separation index.
Results
Each scale had good reliability. However, several issues impacting scale validity were identified, including the extent that items defined clinically meaningful constructs and how well each scale measured performance across the SMA spectrum.
Conclusions
The sensitivity and potential utility of each SMA scale as outcome measures for trials could be improved by establishing clear definitions of what is measured, reconsidering items that misfit and items whose response categories have reversed thresholds, and adding new items at the extremes of scale ranges.
Keywords: clinical trials, motor neuron disease, outcome measures, Rasch analysis, spinal muscular atrophy
Spinal muscular atrophy (SMA) is a rare1 inherited neuromuscular condition characterized by degeneration of spinal and bulbar anterior horn cells with resulting muscle weakness and atrophy2; it is commonly classified into 1 of 3 categories.3 Over the past 15 years increased understanding of the molecular genetics and pathophysiology of SMA has provided a platform for therapeutics development and new promising clinical trials4–6 whose efficacy is ultimately judged by outcome measures. Functional rating scales are being used increasingly in this important role,7–9 and it is therefore essential that they provide clinically meaningful and scientifically robust data. These issues highlight the key role for psychometric methodologies in scale development and testing.10 Many rating scales have been used as outcome measures in SMA natural history studies and clinical trials. Collectively the scales are designed to capture disease progression due to muscle weakness in the upper and lower extremities and the trunk that are the clinical hallmarks of the disease. In capturing aspects of underlying weakness, the various movement and functional measures have been shown to document change over time11 and are further expected to reflect any changes that might result from treatment interventions that may range from slowing of disease progression to functional improvement.
The most commonly used motor performance scales include: Hammersmith Functional Motor Scale (HMFS),12,13 the Expanded HFMS (HFMSE),14 Modified Hammersmith Functional Motor Scale Extend (MHMS-Extend),15,16 Motor Function Measure (MFM),17 Gross Motor Function Measure (GMFM),18,19 North Star Ambulatory Assessment for SMA (NSAA-SMA),20,21 Egen Klassifikation Scale v.2 (EK2),22 Children’s Hospital of Philadelphia Test of Neuromuscular Disorders (CHOP-INTEND),23,24 and Test of Infant Motor Performance Screening Items (TIMPSI).25 A summary of the scales is listed in Table 1. Although these scales have undergone varying degrees of traditional psychometric testing,12,13,15,17,20–23,26–29 they have not been evaluated with Rasch measurement methods in SMA.30 The Rasch Measurement Model (RMM) is a mathematical model that is used to verify whether or not adding scores from ordinal scale measurements (such as the Hammersmith Functional Motor Scale) is justified by the data and also allows conversion of ordinal level data to interval level data, allowing subjects to be placed along an interval continuum of ability. Rasch analysis has the potential to test for and provide evidence to help advance the scientific merit of commonly used outcome measures. It has been applied successfully to outcome measures in several neurological disorders, including cervical dystonia, Friedreich ataxia, and multiple sclerosis.31–33 The analysis itself is based on the requirements that: (1) more able individuals will perform better on more test items; (2) fewer individuals will be able to perform well on more difficult, challenging test items; and (3) responses to items of a scale clearly represent different amounts of a single skill or attribute.
Table 1.
Summary of analyzed scales.
| Scale | Abbreviation | Summary details of scale | Traditional reliability tests performed specific to use in SMA? |
|---|---|---|---|
| Children’s Hospital of Philadelphia Test of Neuromuscular Disorders23,24 | CHOP-INTEND | Designed for use in young children with severe forms of NMD. 16 items observe spontaneous movements and elicited reactions. http://ebookbrowse.com/chop-intend-for-sma-type-i-manual-of-procedures-pdf-d87663908 | Y |
| Egen Klassifikation Scale v.222 | EK2 | Mainly question-based scale of 17 items relating to an individual’s “own functioning” in the home. | Y |
| Gross Motor Function Measure18,19 | GMFM | Originally developed for use in cerebral palsy. Contains 88 items and 5 dimensions of lying and rolling, sitting, crawling and kneeling, standing and walking, running and jumping. http://motorgrowth.canchild.ca/en/gmfm/resources/gmfmscoresheet.pdf | Y |
| Hammersmith Functional Motor Scale12,13 | HFMS | Developed for use specifically in non-ambulant SMA. 20 items including lying, rolling, sitting, and into standing and stepping. | Y |
| Expanded Hammersmith Functional Motor Scale14 | HFMSE | An expanded version of the HFMS with additional items particularly aimed at ambulant individuals (additional 13 items) | Y |
| Motor Function Measure17 | MFM | A 32 item scale with 3 dimensions, D1 (standing and transfers), D2 (axial and proximal motor function), and D3 (distal motor function). It was designed to be suitable for all neuromuscular conditions, not just SMA. http://www.mfm-nmd.org/home.aspx | N |
| Modified Hammersmith Functional Motor Scale Extend15,16 | MHFMS-Extend | Modified version of the HFMS, with defined scoring, a change in the testing order, and an extended module (8 additional items) which allows assessment of individuals with SMA who are non-ambulant as well as ambulant. http://smaoutcomes.org/hammersmith_manual/manual_1.html | Y |
| North Star Ambulatory Assessment for SMA20,21 | NSAA for SMA | The original 17 item scale was designed for use in ambulant DMD and adapted for use in SMA. It includes items such as stepping on and off a box, jumping and hopping. | N |
| Test of Infant Motor Performance Screening Items25 | TIMPSI | Designed originally for assessing infants at risk from developmental delay. This 29 item scale has been used subsequently for assessment of severely affected SMA individuals. | N (Y) |
Rasch measurement methods are based on Rasch measurement theory34 and are used to examine the extent to which the observed rating scale data (in this instance clinicians’ ratings on scale items) “fit” with predictions of those ratings from the Rasch model (which defines how a set of items should perform to generate reliable and valid measurements).35 Effectively, the difference between expected (as predicted by the model) and observed scores indicates the degree to which valid measurement is achieved. In contrast to traditional psychometric methods, Rasch measurement methods are better able to: identify the strengths and weaknesses of rating scales9 while at the same time ensuring that scales fulfill currently mandated traditional psychometric criteria36; provide data that are more clinically interpretable37; and provide detailed evidence-based recommendations for scale improvement.10 Importantly, the use of Rasch measurement methods is supported by regulatory bodies such as the Food and Drug Administration (FDA).38 Further details on this methodology are described elsewhere.10,30,39
This article summarizes work carried out by a Task Force of the International Coordinating Committee for SMA Clinical Trials (ICC) that resulted in a summary meeting held in May 2011. The ICC and Rasch Task Force are made up of an international group of investigators who work together to address clinical trial issues in the SMA community including reaching expert consensus on the use and utility of functional rating scales measures and study endpoints suitable for use in pivotal efficacy studies.40 The Rasch Task Force included representatives of all the study groups involved in developing the most widely used functional rating scales in SMA (see Acknowledgements). Over the past 20 years, despite the rarity of this condition these groups have amassed collectively sufficient data to facilitate a detailed psychometric analysis of each scale. The focus of this study was to use the benefits of Rasch measurement methods to gain a better understanding of the psychometric strengths and weaknesses of current SMA motor performance rating scales with a goal of making recommendations for future development and improvement for use as clinical trial outcome measures.
METHODS
Participants, Recruitment, Data Collection, and Scales
Datasets from children and adults with SMA types 1, 2, and 3 were made available from research groups representing each of the rating scales to be analyzed. Details are listed in Table 2 (additional information on patient characteristics of the scales is available in Supplementary Table S1, which is available online). A request to use these datasets was supported and organized by the ICC for SMA Clinical Trials. All data were provided in de-identified format consistent with the original data collection IRB approvals obtained by the research groups. The goal was to achieve sample sizes for each dataset above the recommended figure for item analysis (n > 300).41 Nine motor performance rating scales were selected for analysis (Table 2).
Table 2.
Sample size of dataset made available for each scale.
| Abbreviation | Study Group | Sample size (person measurements) | SMA Type |
|---|---|---|---|
| CHOP-INTEND | PNCRN* | 132 | 1, 2 |
| EK2 | Danish Muscle Group, Italian SMA Group, UK Smartnet, PNCRN | 154 | 1, 2, 3 |
| GMFM | AmSMART PNCRN | 554 | 1, 2, 3 |
| HFMS | Italian SMA Group, Hammersmith Clinic/SMAF | 390 | 2, non-ambulant 3 |
| HFMSE | PNCRN | 579 | 1, 2, 3 |
| MFM | MFM Study Group | 143 | 1, 2, 3 |
| MHFMS | Project Cure, SMAF- BforSMA Study | 401 | 2, 3 |
| NSAA for SMA | Smartnet – Part of North Star Clinical Network, UK | 48 | 3 |
| TIMPSI | Project Cure | 83 | 1 |
PNCRN, Pediatric Neuromuscular Clinical Research Network for SMA.
Rasch Measurement Methods
The data were analyzed using RUMM2030,42 which is a Microsoft Windows-based psychometric item analysis software package. It includes the Rasch measurement algorithms and tests developed by Georg Rasch35 and David Andrich, the developers of Rasch measurement theory.30,43–46 Five key tests for reliable and valid measurement were assessed in this analysis, including fit, targeting, dependency, reliability, and stability.
Fit
The individual items in any motor performance scale must work together (i.e., fit) as a conformable set, both clinically and statistically. Otherwise, it is inappropriate to sum item responses to reach a total score and consider the total score as an overall measure of motor performance. When items do not work together (i.e. misfit) in this way, the validity of a scale is uncertain. For example an item reporting fatigue does not fit the construct of motor performance. In brief, for this analysis, evidence for item fit was based on 4 different indicators. These included ordering of item response options, ordering of item thresholds,47 2 statistical indicators (fit residual; χ square), and 1 graphical indicator (item characteristic curve; Item CC48).
Targeting
Scale-to-sample targeting refers to the match between the range of motor performance measured by each of the 9 scales and the range of motor abilities in the sample of patients in each dataset. This analysis involves examination of the spread of person (individuals who performed the scale) and item locations in these 2 relative distributions. This analysis indicates how suitable the patient sample is for evaluating the scales and how suitable the scales are for measuring their respective samples. Better targeting equates to a better ability to interpret the psychometric data with confidence.48
Dependency
Dependency refers to the degree to which the response to any of the items in each of scale are directly influenced by the response to any other item in the same scale.49 For example, the scores for rolling to the right and left may be strongly associated. If this occurs, measurement estimates may be biased, and reliability may be elevated artificially. Rasch measurement methods determine this effect by examining residual correlations.
Reliability
Reliability refers to the extent to which scale scores are not associated with random error. This was assessed using the Person Separation Index (PSI),44 comparable to the Cronbach α.50
Stability
It is important that the items of each scale perform in a similar way across subgroups of children that could be compared (e.g., gender, different age ranges). The degree to which item performance remains stable across subgroups is known as differential item functioning. For this analysis, we tested SMA type, age, and study group.
RESULTS
Datasets
Scales were analyzed in datasets that included SMA Types 1, 2, and 3, except: TIMPSI (Type 1); NSAA for SMA (Type 3); CHOP-INTEND (Types 1 and 2); and HFMS, MHFMS (Types 2 and 3). The CHOP-INTEND, EK2, MFM, NSAA, and TIMPSI included datasets of n < 300, which is less than ideal.41 Therefore, the findings of the analyses should be interpreted with this in mind. However, analysis on smaller subsets can provide useful exploratory information and can direct future research and scale development.
Findings from Rasch Analysis
Given the very large amount of data produced by each of the rating scales, the data are presented as an overall summary of the findings, with additional illustrative examples of some of the key findings. Supplementary Table S2 includes a summary of the findings for the 9 rating scales. All Rasch data pertaining to the scales is available from the authors; data for each individual scale is available from the contributing research group. Readers interested in further information related to the specific findings should contact the corresponding author (J.T.K.; Chair of the ICC Rasch Task Force).
Fit
All of the 9 rating scales were found to have problems with fit. Thus, between 12% (NSAA) and 88% (GMFM) of items were found to have reversed thresholds, meaning that their response categories are not working as intended (see the Discussion section for further elaboration). All of the scales except the CHOP-INTEND showed problems with fit residuals and χ2 tests. For example, approximately one-third of the HFMS items had fit residuals outside 22.5/12.5, and approximately onethird of the HFMSE items had χ2 probabilities >0.001 (Supplementary Table S2). This suggests that these items do not fit ideally with the intended construct of the scale. This could be because the scale is multidimensional (i.e., not measuring 1 domain such as ambulatory function).
Targeting
The TIMPSI, CHOP-INTEND, HFMSE, and MHFMS-Extend showed adequate scale targeting to the samples under study. This indicates that the range of items covered the range of motor performance ability seen in the associated patient samples. The remaining scales were not as well targeted to their respective study samples (see Tables 1 and 2). As such, the EK2, GMFM, and HFMS are better targeted to less impacted children, and the MFM and NSAA are better targeted to more impacted children (Fig. 1). This must be considered in the context of a scale’s original target group.
FIGURE 1.
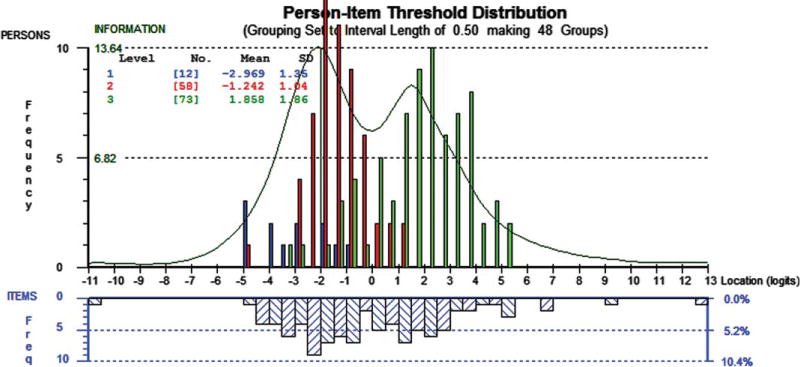
Motor Function Measure (MFM), Person-Item thresholds distribution. The upper histogram represents the sample distribution of total MFM person measures for spinal muscular atrophy (SMA) type 1 (blue), SMA type 2 (red), and SMA type 3 (Green). The lower histogram blue-striped blocks represent the sample distribution of the item thresholds of the 32-items of the MFM. The green line shows the information function. The graph shows that the distributions of item thresholds and person measures are reasonably matched. There are a few areas where there are gaps on the item threshold continuum, which impacts precision, and other places where item threshold locations are close, which indicates potential redundancy. Although the bimodal distribution indicates 2 areas of optimal measurement (at the peaks), the highest peak of the information plot is around −22.0 logits of the continuum. This suggests that the scale is probably better targeted for patients at the more impacted end of the continuum, for children with SMA Type 1 or Type 2.
Dependency
A proportion of the items, in all except 2 of the scales (EK2; see Supplementary Table S2), showed some local dependency between pairs of items. This suggests that the response to 1 or either of the items in the pair is influenced directly by the others. This ranged between 1 pair (CHOP-INTEND) to 61 pairs of items (GMFM) showing pairs of items with residual correlations >0.40. For example, the dependency shown by the residual correlation (r = 0.69) between the GMFM “walks 10 steps supported” and “walks 10 steps independently” indicates the response pattern to the latter item is influenced by the former. High levels of dependency can artificially inflate reliability.
Reliability
All scales showed adequate reliability with PSI > 0.83 within the context of local dependency issues.
Stability
All scales tested for stability except the TIMPSI were found to have differential item functioning (DIF), suggesting patterns of responses which differ systematically between different groups to differing degrees. The scales most affected were the MHFMS Extend (DIF by SMA type for 43% of items), HFMSE (DIF by age for 55% of items), and the HFMS (DIF by study group for 25% of items).
DISCUSSION
The 9 scales examined in this study are all invaluable as clinical assessment tools. However, to be considered appropriate measurement instruments for clinical trials, a series of psychometric criteria must be met. In this study, Rasch measurement methods allowed us to gain a detailed level of understanding of the measurement performance of the items of each rating scale and to move toward standards set by regulatory authorities. The analysis revealed psychometric strengths and weaknesses for all of the scales. All of the scales demonstrated adequate reliability (which may be influenced by dependency), but there were validity-related problems with the extent to which some items in each of the scales measure adequately motor performance in children with different levels of SMA. In this regard, for a proportion of the items in all of the scales, there was a problem with ordering of response categories, suggesting that for these items the scoring function does not work as intended in children with SMA.
For example, for item 2 of the GMFM (“Hands to midline”), one would expect that a child who has mild motor performance problems as measured by the overall GMFM would, probabilistically-speaking, score a 3 (“completes” task), while a child with more severe involvement would score lower. Thus, a child with moderate problems would probably score a 1 (“initiates” task) or a 2 (“partially completes” task), and a severely affected child would probably score 0 (“does not initiate” task). However, Rasch analysis showed that this was not the case for this and many other items in the GMFM, and there were similar problems in each of the other scales. This reversal of response option ordering, known as disordered thresholds, may have occurred for several reasons, including the fact that there may have been too many response options for evaluators.10 Another possibility is that there may be something specific about the way clinicians interpret and score the children using the scale categories that does not fit within the frame of reference of the scales. Thus, for the GMFM in the above example, there is a consistent problem in the way the “partially completes” and “completes” categories were scored. Although the analyses do not reveal the precise cause, this is important, as ordered thresholds are fundamentally important for establishing scale validity.10,43,51
Reversed thresholds can also contribute to item misfit, another problematic feature identified in many of the scales. However, item misfit may have also arisen directly from the scale content. Of necessity, measuring motor performance covers a wide range of clinical presentation and muscle weakness, so that some of the scales may include items that are tapping into different constructs. For example, the HFMSE includes items that include head movement tasks (item 17, supine lifts head), upper limb tasks (e.g., item 4, 2 hands to head) and lower limb tasks (e.g., item 32, up stairs no rail). This issue, known as multidimensionality,52 is potentially problematic, as the different sets of items represent different types of variables with different roles.53 A useful analogy is the comparison of height and weight. Although we would expect height and weight to be correlated, the combination of these measures to form a “total score” would probably be neither helpful nor meaningful. In the same way, although one would expect the items of the HFMSE to be correlated, given their relationship in SMA as affecting the whole body, combining them into a total score will confound measurement and makes interpretation difficult.53 Adding together items from related but potentially different constructs could contribute to disordered thresholds, lending further support to the idea that this may be a significant measurement issue affecting the internal validity of scales.54
The dependency issue, revealed by the high residual correlations between items, is a further indication that more attention is required in relation to scale content. The problem with item dependency is that it inflates artificially the reliability of rating scales (as measured by PSI value), and therefore in measurement terms, makes a scale look better than it actually is. One could argue that some degree of item dependency might be expected for these 9 rating scales, because many needed to include tasks assessed bilaterally so that clinically significant variations could be addressed therapeutically (e.g., development or worsening of contractures). For example, the HFMS includes items that relate to rolling prone to supine on the left and right sides (items 6 and 7, respectively), and the NSAA includes items that ask about standing on the right and left legs (items 3 and 4, respectively), activities where dependency might be expected. These important issues need to be taken into consideration in the event that subsequent attempts to improve scale content are undertaken. This does not mean that items must be deleted from a scale in the future, but they may be excluded from a transformed measure or considered as a sub test.
DIF is a key issue in Rasch analysis.55 The Rasch model is based on the requirement of invariance (stability).37 This does not mean that examining data with the Rasch model automatically produces stable results. It means that, with the Rasch model, we are able to test if the items of our scales are stable across the trait they measure and the clinically different groups in which they are used. All of the scales assessed in this study exhibited DIF to a certain degree across SMA categories. This suggests there is a degree of instability of scale scores generated in the different groups of patients. The clinical implication is that measurement is affected to an unknown degree, and the direct comparability of scores between groups is uncertain. Once again these are pertinent issues that need to be taken into consideration when considering potential scale improvements. We would stress that, while ensuring scale stability is important, other issues relating to scale sufficiency, such as correctly ordered thresholds, should be corrected first.”
Supplementary Table S2 also reports findings related to scale stability over type of SMA, age, and group. Although ensuring scale stability is important, other issues related to scale sufficiency, such as correctly ordered thresholds, must be corrected first.
The final key findings related to targeting issues were identified for some of the scales. The EK2 (nonambulant), HFMS (nonambulant), and GMFM (nonambulant and ambulant) were found to be better targeted to less affected children within the context of their target population, and the MFM (nonambulant and ambulant) and NSAA (ambulant) were better targeted for more affected children within the context of their targeted populations. This suggests that the match between the range of motor performance measured by these scales and the range of motor performance measured in these samples is suboptimal. This increases the error around the measurements of individuals, reduces the ability of the scales to discriminate accurately between different levels of motor performance, and limits the ability to detect change over time as the disease progresses. This finding further indicates that additional consideration is needed for scale content and its defined purpose within a clinical trial. One potential consideration is to increase the measurement range of these scales by including additional items that better capture the range of problems for each SMA type. This is especially important when considering appropriate measurement precision across the whole of scales to adequately capture clinical change when it occurs.
The results lead to 3 main recommendations related to the potential next steps for further psychometric research on SMA scales. First, the content of each scale should be reviewed and modified in terms of misfitting items and item response categories with reversed thresholds. Second, most of the scales would benefit from an expert review of items that appear dependent on each other. Third, the content of the EK2, GMFM, HFMS, MFM, and NSAA should be reviewed, and additional items should be considered for people in the more/less affected range of SMA. A reasonable first step in further analyses of prospective datasets is a post hoc analysis of existing data, in which item response options can be changed and items removed or added. This is possible with the RUMM2030 software used in this study, and just such an analysis is planned. Findings from this analysis however should only be used to guide the next step, because any proposed alterations to scales would necessitate the need for further psychometric validation studies to assess the impact of the changes, either through natural history studies or baseline trial data.
Another important step that would strengthen the outcome scale would be to review explicit construct definitions of exactly what is being measured by each scale. This additional substantive information would make scale data more interpretable clinically.53 In fact, a clear understanding of the substantive theory underpinning rating scales is central to valid measurement,53,56,57 a fact now recognized and stressed by regulatory bodies such as the FDA.7,9,38,58 We are not suggesting that any of the scales in this study are clinically meaningless. Quite the contrary; there is little doubt that each has been constructed carefully to provide valuable information that can be used for clinical assessment. However, our focus here is on measurement as opposed to other more evaluative uses of rating scales. These have different requirements. Thus, measurement has a very specific meaning with respect to quantifying clinical attributes (i.e., a quality, characteristic, or property belonging to a person). In contrast, the use of scales as clinical assessment tools is often a qualitative, information sharing process. When a rating scale is used as an outcome measure, it is being used as a measuring instrument. This has implications both clinically and psychometrically. We discuss these issues more fully elsewhere.11
Construct definitions are elaborated as construct theories which, simply stated, are “the story we tell about what it means to move up and down the scale for a variable of interest” (e.g., temperature, reading ability, short-term memory). Why is it, for example, that items are ordered as they are on the item map? Does the ordering match clinical expert opinion?59 The development of such theories should include evaluations of the extent to which the items of each of the scales mark out the construct (i.e., motor performance) to be measured, establishing the most appropriate item wording, structuring the scoring accurately, and conducting qualitative cognitive debriefing interviews to ensure consistency in meaning. Thus, how each of the scales capture motor performance in SMA in terms of ambulatory performance, standing, and transfers, and nonambulatory performance including sitting and lying or upper limb and distal performance, needs to be clarified explicitly. An exciting potential outcome from this process is that it provides a platform to compare the conceptual frameworks of each of the 9 rating scales, a process that in turn could lead to a clinical item bank60 which has the potential to unify outcome measures across SMA clinical trials. Such an item banking approach, combining Rasch measurement theory with detailed construct theory, has proven to be extremely successful in other areas of human sciences.59,61
This study has 2 main limitations. First, the datasets provided for the CHOP-INTEND, EK2, MFM, NSAA, and TIMPSI were smaller than the widely recommended n > 300. Therefore, to confirm their psychometric properties, these scales require further evaluations in larger datasets. Second, validity testing for all scales was limited in the extent to which construct validity could be assessed, especially in the comparison between different scales. Further examinations would be beneficial and would require additional data points (assessments).
These findings have important implications for the results of SMA clinical trials and research, and have fundamental implications for the development of better outcome measures from rating scales currently used in SMA. Rasch measurement methods add sophistication to traditional psychometric methods, providing detailed diagnostic item-level data. By highlighting and elaborating the key problems of the items of the 9 motor performance rating scales, these analyses provide an initial evidence base for future research to improve these scales. In addition, building detailed construct theories and allowing for comparisons across each of the rating scales provides a unique opportunity to bring together the scales in the form of an item bank that will add precision, reduce patient and clinician burden, and give clinical researchers a common metric to compare and contrast the outcomes of new therapeutic trials. Clinical trials under development using current scales can benefit from this overarching technique by relating raw scores collected on current scales to the metric of measures developed in the future by combining items and scales.
Supplementary Material
Acknowledgments
This project is supported by the Patient Advocacy Group of the International Coordinating Committee for SMA Clinical Trials including Families of SMA, Fight SMA, Muscular Dystrophy Association, the SMA Foundation, and SMA Europe. Dr. Mayhew’s salary is supported by TREAT -NMD. The Members of the International Coordinating Committee for SMA Clinical Trials Rasch Task Force are: John Kissel (Ohio State University), Bakri Elsheikh (Ohio State University), Julaine Florence (Washington University, St. Louis); Allan M. Glanzman (The Children’s Hospital of Philadelphia); Linda Hynan (UT Southwestern); Susan Iannaccone (UT Southwestern); Cynthia Joyce (SMA Foundation); Kristin Krosschell (Northwestern University); Anna Mayhew (University of Newcastle, UK); Eugenio Mercuri (Catholic University, Rome); Shree Pandya (University of Rochester); Christine Payan (Institut de Myologie, Paris, France); Carole Bérard, Françoise Girardot (Hôpital Femme Mère Enfants, Lyon, France); Michael Rose (Kings College, UK); Chuck Scott (Project Cure); Reza Sadjadi (British Columbia Hospital); Stefan Cano (Peninsula College of Medicine and Dentistry, UK). We thank all of the study groups involved in this endeavor: The Pediatric Neuromuscular Clinical Research Network for SMA, The SMA Foundation, Danish Muscle Group, Italian SMA Group, UK Smartnet, AmSMART, Hammersmith Clinic/SMAF, Project Cure, MFM Study Group, TREAT NMD. Finally, we thank all of the SMA patients involved in this study and their families.
Abbreviations
- AmSMART
American SMA Randomized Trial group
- CHOP-INTEND
Children’s Hospital of Philadelphia test of neuromuscular disorders
- DIF
differential item functioning
- EK2
Egen Klassifikation Scale v.2
- FDA
Food and Drug Administration
- FitRes
fit residual
- GMFM
gross motor function measure
- HMFS
Hammersmith Functional Motor Scale
- HFMSE
Expanded Hammersmith Functional Motor scale
- ICC
International Coordinating Committee for SMA Clinical Trials
- MHFMS
Extend, Modified Hammersmith Functional Motor Scale Extend
- MFM
Motor Function Measure
- NSAA-SMA
North Star Ambulatory Assessment for SMA
- PNCRN
Pediatric Neuromuscular Clinical Research Network for SMA
- PSI
Person Separation Index
- RMM
Rasch Measurement Model
- SMA
spinal muscular atrophy
- SMAF
SMA Foundation
- SMN
Survival Motor Neuron
- TIMPSI
Test of Infant Motor Performance Screening Items
- TREAT-NMD
Translational Research in Europe – Assessment and Treatment of Neuromuscular Diseases
Footnotes
Additional supporting information may be found in the online version of this article.
References
- 1.Sugarman E, Nagan N, Zhu H, Akmaev VR, Zhou Z, et al. Pan-ethnic carrier screening and prenatal diagnosis for spinal muscular atrophy: clinical laboratory analysis of > 72,400 specimens. Eur J Hum Genet. 2012;20:27–32. doi: 10.1038/ejhg.2011.134. [DOI] [PMC free article] [PubMed] [Google Scholar]
- 2.Monani U. Spinal muscular atrophy: a deficiency in a ubiquitous protein; a motor neuron-specific disease. Neuron. 2005;48:885–896. doi: 10.1016/j.neuron.2005.12.001. [DOI] [PubMed] [Google Scholar]
- 3.Zerres K, Rudnick-Schoneborn S. Natural history in proximal spinal muscular atrophy. Arch Neurol. 1995;52:518–523. doi: 10.1001/archneur.1995.00540290108025. [DOI] [PubMed] [Google Scholar]
- 4.Bosboom W, Vrancken A, van den Berg L, Wokke J, Iannaccone S. Drug treatment for spinal muscular atrophy Type I. Cochrane Database Syst Rev. 2009;1:1–17. doi: 10.1002/14651858.CD006281.pub2. [DOI] [PubMed] [Google Scholar]
- 5.Bosboom W, Vrancken A, van den Berg L, Wokke J, Iannaccone S. Drug treatment for spinal muscular atrophy types II and III. Cochrane Database Syst Rev. 2009;1:1–34. doi: 10.1002/14651858.CD006282.pub2. [DOI] [PubMed] [Google Scholar]
- 6.Kolb S, Kissel J. Spinal muscular atrophy: a timely review. Arch Neurol. 2011;68:979–984. doi: 10.1001/archneurol.2011.74. [DOI] [PMC free article] [PubMed] [Google Scholar]
- 7.Food and Drug Administration. Patient reported outcome measures: use in medical product development to support labelling claims [online] Available at: http://www.fda.gov/downloads/Drugs/Guidances/UCM193282.pdf.
- 8.Food and Drug Administration. Qualification process for drug development tools [online] Available at: www.fda.gov/cber/gdlns/prolbl.pdf. http://www.fda.gov/downloads/Drugs/GuidanceComplianceRegulatoryInformation/Guidances/UCM193282.pdf.
- 9.Hobart J, Cano S, Zajicek J, Thompson A. Rating scales as outcome measures for clinical trials in neurology: problems, solutions, and recommendations. Lancet Neurol. 2007;6:1094–1105. doi: 10.1016/S1474-4422(07)70290-9. [DOI] [PubMed] [Google Scholar]
- 10.Hobart J, Cano S. Improving the evaluation of therapeutic intervention in MS: the role of new psychometric methods. Monograph for the UK Health Technology Assessment Programme. 2009;13:1–200. doi: 10.3310/hta13120. [DOI] [PubMed] [Google Scholar]
- 11.Kaufmann P, McDermott M, Darras B, Finkel R, et al. Prospective cohort study of spinal muscular atrophy type II and III. Neurology. 2012;79(18):1889–1897. doi: 10.1212/WNL.0b013e318271f7e4. [DOI] [PMC free article] [PubMed] [Google Scholar]
- 12.Main M, Kairon H, Mercuri E, Muntoni F. The Hammersmith Functional Motor Scale for Children with spinal muscular atrophy: a scale to test ability and monitor progress in children with limited ambulation. Eur J Paediatr Neurol. 2003;7:155–159. doi: 10.1016/s1090-3798(03)00060-6. [DOI] [PubMed] [Google Scholar]
- 13.Mercuri E, Messina S, Battini R, Berardinelli A, Boffi P, et al. Reliability of the Hammersmith functional motor scale for spinal muscular atrophy in a multicentric study. Neuromuscul Disord. 2006;16:93–98. doi: 10.1016/j.nmd.2005.11.010. [DOI] [PubMed] [Google Scholar]
- 14.Glanzman A, O’Hagen J, McDermott M, Martens WB, Flickinger J, et al. Validation of the Expanded Hammersmith Functional Motor Scale in spinal muscular atrophy type II and III. J Child Neurol. 2011;26:1499–1507. doi: 10.1177/0883073811420294. [DOI] [PubMed] [Google Scholar]
- 15.Krosschell K, Maczulski J, Crawford T, Scott C, Swoboda K. A modified Hammersmith functional motor scale for use in multi-center research on spinal muscular atrophy. Neuromuscul Disord. 2006;16:417–426. doi: 10.1016/j.nmd.2006.03.015. [DOI] [PMC free article] [PubMed] [Google Scholar]
- 16.Krosschell K, Scott C, Maczulski J, Lewelt A, Reyna S, et al. Reliability of the Modified Hammersmith Functional Motor Scale in young children with spinal muscular atrophy. Muscle Nerve. 2011;44:246–251. doi: 10.1002/mus.22040. [DOI] [PMC free article] [PubMed] [Google Scholar]
- 17.Bérard C, Payan C, group Ms A motor function measure scale for neuromuscular diseases. Construction and validation study. Neuromuscul Disord. 2005;15:463–470. doi: 10.1016/j.nmd.2005.03.004. [DOI] [PubMed] [Google Scholar]
- 18.Nelson L, Owens H, Hynan L, Iannaccone S, Group A. The gross motor function measure is a valid and sensitive outcome measure for spinal muscular atrophy. Neuromuscul Disord. 2006;16:374–380. doi: 10.1016/j.nmd.2006.03.005. [DOI] [PubMed] [Google Scholar]
- 19.Iannaccone S, Hynan L. Reliability of 4 outcome measures in pediatric spinal muscular atrophy. Arch Neurol. 2003;60:1130–1136. doi: 10.1001/archneur.60.8.1130. [DOI] [PubMed] [Google Scholar]
- 20.Scott E, Eagle M, Main M, Sheehan J. The North Star Ambulatory Assessment. 32nd Annual Meeting of British Paediatric Neurology Association; Bristol, UK. 2006. [Google Scholar]
- 21.Mazzone E, Messina S, Vasco G. Reliability of the North Star Ambulatory Assessment in a multicentric setting. Neuromuscul Disord. 2009;19:458–461. doi: 10.1016/j.nmd.2009.06.368. [DOI] [PubMed] [Google Scholar]
- 22.Steffensen B, Hyde S, Lyager S, Mattsson E. Validity of the EK scale: a functional assessment of non-ambulatory individuals with Duchenne muscular dystrophy or spinal muscular atrophy. Physiother Res Int. 2001;6:119–134. doi: 10.1002/pri.221. [DOI] [PubMed] [Google Scholar]
- 23.Glanzman A, Mazzone E, Main M, Pelliccioni M, Wood J, et al. The Children’s Hospital of Philadelphia Infant Test of Neuromuscular Disorders (CHOP INTEND): test development and reliability. Neuromuscul Disord. 2010;20:155–161. doi: 10.1016/j.nmd.2009.11.014. [DOI] [PMC free article] [PubMed] [Google Scholar]
- 24.Glanzman A, McDermott M, Montes J, Martens WB, Flickinger J, et al. Validation of the Children’s Hospital of Philadelphia Infant Test of Neuromuscular Disorders (CHOP INTEND) Pediatr Phys Ther. 2011;23:322–326. doi: 10.1097/PEP.0b013e3182351f04. [DOI] [PubMed] [Google Scholar]
- 25.Finkel R, Hynan L, Glanzman A, Owens H, Nelson L, et al. The test of infant motor performance: reliability in spinal muscular atrophy type I. Pediatr Phys Ther. 2008;20:242–246. doi: 10.1097/PEP.0b013e318181ae96. [DOI] [PubMed] [Google Scholar]
- 26.O’Hagen J, Glanzman A, McDermott M, Ryan PA, Flickinger J, et al. An expanded version of the Hammersmith Functional Motor Scale for SMA II and III patients. Neuromuscul Disord. 2007;17:693–697. doi: 10.1016/j.nmd.2007.05.009. [DOI] [PubMed] [Google Scholar]
- 27.Russell D, Rosenbaum P, Avery L, Lane M. Gross motor function measure user’s manual. London: Mac Keith Press; 2002. [Google Scholar]
- 28.Steffensen B, Lyager S, Werge B, Rahbek J, Mattsson E. Physical capacity in non-ambulatory people with Duchenne muscular dystrophy or spinal muscular atrophy: a longitudinal study. Dev Med Child Neurol. 2002;44:623–632. doi: 10.1017/s0012162201002663. [DOI] [PubMed] [Google Scholar]
- 29.Campbell S, Swanlund A, Smith E, Liao P, Zawacki L. Validity of the TIMPSI for estimating concurrent performance on the test of infant motor performance. Pediatr Phys Ther. 2008;20:3–10. doi: 10.1097/PEP.0b013e31815f66a6. [DOI] [PMC free article] [PubMed] [Google Scholar]
- 30.Andrich D. Rasch models for measurement. Beverley Hills, CA: Sage Publications; 1988. [Google Scholar]
- 31.Cano SJ, Warner TT, Linacre JM, Bhatia KP, Thompson AJ, et al. Capturing the true burden of dystonia on patients: the Cervical Dystonia Impact Profile (CDIP-58) Neurology. 2004;63:1629–1633. doi: 10.1212/01.wnl.0000142962.11881.26. [DOI] [PubMed] [Google Scholar]
- 32.Cano SJ, Riazi A, Schapira AH, Cooper JM, Hobart JC. Friedreich’s ataxia impact scale: a new measure striving to provide the flexibility required by today’s studies. Mov Disord. 2009;24:984–992. doi: 10.1002/mds.22420. [DOI] [PubMed] [Google Scholar]
- 33.Hobart J, Cano S. Improving the evaluation of therapeutic interventions in multiple sclerosis: the role of new psychometric methods. Health Technol Assess. 2009;13:iii, ix–x, 1–177. doi: 10.3310/hta13120. [DOI] [PubMed] [Google Scholar]
- 34.Andrich D. Rating scales and Rasch measurement. Expert Rev Pharmacoecon Outcomes Res. 2011;11:571–585. doi: 10.1586/erp.11.59. [DOI] [PubMed] [Google Scholar]
- 35.Rasch G. Probabilistic models for some intelligence and attainment tests. Copenhagen: Danish Institute for Education Research; 1960. (Expanded edition (1980) with foreword and afterword by B.D. Wright, Chicago: The University of Chicago Press, 1980. Reprinted Chicago: MESA Press, 1993. Available from www.rasch.org/books.htm) [Google Scholar]
- 36.Cano S, Warner T, Thompson A, Bhatia K, Fitzpatrick R, et al. The cervical dystonia impact profile (CDIP-58): can a Rasch developed patient reported outcome measure satisfy traditional psychometric criteria? Health Qual Life Outcomes. 2008;6:58. doi: 10.1186/1477-7525-6-58. [DOI] [PMC free article] [PubMed] [Google Scholar]
- 37.Mayhew A, Cano S, Scott E, Eagle M, Bushby K, et al. Moving towards meaningful measurement: Rasch analysis of the North Star Ambulatory Assessment in Duchenne muscular dystrophy. Dev Med Child Neurol. 2011;53:535–542. doi: 10.1111/j.1469-8749.2011.03939.x. [DOI] [PubMed] [Google Scholar]
- 38.International Coordinating Committee for SMA Clinical Trials. Meeting of the FDA SEALD Division and Representatives of the International Coordinating Committee for SMA Clinical Trials. New York: International Coordinating Committee for SMA Clinical Trials; 2010. [Google Scholar]
- 39.Massof R. Understanding Rasch and item response theory models: applications to the estimation and validation of interval latent trait measures from responses to rating scale questionnaires. Ophthalmic Epidemiol. 2011;18:1–19. doi: 10.3109/09286586.2010.545501. [DOI] [PubMed] [Google Scholar]
- 40.Kaufmann P, Muntoni F. Issues in SMA clinical trial design: The International Coordinating Committee (ICC) for SMA Subcommittee on SMA Clinical Trial Design. Neuromuscul Disord. 2007;17:499–505. doi: 10.1016/j.nmd.2006.12.001. [DOI] [PMC free article] [PubMed] [Google Scholar]
- 41.Ware JEJ, Harris WJ, Gandek B, Rogers BW, Reese PR. MAP-R for windows: multitrait / multi-item analysis program – revised user’s guide. Boston, MA: Health Assessment Lab; 1997. [Google Scholar]
- 42.RUMM 2030 [computer program] Perth, WA: RUMM Laboratory Pty Ltd; 1997–2012. [Google Scholar]
- 43.Andrich D. A rating formulation for ordered response categories. Psychometrika. 1978;43:561–573. [Google Scholar]
- 44.Andrich D. An index of person separation in latent trait theory, the traditional KR20 index, and the Guttman scale response pattern. Educ Psychol Res. 1982;9:95–104. [Google Scholar]
- 45.Andrich D. An elaboration of Guttman scaling with Rasch models for measurement. In: Tuma NB, editor. Social methodology, Chap 2. San Francisco: Jossey-Bass; 1985. pp. 33–80. [Google Scholar]
- 46.Andrich D, de Jong JHAL, Sheridan BE. Diagnostic opportunities with the Rasch model for ordered response categories. In: Rost J, Langeheine R, editors. Applications of latent trait and latent class models in the saocial sciences. Munster, Germany: Waxmann Verlag GmbH; 1997. pp. 59–70. [Google Scholar]
- 47.Hagquist C, Andrich D. Is the sense of coherence instrument applicable on adolescents? A latent trait analysis using Rasch modelling. Pers Individ Dif. 2004;36:955–968. [Google Scholar]
- 48.Wright BD, Masters G. Rating scale analysis: Rasch measurement. Chicago: MESA; 1982. [Google Scholar]
- 49.Marais I, Andrich D. Formalising dimension and response violations of local independence in the unidimensional Rasch model. J Appl Meas. 2008;9:200–215. [PubMed] [Google Scholar]
- 50.Cronbach LJ. Coefficient alpha and the internal structure of tests. Psychometrika. 1951;16:297–334. [Google Scholar]
- 51.Pallant J, Tennant A. An introduction to the Rasch measurement model: an example using the Hospital Anxiety and Depression Scale (HADS) Br J Clin Psychol. 2007;46:1–18. doi: 10.1348/014466506x96931. [DOI] [PubMed] [Google Scholar]
- 52.Andrich D. Implication and applications of modern test theory in the context of outcomes based research. Stud Educ Eval. 2002;28:103–121. [Google Scholar]
- 53.Cano S, Hobart J. The problem with health measurement. Patient Prefer Adherence. 2011;5:279–290. doi: 10.2147/PPA.S14399. [DOI] [PMC free article] [PubMed] [Google Scholar]
- 54.Michener L, McClure P, Sennett B. American Shoulder and Elbow Surgeons Standardized Shoulder Assessment Form, patient selfreport section: reliability, validity, and responsiveness. J Shoulder Elbow Surg. 2002;11:587–594. doi: 10.1067/mse.2002.127096. [DOI] [PubMed] [Google Scholar]
- 55.Andrich D, Hagquist C. Real and artificial differential item functioning. J Educ Behav Stat. 2012;37:387–416. doi: 10.1177/0013164414534258. [DOI] [PMC free article] [PubMed] [Google Scholar]
- 56.Stenner AJ, Smith M. Testing construct theories. Percept Mot Skills. 1982;55:415–426. [Google Scholar]
- 57.Andrich D. Controversy and the Rasch model: a characteristic of incompatible paradigms? Med Care. 2004;42:I7–I16. doi: 10.1097/01.mlr.0000103528.48582.7c. [DOI] [PubMed] [Google Scholar]
- 58.Revicki D. FDA draft guidance and health-outcomes research. Lancet. 2007;369:540–542. doi: 10.1016/S0140-6736(07)60250-5. [DOI] [PubMed] [Google Scholar]
- 59.Stenner AJ, Burdick H, Sandford EE, Burdick DS. How accurate are lexile text measures? J Appl Meas. 2006;7:307–322. [PubMed] [Google Scholar]
- 60.Choppin B. An item bank using sample free calibration. Nature. 1968;219:870–872. doi: 10.1038/219870a0. [DOI] [PubMed] [Google Scholar]
- 61.White S, Clement J. Assessing the Lexile Framework: results of a panel meeting NCES Working Paper Series. Washington, DC: US Department of Education, Office of Educational Research and Improvement; 2001. (Working Paper No. 2001–08). [Google Scholar]
Associated Data
This section collects any data citations, data availability statements, or supplementary materials included in this article.