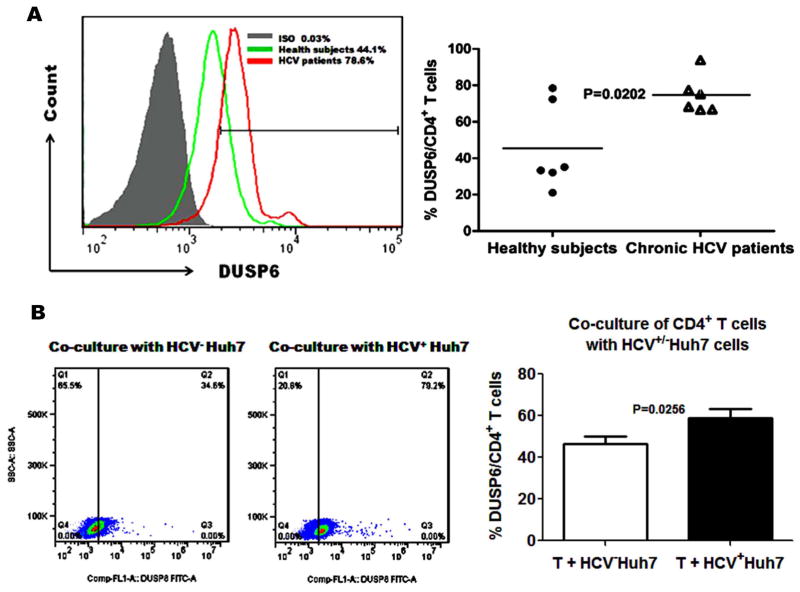
Fig. 3. HCV-induced DUSP6 expression.
A) PBMCs isolated from 6 HCV patients and 6 age-comparable HS were stimulated with anti-CD3/CD28 for 24 h ex vivo. Cells were immunostained with FITC-conjugated anti-human DUSP6 antibody and PE-conjugated anti-CD4 antibody and analyzed by flow cytometry. Representative histogram of DUSP6 expression by CD4+ T cells in HCV patients and HS versus isotype-IgG control is shown in the left panel. Percentages of DUSP6-expressing CD4+ T cells in HCV patients and HS are shown in the right panel. Each symbol represents an individual subject, and the horizontal lines represent median values. B) CD4+ T cells were purified from PBMCs isolated from 6 HS using magnetic beads. Purified CD4+ T cells were co-cultured with HCV+/− Huh7 hepatocytes at a ratio 4:1 in vitro for 72 h with 1 μg/ml of anti-CD3/CD28 stimulation and immunostained with FITC-conjugated anti-human DUSP6 followed by flow cytometric analysis. Representative dot plots of DUSP6 expression in CD4+ T cells from co-cultured with HCV+ Huh7 and HCV− Huh7 are shown in the left panel. Percentages of DUSP6-expressing CD4+ T cells in those co-cultured with HCV+ Huh7 and HCV− Huh7 are shown in the right panel.

