Abstract
Appropriate responses to an imminent threat brace us for adversities. The ability to sense and predict threatening or stressful events is essential for such adaptive behavior. In the mammalian brain, one putative stress sensor is the paraventricular nucleus of the thalamus (PVT), an area that is readily activated by both physical and psychological stressors1-3. However, the role of PVT in the establishment of adaptive behavioral responses remains unclear. Here we show in mice that PVT regulates fear processing in the lateral division of the central amygdala (CeL), a structure that orchestrates fear learning and expression4,5. Selective inactivation of CeL-projecting PVT neurons prevented fear conditioning, an effect that can be accounted for by an impairment in fear conditioning-induced synaptic potentiation onto somatostatin-expressing (SOM+) CeL neurons, which has previously been shown to store fear memory6. Consistently, we found that PVT neurons preferentially innervate SOM+ neurons in the CeL, and stimulation of PVT afferents facilitated SOM+ neuron activity and promoted intra-CeL inhibition, two processes that are critical for fear learning and expression5,6. Notably, PVT modulation of SOM+ CeL neurons was mediated by activation of the brain-derived neurotrophic factor (BDNF) receptor tropomysin-related kinase B (TrkB). As a result, selective deletion of either Bdnf in PVT or Trkb in SOM+ CeL neurons impaired fear conditioning, while infusion of BDNF into CeL enhanced fear learning and elicited unconditioned fear responses. Our results demonstrate that the PVT–CeL pathway constitutes a novel circuit essential for both the establishment of fear memory and the expression of fear responses, and uncover mechanisms linking stress detection in PVT with the emergence of adaptive behavior.
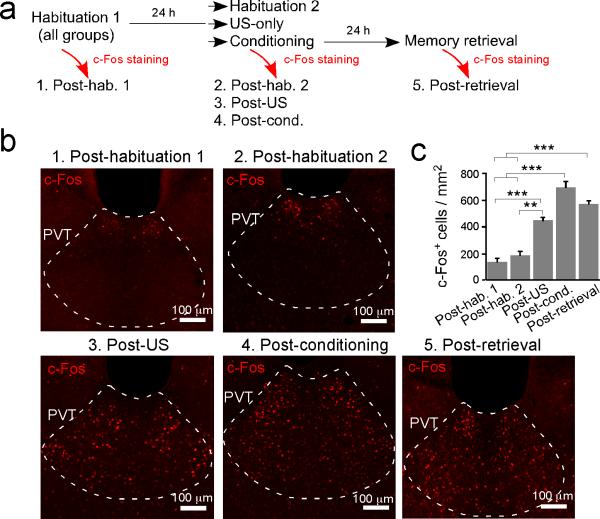
To probe the sensitivity of PVT to threatening events, we examined the expression of c-Fos, a marker of recent neuronal excitation, both following fear conditioning and after fear memory retrieval test. Fear conditioning markedly increased the number of neurons expressing c-Fos in the posterior PVT (pPVT) (Extended Data Fig. 1), consistent with the finding that pPVT receives direct inputs from the nociceptive parabrachial nucleus and the periaqueductal grey7,8. Interestingly, fear memory retrieval induced a similar increase in pPVT c-Fos expression (Extended Data Fig. 1). These results demonstrate that pPVT is recruited by both the US (unconditioned stimulus) and the threat-predicting CS (conditioned stimulus), and raise the possibility that it might be instrumental in fear conditioning.
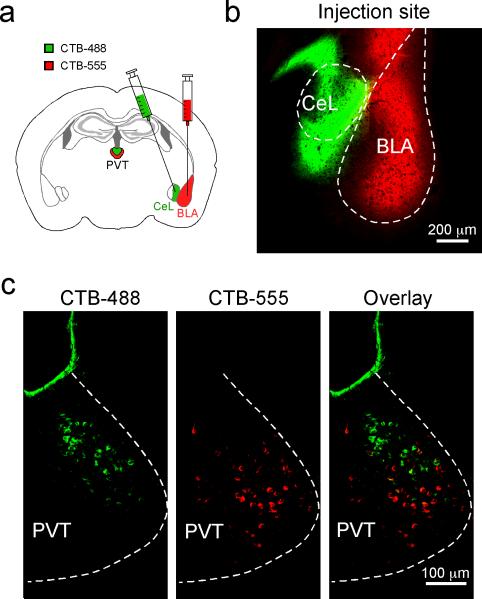
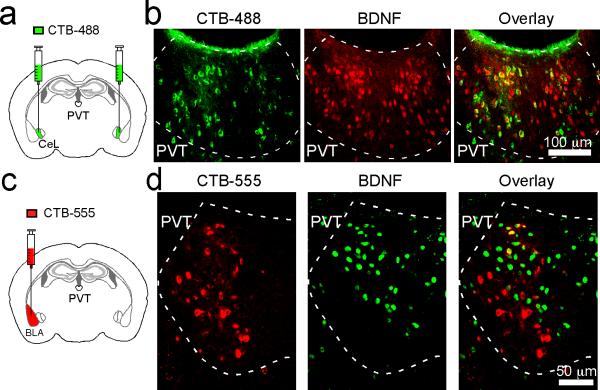
Indeed, pPVT strongly projects to CeL9,10, with weaker projections to other amygdala nuclei, such as the basolateral amygdala (BLA)10. To examine the distribution patterns of pPVT neurons innervating different amygdala subregions, we injected CeL and BLA, respectively, with the retrograde tracer cholera toxin subunit B conjugated to Alexa Fluor-488 (CTB-488) or Alexa Fluor-555 (CTB-555). This approach resulted in dense labeling throughout the ipsilateral pPVT, indicating prominent pPVT–amygdala projections (Extended Data Fig. 2). Notably, pPVT neurons projecting to CeL and BLA were largely non-overlapping (Extended Data Fig. 2).
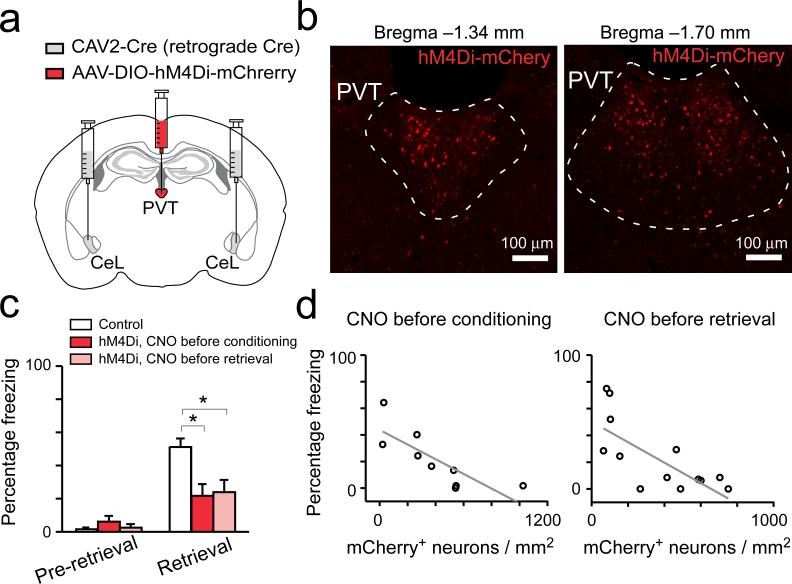
To determine whether the pPVT–CeL pathway, the most prominent projection originating from pPVT9,10, is involved in fear conditioning, we sought to selectively inhibit CeL-projecting neurons in pPVT with a chemogenetic method11. We bilaterally injected CeL with a retrograde canine adenovirus expressing the Cre recombinase (CAV2-Cre)12, followed by injection into pPVT of the AAV-DIO-hM4Di-mCherry, an adeno-associated virus harboring a double floxed inverted open reading frame (AAV-DIO) that expresses, in a Cre-dependent manner, an engineered Gi-coupled receptor hM4Di tagged with a fluorescent protein mCherry (hM4Di-mCherry). This intersectional strategy effectively targeted CeL-projecting pPVT neurons (Fig. 1a, b), which can subsequently be suppressed by treating mice with CNO, the agonist of hM4Di11. Remarkably, selective suppression of the CeL-projecting pPVT neurons during either conditioning or 24 h memory retrieval test significantly impaired fear responses measured as freezing in the retrieval test (Fig. 1c; Extended Data Fig. 3). Importantly, these behavioral effects significantly correlated with the number of hM4Di-expressing neurons in pPVT (Fig. 1d), showing the specificity and potency of our manipulation. Altogether, these results indicate that pPVT is crucial for both the establishment and expression of fear memory.
Figure 1. CeL-projecting pPVT neurons are essential for both learning and expression of conditioned fear.
a. A schematic of the experimental approach. b. Representative images showing the expression of hM4Di-mCherry in CeL-projecting pPVT neurons. c. Quantification of freezing levels in memory retrieval test (control, n = 15 mice; hM4Di with CNO before conditioning, n = 9 mice; hM4Di with CNO before retrieval, n = 13 mice; effect of treatments, F(2,68) = 5.14, P < 0.01; effect of CS presentation, F(1,68) = 51.27, P < 0.001; interaction, F(2,68) = 7.42, P < 0.01; *P < 0.05; two-way analysis of variance (ANOVA) followed by Tukey's test). The control group contains mice that were injected only with CAV2-Cre bilaterally in CeL and were treated with CNO either before conditioning (n = 7 mice) or before retrieval (n = 8 mice). d. Correlation between viral infection efficiency in pPVT and the behavioral effect (CNO before conditioning, R2 = 0.59, P < 0.01, n = 9 mice; CNO before retrieval, R2 = 0.47, P < 0.05, n = 13 mice; linear regression lines are shown in gray). Data are presented as mean ± s.e.m.
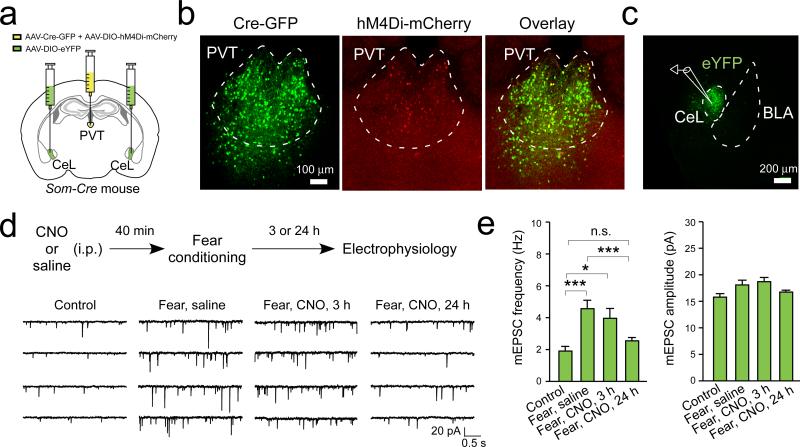
We next determined the mechanisms by which the pPVT–CeL circuit contributes to fear regulation. Fear conditioning induces a potentiation of excitatory synapses onto SOM+ CeL neurons that stores fear memory6. To investigate whether pPVT is required for this plasticity, we labeled SOM+ CeL neurons with eYFP by injecting CeL with AAV-DIO-eYFP in Som-Cre mice, in which the Cre recombinase is expressed under the endogenous Som promoter6. In addition, we injected pPVT in the same mice with a mixture of AAV-GFP-Cre and AAV-DIO-hM4Di-mCherry (Fig. 2a–c). This strategy allowed us to inhibit pPVT neurons using the chemogenetic method during fear conditioning, and subsequently determine the effect on SOM+ (eYFP+) CeL neurons (Fig. 2; Extended Data Fig. 3).
Figure 2. pPVT is required for the maintenance of fear conditioning-induced synaptic plasticity in CeL.
a. A schematic of the experimental approach. b. Representative images showing the expression of Cre-GFP and hM4Di-mCherry in pPVT. c. SOM+ (eYFP+) CeL neurons in acute slices were targeted for recording. d. Top: a schematic of the experimental procedure. Bottom, representative traces of mEPSCs recorded from SOM+ CeL neurons in mice of the following groups (from left to right): 1) naïve control; 2) fear conditioned, treated with saline and sacrificed 24 hours following conditioning; 3) fear conditioned, treated with CNO and sacrificed 3 hours following conditioning; and 4) fear conditioned, treated with CNO and sacrificed 24 hours following conditioning. e. Quantification of mEPSC frequency (left) and amplitude (right). Frequency, F(3,89) = 8.4, *P < 0.05, ***P < 0.001, n.s., non-significant (P > 0.05) (Control, n = 16 neurons (3 mice); “Fear, saline”, n = 27 neurons (4 mice); “Fear, CNO, 3 h”, n = 16 neurons (3 mice); “Fear, CNO, 24 h”, n = 34 neurons (3 mice)); Amplitude, F(3,89) = 2.9, P < 0.05 (no significant difference was detected in the post-hoc analysis); one-way ANOVA followed by Tukey's test. Data are presented as mean ± s.e.m.
As previously reported6, fear conditioning significantly enhanced excitatory synaptic transmission – measured as an increase in both the frequency and amplitude of miniature excitatory postsynaptic currents (mEPSCs) – onto SOM+ CeL neurons (Fig. 2d, e). This synaptic potentiation can be detected at both 3 h and 24 h following conditioning6. Interestingly, inhibition of pPVT neurons during fear conditioning did not affect this synaptic potentiation when examined 3 h after conditioning (Fig. 2d, e). In contrast, the same manipulation completely abolished synaptic potentiation measured 24 h after conditioning (Fig. 2d, e). These results indicate that pPVT is required for the maintenance or consolidation, but not the initial induction of CeL plasticity, and are consistent with findings in an accompanying study that long-term (≥ 24 h), but not short-term (0.5 & 6 h) fear memories are susceptible to PVT manipulations (Do-Monte et al., this issue).
Because mEPSCs do not allow distinguishing between different synaptic pathways, we next examined whether pPVT inactivation impairs plasticity at the lateral amygdala (LA)–CeL synapses, a pathway that presumably conveys CS information to the CeL. For this purpose we used the Som-Cre;Rosa26-stopflox-H2b-GFP (Som-Cre;H2b-GFP) mice13 in which all SOM+ CeL neurons are readily identified based on the nucleus-localized GFP signal (Extended Data Fig. 4a). We inhibited pPVT neurons during fear conditioning using the same method as described above (Fig. 2a, b). We then simultaneously recorded pairs of adjacent SOM+ (green-fluorescent) and SOM– (non-fluorescent) CeL neurons in acute brain slices, while EPSCs were evoked by electrical stimulation in LA (Extended Data Fig. 4a). As previously reported6, in naïve control mice AMPA receptor (AMPAR)-mediated EPSCs were significantly larger in SOM– neurons than in SOM+ neurons (Extended Data Fig. 4b, c), indicating a clear distinction between these two cell types in their intrinsic functional connectivity. However, fear conditioning reversed this relationship such that AMPAR-mediated transmission was significantly stronger in SOM+ neurons than in SOM– neurons (Extended Data Fig. 4b, c).
Fear conditioning also induced a decrease in the paired-pulse ratio (PPR) of EPSCs – an indicator of increased presynaptic release probability – onto SOM+ CeL neurons (Extended Data Fig. 4d). This result, when considered together with data obtained from the paired recording (Extended Data Fig. 4a–c) and mEPSC recording (Fig. 2d, e) experiments (also see Ref6), demonstrates that fear conditioning strengthens excitatory synaptic transmission onto SOM+ CeL neurons, and that an increase in presynaptic release probability is likely the major underlying mechanism. Importantly, inhibition of pPVT during conditioning largely blocked these synaptic changes in the LA–CeL pathway (Extended Data Fig. 4b–d). Altogether, these results indicate that pPVT participates in fear memory formation by regulating the maintenance of fear conditioning-induced plasticity at the LA–CeL synapses.
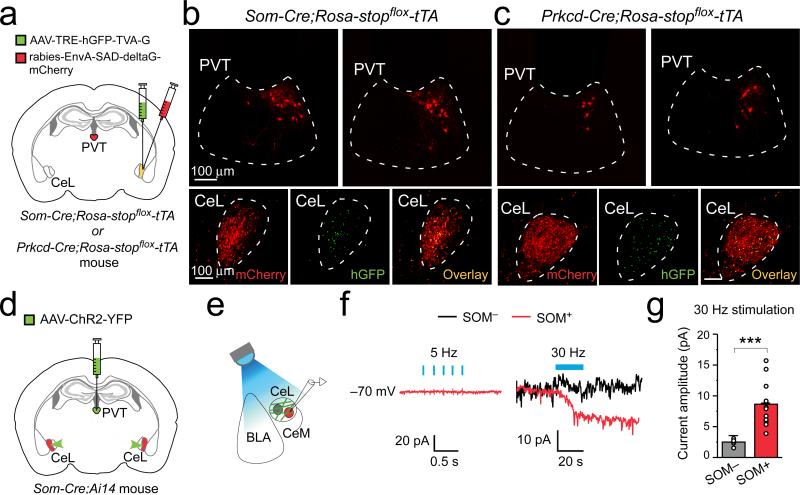
SOM+ and SOM– neurons – the latter being predominantly protein kinase C-δ-expressing (PKC-δ+)6 – constitute two major CeL populations that are mutually inhibitory6,14. We reasoned that pPVT might control CeL synaptic plasticity by regulating either one or both of these populations. To distinguish between these possibilities, we used a modified rabies virus system that can trace the monosynaptic inputs onto genetically identified neurons15 (see Methods). This approach revealed that pPVT projects to both populations (Fig. 3a–c), with the distinction that pPVT neurons innervating SOM+ neurons were twice as many as those innervating PKC-δ+ neurons (the connectivity indices, calculated as the ratio of the number of rabies virus-labeled cells in pPVT to that of starter cells in CeL, for the two cell types are: SOM+, 0.99 ± 0.08, n = 3 mice; PKC-δ+, 0.49 ± 0.03, n = 3 mice; P < 0.01, t test), suggesting that pPVT afferents in CeL preferentially innervate SOM+ neurons.
Figure 3. pPVT neurons preferentially innervate SOM+ cells in CeL.
a. A schematic of the experimental approach (see Methods). b & c. Representative images of the tracing result for SOM+ (b) and PKC-δ+ (c) CeL neurons. Upper panels: retrogradely labeled neurons in pPVT. Lower panels: starter neurons in CeL are identified by their co-expression of mCherry (left) and hGFP (middle) (overlay in right). d & e. Schematics of the experimental approach. f. Sample traces of synaptic responses to brief (5-Hz 5-ms pulses; left) or prolonged high frequency (30-Hz 5-ms pulses; right) photostimulation of pPVT afferents. Holding potential was –70 mV. g. Quantification of the synaptic responses induced by the 30-Hz stimulation of pPVT afferents (SOM–, n = 7 neurons (5 mice); SOM+, n =12 neurons (5 mice); ***P < 0.001, t test). Data are presented as mean ± s.e.m.
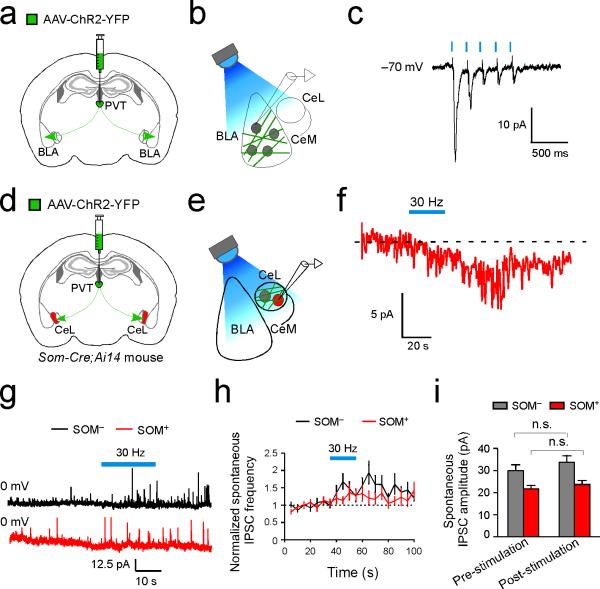
To assess the functional connectivity between pPVT and CeL, we used the Som-Cre;Ai14 mice, in which SOM+ cells can be identified by their red fluorescence, and injected pPVT with an AAV expressing the channelrodhopsin-2 (AAV-ChR2-YFP) that allows photostimulation of axonal projections16 (Fig. 3d, e). Bright ChR2-YFP-labeled fibers were readily observed throughout the CeL in acute slices prepared from these mice, confirming a strong pPVT–CeL projection. To our surprise, brief light pulses, which reliably evoked excitatory synaptic transmission in BLA neurons (Extended Data Fig. 5a–c), failed to evoke any detectable fast synaptic transmission in all the recorded SOM+ or SOM– CeL neurons (Fig. 3e, f). Interestingly, high frequency photo-stimulation of pPVT afferents in CeL induced a slow inward current exclusively in SOM+ neurons (Fig. 3e–g; Extended Data Fig. 5d–f). High frequency photo-stimulation also generated a sustained increase in the frequency of spontaneous inhibitory postsynaptic currents (sIPSC) onto SOM– neurons (Extended Data Fig. 5g–i). Because SOM+ cells inhibit SOM– cells in CeL6, these results suggest that pPVT inputs selectively facilitate the activation of SOM+ neurons, which in turn suppress SOM– neurons.
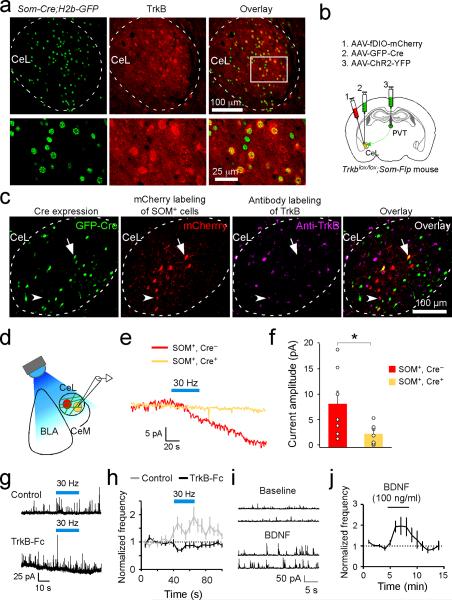
Given that stimulation of pPVT afferents in CeL evoked slow inward currents, rather than canonical fast synaptic responses in SOM+ neurons, it is likely that the pPVT–CeLSOM transmission is mediated by a neuromodulator. One notable candidate for this is BDNF, a known modulator of synaptic function17, whose mRNA expression in pPVT is the highest within the dorsal thalamus18. In fact, we found that the majority (~70%; n = 5 mice) of CeL-projecting pPVT neurons expressed BDNF (Extended Data Fig. 6a, b). In contrast, only 29% (n = 2 mice) of BLA-projecting PVT neurons expressed BDNF, a value that is likely an overestimation owing to contamination by CeL-projecting pPVT neurons caused by tracer diffusion into CeL (Extended Data Fig. 6c, d). In addition, CeL expression of the high-affinity BDNF receptor TrkB was largely restricted to SOM+ neurons (76% colocalization, n = 4 mice; Extended Data Fig. 7a), consistent with the preferential targeting of this particular cell-type by inputs from pPVT (Fig. 3). These results suggest that BDNF might be a critical factor mediating pPVT to CeL communication.
To examine the functional role of BDNF in pPVT–CeLSOM interaction, we bred the Trkblox/lox;Som-Flp mice, which carry the Trkblox/lox conditional alleles19 and in which the Flp recombinase is expressed under the endogenous Som promoter20. In these mice, Trkb can be deleted in CeL by infection with the AAV-GFP-Cre, while SOM+ neurons can be tagged by infection with AAV-fDIO-mCherry – an AAV harboring a double FRT-flanked inverted open reading frame (fDIO) that expresses mCherry in an Flp-dependent manner – thereby allowing their identification in acute slices for electrophysiological recording (Extended Data Fig. 7b, c). Based on this strategy we found that the pPVT-driven slow excitatory inward currents were selectively abolished in SOM+ neurons in which Trkb was deleted (mCherry and GFP double-positive neurons; Extended Data Fig. 7c–f). Consistent with this result, bath application of the BDNF scavenger TrkB-Fc in acute slices abolished the pPVT-driven increase in inhibition onto SOM– CeL neurons (Extended Data Fig. 7g, h), whereas exogenous application of BDNF mimicked this increase in inhibition (Extended Data Fig. 7i, j). These results indicate that BDNF/TrkB signaling is a mediator of pPVT–CeLSOM communication.
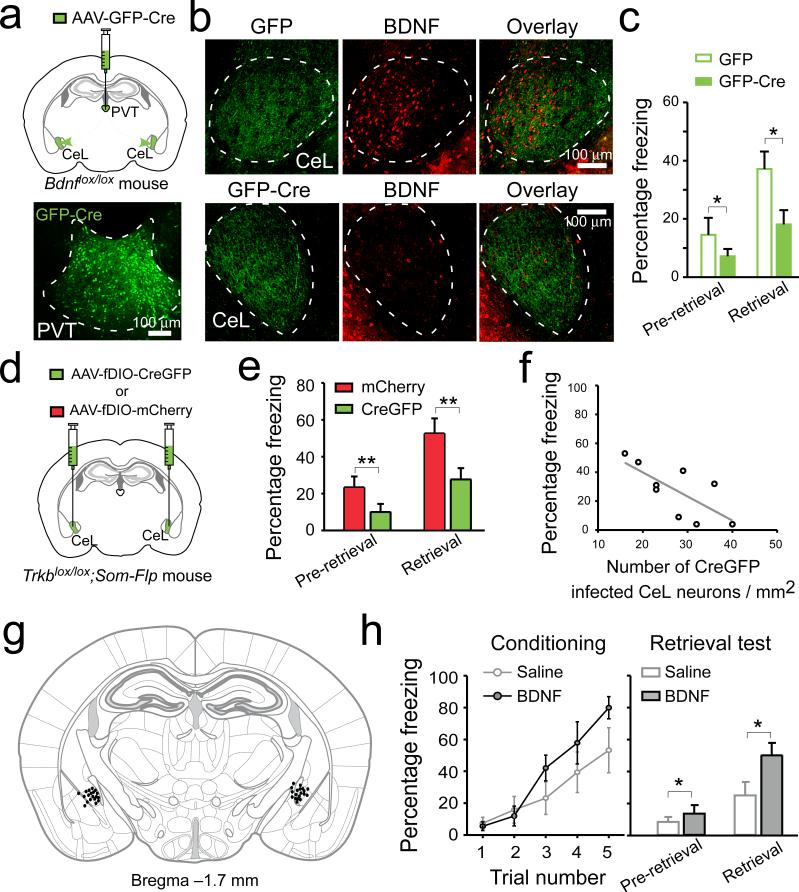
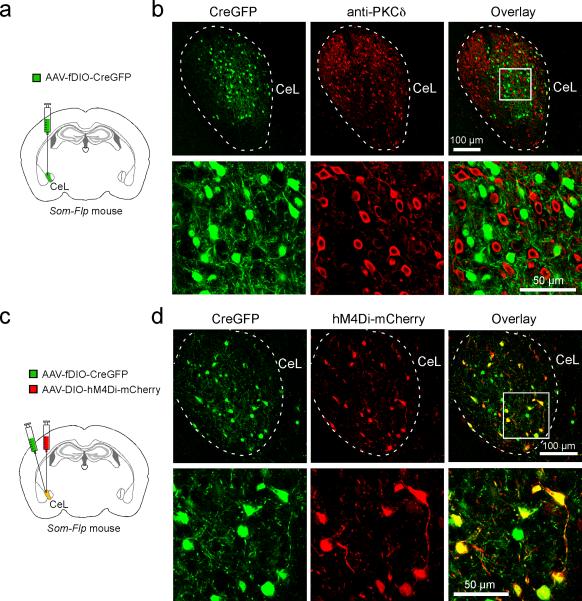
Next, to determine whether this BDNF/TrkB-mediated pPVT–CeLSOM communication is important for fear processing, we selectively deleted either Bdnf from pPVT, or Trkb in SOM+ CeL neurons. To achieve the former, we employed a mouse line carrying the Bdnflox/lox conditional alleles21 and injected PVT with the AAV-GFP-Cre (Fig. 4a–c). To achieve the latter, we designed an AAV-fDIO-CreGFP that expresses CreGFP (a Cre and GFP fusion protein) under the control of Flp (Extended Data Fig. 8). This virus, when injected into CeL of the Trkblox/lox;Som-Flp mice, expresses Cre – and hence leads to Trkb deletion – specifically in SOM+ neurons. This Intersectional Recombinases-mediated Arealand-cell-Specific gene Excision (IRASE) method can be generally applied for gene deletion with spatial and cell-type specificity.
Figure 4. BDNF/TrkB-mediated pPVT–CeL communication is essential for fear conditioning.
a. Top: a schematic of the experimental approach. Bottom: a representative image of pPVT infected with AAV-GFP-Cre. b. Representative images of CeL from Bdnflox/lox mice in which the pPVT was injected with either AAV-GFP (upper panels) or AAV-GFP-Cre (lower panels). Mice injected with AAV-GFP-Cre in pPVT showed marked reduction of BDNF labeling in CeL (middle and right panels). c. Deletion of Bdnf in pPVT significantly reduced freezing levels during memory retrieval test (n = 16 mice for both groups; effect of treatments, F(1,60) = 6.91, P < 0.05; effect of CS presentation, F(1,60) = 11.17, P < 0.01; interaction, F(1,60) = 1.34, P > 0.05; *P < 0.05; two-way ANOVA followed by Tukey's test). d. A schematic of the experimental approach. e. Selective deletion of Trkb in SOM+ CeL neurons significantly reduced freezing levels during memory retrieval test (n = 9 and 10 mice for CreGFP and mCherry, respectively; effect of treatments, F(1,30) = 9.59, P < 0.01; effect of CS presentation, F(1,30) = 14.37, P < 0.001; interaction, F(1,30) = 0.88, P > 0.05; **P < 0.01; two-way ANOVA followed by Tukey's test). f. The bilateral infection rate in CeL significantly correlated with freezing levels during retrieval (R2 = 0.44, P < 0.05, n = 9 mice; linear regression is indicated by a gray line). g. Drawing of the cannula sites. Each dot denotes where the tip of the injection cannula was located in each mouse. h. BDNF infusion into CeL promotes fear learning. Left: performance of mice during a mild conditioning procedure (see Methods). BDNF infusion had a trend to improve performance (F(1,55) = 3.65, P = 0.06, two-way ANOVA). Right: BDNF infusion enhanced freezing levels during memory retrieval test (n = 9 and 10 mice for saline and BDNF, respectively; effect of treatment, F(1,34) = 5.63, P < 0.05; effect of CS, F(1,34) = 17.35, P < 0.001; interaction, F(1,34) = 2.44, P > 0.05; *P < 0.05; two-way ANOVA followed by Tukey's test). Data are presented as mean ± s.e.m.
Deletion of Bdnf in pPVT depleted BDNF from CeL (BDNF+ cells in CeL: GFP group, 156.36 ± 39.40 cells/mm2, n = 8 mice; GFP-Cre group, 41.20 ± 12.00 cells/mm2, n = 7 mice; P < 0.05, t test) (Fig. 4a, b) and markedly impaired fear conditioning (Fig. 4c; Extended Data Fig. 3). In parallel, deletion of Trkb selectively in SOM+ CeL neurons by IRASE similarly impaired fear conditioning (Fig. 4d–f; Extended Data Fig. 3). These results indicate that PVT is a major source of BDNF for CeL, and BDNF/TrkB-mediated pPVT–CeLSOM interaction has an important role in fear processing.
Of note, Bdnf deletion in pPVT or Trkb deletion in SOM+ CeL neurons not only impaired CS-evoked freezing, a measurement of tone-associated memory, but also reduced pre-CS freezing, which presumably represents contextual memory (Fig. 4c, e). Alternatively, or additionally, these behavioral effects could reflect a general reduction in fear responses, such as that caused by altered arousal or negative behavioral states22.
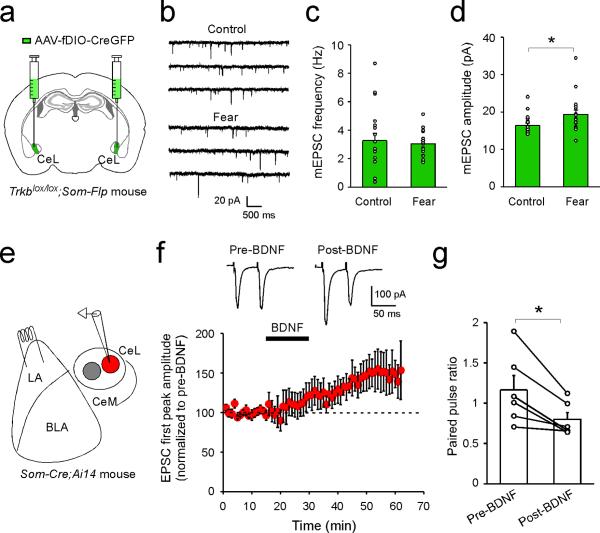
To disentangle these issues, we first determined whether disruption of BDNF signaling affects the synaptic potentiation onto SOM+ CeL neurons that, as mentioned above, can serve as a fear memory trace6 . Deletion of Trkb in SOM+ CeL neurons by IRASE prevented the fear conditioning-induced increase in frequency, but not amplitude, of mEPSCs (Extended Data Fig. 9a–d), suggesting that the presynaptic potentiation – the major component of fear conditioning-driven CeL plasticity6 – depends on BDNF signaling. We next examined the effects of enhancing BDNF signaling. Bath application of BDNF on slices was sufficient to induce LTP (long-term potentiation) of excitatory synaptic transmission onto SOM+ CeL neurons, which was accompanied by a reduction in PPR (Extended Data Fig. 9e–g), indicating a presynaptic mechanism. These presynaptic effects in CeL induced by BDNF/TrkB manipulations are consistent with the presynaptic action of BDNF in other brain areas17. Notably, infusion of BDNF into CeL facilitated conditioning to a mild foot shock (Fig. 4g, h). These results, together with the above finding regarding the role of the pPVT–CeL pathway in fear learning (Fig. 1, Fig. 2, Extended Data Fig. 4), indicate that BDNF is a critical regulator of fear memory in CeL.
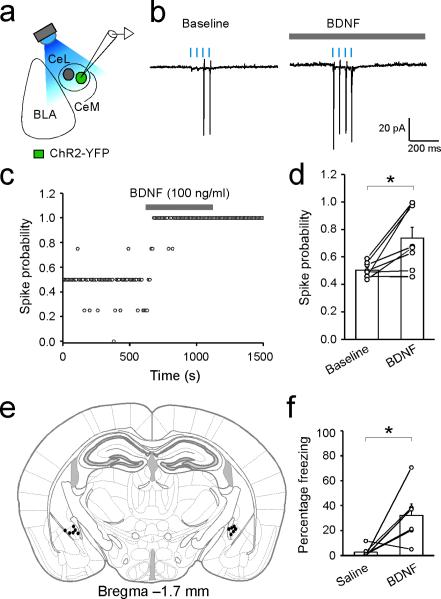
In light of our previously finding that activation of SOM+ CeL neurons is sufficient to drive unconditioned fear responses and is required for the expression of conditioned fear6, the observation that activation of TrkB induces a slow excitatory current in SOM+ CeL neurons (Fig. 3d–g; Extended Data Fig. 7b–f) suggests that BDNF might increase the excitability of these neurons, thereby promoting fear expression. Indeed, we found that bath application of BDNF on slices markedly increased the spike probability of SOM+ CeL neurons (Extended Data Fig. 10a–d); and remarkably, bilateral infusion of BDNF into the CeL of naïve mice elicited robust freezing responses (Extended Data Fig. 10e, f; Supplementary Video 1 and 2). These results, together with the above finding that the pPVT–CeL pathway is required for the expression of conditioned fear (Fig. 1), suggest that BDNF signaling in the pPVT–CeLSOM pathway may facilitate the expression of fear by promoting SOM+ CeL neuron activation.
On the basis of our collective results, we propose that BDNF/TrkB-mediated pPVT–CeL communication promotes both synaptic plasticity and excitability of SOM+ CeL neurons, thereby facilitating not only the formation of stable fear memories but also the expression of fear responses.
Recent studies suggest a role of PVT in anxiety-related behaviors23. In addition, altered BDNF signaling has been implicated in anxiety disorders24,25. Our findings that pPVT recruits BDNF/TrkB signaling to control CeL function define a functional framework for pPVT that can subserve its role in the coordination of behavioral responses to stress.
METHODS
Mice
All procedures were approved by the Institutional Animal Care and Use Committees of Cold Spring Harbor Laboratory and conducted in accordance to the US National Institute of Health guidelines. Mice were housed under a 12-h light-dark cycle (9 a.m. to 9 p.m. light), with food and water available ad libitum. Som-Cre6, Prkcd-Cre14, Som-Flp20, Bdnflox/lox21, Trkblox/lox19, Ai146, H2b-GFP13, and Rosa26-stopflox-tTA26 mice have all been described elsewhere. All mice were bred onto C57BL/6J genetic background. Male and female mice 6–9 weeks of age were used for all the experiments. All subjects were randomly allocated to the different experimental conditions used in this study.
Viral vectors
AAV-DIO-hM4Di-mCherry, AAV-DIO-eYFP, AAV-GFP-Cre, AAV-ChR2-YFP, and AAV-TRE-hGFP-TVA-G were produced by the University of North Carolina (UNC) Vector Core Facilities (Chapel Hill, NC) and have been previously described6,15. For the generation of the AAV-fDIO-CreGFP and AAV-fDIO-mCherry, standard cloning procedures were used to subclone the CreGFP or mCherry cassettes into the backbone of a Flippase-dependent AAV-Ef1a-fDIOYFP expression plasmid20 (gift from K. Deisseroth). Following DNA sequencing screening, the AAV plasmid was packaged into AAV serotype 8 virus from UNC Vector Core, with titers of 8.3 × 10¹² virus particles/ml. The EnvA-pseudotyped, protein G-deleted rabies-EnvA-SAD-ΔG-mCherry virus15 was produced by the Viral Vector Core Facility at Salk Institute. CAV2-Cre was prepared using E1-transcomplementing dog kidney (DK) cells and purified by sucrose and CsCl gradient centrifugation, and was re-suspended in 1× Hanks Balanced Saline Solution (HBSS)12. All viral vectors were stored in aliquots at −80°C until use.
Stereotaxic surgery
Viral injections were performed using previously described procedures6 at the following stereotaxic coordinates: pPVT, –1.34 mm from Bregma, 0.05 mm lateral from midline, and 3.03 mm vertical from cortical surface; CeL, −1.22 mm from Bregma, 2.9 mm lateral from midline, and 4.6 mm vertical from cortical surface; BLA, –1.80 mm from Bregma, 3.4 mm lateral from midline, and 5.4 mm vertical from cortical surface. For pPVT injections we used a 6.5° angle to avoid damage of the superior sagittal sinus. Animals were kept on a heating pad throughout the entire surgical procedures and were brought back to their home cages after 24 h post-surgery recovery and monitoring. Postoperative care included intraperitoneal injection with 0.3–0.5 ml of lactated Ringers solution and metacam (meloxicam, 1–2 mg/kg) for analgesia and anti-inflammatory purposes. All AAVs and the CAV2-Cre were injected at a total volume of approximately 1 μl (except for the monosynaptic rabies viral tracing, see below), and were allowed at least two weeks for maximal expression. For retrograde tracing of amygdala-projecting pPVT cells, CTB-555 or CTB-488 (0.1-0.3 μl, 0.5% in PBS) (Invitrogen) was injected into CeL and BLA and allowed 3-5 days for sufficient retrograde transport.
Monosynaptic tracing with pseudotyped rabies virus
Retrograde tracing of monosynaptic inputs onto genetically-defined cell populations of CeL was accomplished using a previously described method15. Briefly, the Som-Cre;Rosa26-stopflox-tTA mice and the Prkcd-Cre;Rosa26-stopflox-tTA mice, which express tTA in SOM+ cells and PKC-δ+ cells, respectively, were injected in CeL with the AAV-TRE-hGFP-TVA-G (0.2–0.3 μl) that expresses the following components in a tTA-dependent manner: a fluorescent reporter histone-GFP (hGFP), TVA (which is a receptor for the avian virus envelope protein EnvA), and the rabies envelope glycoprotein (G). Two weeks later mice were injected in the same location with the rabies-EnvA-SAD-ΔG-mCherry (1.2 μl), a rabies virus that is pseudotyped with EnvA, lacks G, and expresses mCherry. This method ensures that the rabies virus exclusively infects cells expressing TVA. Furthermore, complementation of the modified rabies virus with G in the TVA-expressing cells allows the generation of infectious particles, which then can trans-synaptically infect presynaptic neurons.
Histology
Animals were deeply anesthetized and transcardially perfused with PBS, followed by perfusion with 4% paraformaldehyde (PFA) in PBS. Brains were extracted and postfixed in 4% PFA at 4 °C for two hours for BDNF and TrkB immunohistochemistry and overnight for all other experiments. This was followed by cryoprotection in a 30% PBS-buffered sucrose solution until brains were saturated (~36 h). Coronal brain sections (40 μm) were cut using a freezing microtome (SM 2010R, Leica). Brain sections were first washed in PBS (3 × 5 min) and then incubated in PBST (0.1% Triton X-100 in PBS) for 15 min at room temperature (RT). Next, sections were blocked in 10% normal goat serum (NGS) in PBST for 30 min at RT, followed by incubation with primary antibodies overnight at 4 °C. Sections were then washed with PBST (5 × 15 min) and incubated with fluorescent secondary antibodies at RT for 1 h. After washing with PBS (5 × 15 min), sections were mounted onto glass slides with Fluoromount-G (Beckman Coulter). Images were taken using a LSM 780 laser-scanning confocal microscope (Carl Zeiss).
Antibodies
The primary antibodies used were: anti-c-Fos (1:2000, rabbit, Santa Cruz, catalog number sc-52); anti-BDNF (1:100, rabbit, abcam, catalog number ab108383); and anti-TrkB (1:1000, rabbit, Biosensis, catalog number R-149-100). Fluorophore-conjugated secondary antibodies were purchased from Invitrogen. Antibodies were diluted in PBS with 10% NGS and 0.1% Triton X-100.
Fear conditioning
Mice were initially handled and habituated to the conditioning cage, a Mouse Test Cage (18 cm × 18 cm × 30 cm) with an electrifiable floor connected to a H13-15 shock generator (Coulbourn Instruments, Whitehall, PA). The Test Cage was located inside a sound attenuated cabinet (H10-24A; Coulbourn Instruments). Before each conditioning session the Test Cage was wiped clean with 70% ethanol. During conditioning the cabinet was illuminated and the behavior was captured with a monochrome CCD-camera (Panasonic WV-BP334) at 3.7 Hz and stored on a personal computer. The FreezeFrame software (Coulbourn Instruments) was used to control the delivery of both tones and foot shocks. For habituation, five 4-kHz 75-dB tones (conditioned stimulus; CS), each of which was 30 s in duration, were delivered at variable intervals. During conditioning, mice received five presentations of the CS, each of which co-terminated with a 2-s 1-mA foot shock (unconditioned stimulus; US). In the experiment to determine the effect of BDNF infusion on fear learning (Fig. 4g, h), weaker (2-s 0.5-mA) foot shocks were used. The test for fear memory was performed 24 h following conditioning in a novel illuminated context, where mice were exposed to two presentations of unreinforced CS (120 s inter-CS interval). The novel context was a cage with a different shape (22 cm × 22 cm × 21 cm) and floor texture compared with the conditioning cage. Prior to each use the floor and walls of the cage were wiped clean with 0.5% acetic acid to make the scent distinct from that of the conditioning cage. Behavioral responses to the CS were recorded. Freezing behavior was analyzed with FreezeFrame (Coulbourn Instruments).
Electrophysiology
Mice used for electrophysiological experiments were anaesthetized with isoflurane, decapitated and their brains quickly removed and chilled in ice-cold dissection buffer (110.0 mM choline chloride, 25.0 mM NaHCO3, 1.25 mM NaH2PO4, 2.5 mM KCl, 0.5 mM CaCl2, 7.0 mM MgCl2, 25.0 mM glucose, 11.6 mM ascorbic acid and 3.1mM pyruvic acid, gassed with 95% O2 and 5% CO2). Coronal slices (300 μm) containing the amygdala complex were cut in dissection buffer using a HM650 Vibrating-blade Microtome (Thermo Fisher Scientific), and were subsequently transferred to a storage chamber containing artificial cerebrospinal fluid (ACSF) (118 mM NaCl, 2.5 mM KCl, 26.2 mM NaHCO3, 1 mM NaH2PO4, 20 mM glucose, 2 mM MgCl2 and 2 mM CaCl2, at 34 °C, pH 7.4, gassed with 95% O2 and 5% CO2). After at least 40 min recovery time, slices were transferred to room temperature (20–24 °C) and were constantly perfused with ACSF.
For plasticity experiments, recordings were always performed on interleaved naïve and fear-conditioned animals. Simultaneous whole-cell patch-clamp recordings from SOM+/SOM– neuronal pairs in CeL were obtained with Multiclamp 700B amplifiers (Molecular Devices). Recordings were under visual guidance using an Olympus BX51 microscope with transmitted light illumination, and SOM+ cells were identified based on their fluorescence (hGFP or tdTomato). Synaptic responses were evoked with a bipolar stimulating electrode placed in BLA approximately 0.2 mm away from the recorded cell bodies in CeL. Electrical stimulation was delivered every 10 seconds and synaptic responses were low-pass filtered at 1 KHz and recorded at holding potentials of −70 mV (for AMPA-receptor-mediated responses), +40 -mV (for - NMDA-receptor-mediated responses), or 0 mV (for GABA-A-receptor-mediated responses). NMDA-receptor-mediated responses were quantified as the mean current amplitude between 50 ms and 60 ms after stimulation. Recordings were made in the ACSF. The internal solution for voltage-clamp experiments contained 115 mM cesium methanesulphonate, 20 mM CsCl, 10 mM HEPES, 2.5 mM MgCl2, 4 mM Na2-ATP, 0.4 mM Na3GTP, 10 mM Na-phosphocreatine and 0.6 mM EGTA (pH 7.2). Evoked EPSCs were recorded with picrotoxin (100 μM) added to the ACSF. mEPSCs were recorded in the presence of tetrodotoxin (TTX; 1 μM) and picrotoxin (100 μM) and analyzed using Mini Analysis software (Synaptosoft). To assess presynaptic function, a paired-pulse stimulation protocol (50 ms inter-stimulus interval) was used to evoke double-EPSCs, and paired-pulse ratio (PPR) was quantified as the ratio of the peak amplitude of the second EPSC to that of the first EPSC. While most of the above electrophysiology experiments were carried out by M.A.P., plasticity results were replicated by V.R. who performed these experiments blind.
To evoke pPVT-driven synaptic transmission onto CeL neurons, the AAV-ChR2-YFP was injected into the pPVT of Som-Cre;Ai14 mice and allowed to express for 3 weeks. Acute brain slices were prepared and a blue light was used to stimulate ChR2-expressing axons. The light source was a single-wavelength LED system (λ = 470 nm; CoolLED.com) connected to the epifluorescence port of the Olympus BX51 microscope. Light pulses of 1 ms, triggered by a TTL signal from the Clampex software, were delivered at either 5 Hz or 30 Hz to drive synaptic responses. The BDNF (used at 100 ng/ml) and BDNF scavenger TrkBFc (used at 1 μg/ml) were purchased from R&D Systems.
Chemogenetic manipulations
For chemogenetic manipulation of pPVT, C57BL/6J mice were bilaterally injected with the CAV2-Cre virus into CeL and subsequently with the AAV-DIO-hM4DimCherry into pPVT. Three weeks later mice were injected intraperitoneally (i.p.) with CNO (10 mg/kg) 40 min before either fear conditioning training or fear memory retrieval. For experiments that examine the effects of this manipulation on synaptic plasticity in CeL, Som-Cre and Som-Cre;H2b-GFP mice were injected with a 40% : 60% mixture of AAV-Cre-GFP and AAV-DIO-hM4DimCherry into pPVT (1 μl total volume). Som-Cre mice were additionally injected bilaterally in CeL with 1 μl of AAV-DIO-YFP.
Cannula implantation and BDNF infusion
Surgery
Surgical procedure was the same as described above. Stainless steel guide cannulae (26 gauge, 6.00 mm, Plastics One) were implanted bilaterally 0.5 mm above the CeL (–1.22 mm from Bregma, 2.90 mm lateral from midline, and 4.25 mm vertical from cortical surface) and were fixed to the skull with adhesive luting cement (C&B Metabond) and acrylic dental cement (Stoelting). A metal head bar was implanted posterior to the cannulae to facilitate restraining during infusion (see below). Following surgery, a dummy cannula was inserted into each guide cannula to seal off the opening. Mice were allowed to recover from surgery for a minimum of one week, during which they were handled and habituated to the infusion procedure on a daily basis.
Infusion
Mice were briefly head-restrained, while the dummy cannulae were removed and an injection cannula (33 gauge, 6.50 mm, Plastics One) was inserted into each of the guide cannulae. The injection cannulae were designed to protrude 0.50 mm from the tip of the guide cannulae and thus penetrate into the CeL. A dose of 200 ng BDNF (or 0.9% sodium chloride as control) was slowly infused bilaterally into CeL at a flow-rate of 0.5 μl/min and in a total volume of 1 μl per infusion site. Following infusion, the injection cannulae were left in place for 1 min to allow the BDNF solution to diffuse from the cannula tips. The dummy cannulae were subsequently reinserted into the guide cannulae and mice were immediately tested for unconditioned freezing or returned to their homecage for 15 min prior to fear conditioning.
Statistics and data presentation
All statistical tests are indicated when used. The sample sizes used in this study were based on estimations by a power analysis (power = 0.9, α = 0.05). No mice or data points were excluded from analysis. All data are presented as mean ± s.e.m.
Extended Data
Extended Data Figure 1. PVT is activated following both fear conditioning and fear memory retrieval.
a. A schematic of the experimental design. All mice were sacrificed for the detection of c-Fos at 90 min after the last behavioral session. b. Representative images of c-Fos immunohistochemistry in pPVT for the five groups indicated in a. c. Quantification of c-Fos expression (post-habituation 1 (mice that were subjected to one session of habituation), 131.17 ± 34.25, n = 4 mice; post-habituation 2 (mice that were subjected to two sessions of habituation), 180.68 ± 30.42, n = 5 mice; post-US (mice that were only exposed to five foot shocks), 443.3 ± 25.7, n = 3 mice; post-conditioning, 692.61 ± 46.68, n = 4 mice; post-retrieval, 565.51 ± 28.71, n = 3 mice; F(4,14) = 49.3, P < 0.001; **P < 0.01, ***P < 0.001; one-way analysis of variance (ANOVA) followed by Tukey's test). Data are presented as mean ± s.e.m.
Extended Data Figure 2. pPVT neurons projecting to BLA and CeL are non-overlapping.
a. A schematic of the approach to simultaneously label BLA- and CeL-projecting pPVT neurons. b. A representative image of the injection sites, where CTB-488 and CTB-555 were injected into CeL and BLA, respectively. c. Representative images of pPVT cells labeled by CTB-488 (left) and CTB-555 (middle). These two populations were largely non-overlapping (right). Data was replicated in 4 mice.
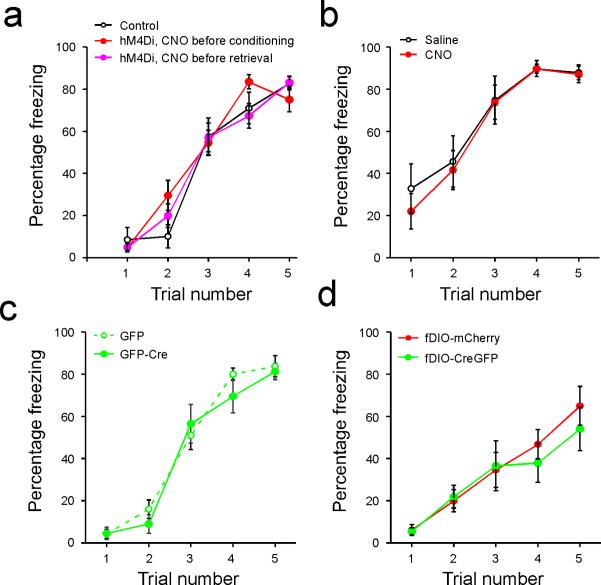
Extended Data Figure 3. Performance during conditioning.
Freezing levels during conditioning are shown for mice used in Figure 1c (a), Figure 2 (b), Figure 4c (c), and Figure 4e (d). a. There was no significant difference in performance among groups (F(2,155) = 0.51, P > 0.05, two-way ANOVA). b. There was no significant difference in performance between saline-treated mice and CNO-treated mice (F(1,70) = 0.43, P > 0.05, two-way ANOVA). c. There was no significant difference in performance between the two groups (F(1,85) = 0.73, P > 0.05, two-way ANOVA). d. There was no significant difference in performance between the two groups (F(1,75) = 0.45, P > 0.05, two-way ANOVA). Data are presented as mean ± s.e.m.
Extended Data Figure 4. pPVT is required for fear conditioning-induced synaptic plasticity in the LA-CeLSOM pathway.

a. Top: a schematic of the whole-cell paired-recording configuration. A pair of SOM+ and SOM– CeL neurons was simultaneously recorded, and EPSCs were evoked by stimulation of the LA. We used the Som-Cre;H2b-GFP mice, in which the SOM+ neurons were tagged with H2b-GFP and the pPVT neurons were infected with hM4Di as in Figure 2a & b. Bottom: a representative image of a slice used for recording, in which a SOM+ (arrow) and an adjacent SOM– (arrowhead) neuron were recorded. b. Sample EPSC traces obtained from the simultaneous paired-recording experiment. Naïve control mice (left) and fear conditioned mice treated with either saline (middle) or CNO (right) were used. Saline or CNO were administered 40 min prior to, and recording were performed 24 hours following conditioning. Upper and lower traces represent EPSCs recorded at +40 mV and –70 mV holding potentials, respectively. c. Quantification of AMPA (left) and NMDA (right) currents (Control, n = 9 pairs (2 mice); “Fear, saline”, n = 8 pairs (3 mice); “Fear, CNO”, n = 14 pairs (3 mice); *P < 0.05, **P < 0.001, n.s., non-significant, paired t test). EPSC values are normalized to the average EPSC value of SOM– cells for each group. d. Quantification of paired-pulse ratio (PPR) (see Methods) of EPSCs measured at –70 mV (comparing “control”, “Fear, saline”, and “Fear, CNO” groups for SOM+ neurons: *P < 0.05, **P < 0.01, n.s., non-significant; one-way ANOVA followed by Tukey's test). Control mice for all experiments were injected with the same viral vectors as the experimental groups. Data are presented as mean ± s.e.m.
Extended Data Figure 5. A different mode of communication at the pPVT– CeL pathway compared with the pPVT–BLA pathway.
(a–c) Optogenetic stimulation of pPVT afferents in BLA drives fast synaptic transmission onto BLA neurons. a & b. Schematics of the experimental approach. c. Sample trace (average of 20) of the synaptic responses onto a BLA neuron following brief (5-Hz 1-ms pulses) photo-stimulation of pPVT afferents expressing ChR2. Similar responses were observed in 5 out of 6 BLA neurons recorded. Data was obtained from the same mice as those in Fig. 3d–g. (d–f) Slow recovery of the pPVT-driven current in a SOM+ CeL neuron. d & e. Schematics of the experimental approach. f. Sample trace of the synaptic response onto a SOM+ neuron following prolonged (30-Hz 1-ms pulses for 20 s) photo-stimulation of pPVT afferents expressing ChR2, showing slow recovery after stimulus offset. (g–i) Optogenetic stimulation of the pPVT–CeL pathway promotes intra-CeL inhibition. g. Representative traces of IPSCs onto SOM– (black) and SOM+ (red) CeL neurons. Blue bar indicates the 30-Hz photo-stimulation of pPVT afferents. h. Quantification of IPSC frequency, comparing pre- and post-photostimulation (SOM–, n = 14 neurons (6 mice), P < 0.001, t test; SOM+, n = 11 neurons (6 mice), P > 0.05, t test). i. Quantification of IPSC amplitude, comparing pre- and post-photostimulation (n.s., non-significant (P > 0.05), paired t test). Data are presented as mean ± s.e.m.
Extended Data Figure 6. CeL-projecting neurons in pPVT express BDNF.
a. A schematic of the experimental approach to retrogradely label CeL-projecting pPVT cells. b. Representative images of pPVT cells, which were labeled by CTB (left) and an antibody recognizing BDNF (middle). CTB-labeled neurons largely overlapped with BDNF-positive somatas (see overlay in right). (c, d) BLA-projecting neurons and BDNF-expressing neurons in pPVT are largely non-overlapping. c. A schematic of the method used to label BLA-projecting neurons in pPVT. d. Representative images of pPVT cells labeled by either CTB-555 (left) or the antibody recognizing BDNF (middle). These two populations were largely non-overlapping (see overlay in right).
Extended Data Figure 7. BDNF/TrkB mediates pPVT–CeL communication.
a. The TrkB receptor is selectively expressed by SOM+ CeL neurons. Top,representative images of CeL in Som-Cre;H2b-GFP mice, showing SOM+ neurons tagged with H2b-GFP (left) and TrkB expression recognized by an antibody (middle). Bottom, higher-magnification images of the boxed area in the top panel. TrkB labeled cells largely overlap with SOM+ neurons (see overlay on right). (b–f) TrkB mediates the pPVT–CeL transmission. b. A schematic of the experimental approach using the Trkblox/lox;Som-Flp mice to: 1) tag SOM+ CeL neurons with mCherry; 2) sparsely infect CeL neurons with GFP-Cre to delete Trkb; and 3) express ChR2 in pPVT. c. Representative images resulting from the approach in b, showing CeL neurons expressing (from left to right) Cre-GFP, mCherry, and TrkB. Neurons that expressed both mCherry and GFP-Cre represent SOM+ neurons in which Trkb was deleted (arrow; see overlay in right), whereas neurons that expressed mCherry, but not GFP-Cre, represent SOM+ neurons with intact Trkb (arrowhead; see overlay in right). d. A schematic of the whole-cell recording configuration. e. Sample traces of synaptic currents in mCherry-only (SOM+,Cre–; red) and mCherry/GFP-Cre double positive (SOM+,Cre+; yellow) neurons in response to prolonged high frequency stimulation of pPVT afferents. f. Quantification of the synaptic responses (SOM+,Cre–, 8.06 ± 2.58 pA, n = 7 neurons (3 mice); SOM+,Cre+, 2.10 ± 0.76 pA, n = 7 neurons (3 mice); *P < 0.05, t test). (g–j) The pPVT input to CeL promotes intra-CeL inhibition through BDNF/TrkB signaling. g. Representative traces of IPSCs recorded from SOM– CeL neurons in response to the 30-Hz photo-stimulation (Blue bars) of pPVT afferents, in control condition (top panel) or in the presence of the BDNF scavenger TrkB-Fc (bottom panel). h. Quantification of the frequency of IPSCs recorded from SOM– CeL neurons (comparing pre- and post-photostimulation: control, n = 14 neurons (6 mice; repetition of data from the SOM– cells in Extended Data Fig. 5h), P < 0.001, paired t test; TrkB-Fc, n = 17 neurons (2 mice), P > 0.05, paired t test). i. Representative traces showing the effect of BDNF bath application on spontaneous IPSCs recorded from CeL neurons. j. Quantification of the effect of BDNF on spontaneous IPSC frequency. Black line indicates the timing of BDNF application (n = 7; P < 0.05 comparing baseline and BDNF application, paired t test). Data are presented as mean ± s.e.m.
Extended Data Figure 8. Characterization of the AAV-fDIO-CreGFP.
a. A schematic of the experimental approach to selectively target SOM+ CeL neurons in the Som-Flp mice with the AAV-fDIO-CreGFP. b. Representative images of CeL neurons expressing CreGFP (left), and PKC-δ+ CeL neurons (as surrogate for SOM– neurons) that were recognized by an antibody (middle). In lower panel are high magnification images of the boxed region in the upper panel. These two cell populations were largely non-overlapping (see overlay on right), indicating that the AAV-fDIO-CreGFP selectively infects SOM+ neurons (data from one mouse). c. A schematic of the experimental approach to test the function of AAV-fDIO-CreGFP, whereby the CeL of Som-Flp mice was injected with a mixture of AAV-fDIO-CreGFP and AAV-DIO-hM4Di-mCherry. As the latter virus expresses mCherry in a Cre-dependent manner, observation of selective mCherry expression in GFP+ neurons would indicate that the AAV-fDIO-CreGFP is effective. d. Sample images of CeL neurons expressing CreGFP (left) and mCherry (middle). In lower panel are high magnification images of the boxed region in the upper panel. Essentially, all mCherry+ neurons co-expressed GFP (see overlay on right), indicating selective expression of Cre by the GFP-labeled cells (data from one mouse).
Extended Data Figure 9. BDNF/TrkB regulates synaptic plasticity onto SOM+ CeL neurons.
(a–d) Selective deletion of Trkb in SOM+ CeL neurons impairs fear conditioning-induced synaptic plasticity. a. A schematic of the experimental approach to specifically delete Trkb in SOM+ CeL neurons. b. Representative traces of mEPSCs recorded from SOM+ CeL neurons in which Trkb was deleted, in naïve control (top) and fear-conditioned (bottom) mice. c & d. Deletion of Trkb blocked the fear conditioning-induced increase in mEPSC frequency (Control, n = 19 neurons (3 mice); Fear n = 18 neurons (3 mice); P > 0.05, t test) (c), but not amplitude (Control, n = 19 neurons (3 mice); Fear n = 18 neurons (3 mice); *P < 0.05, t test) (d). (e–g) BDNF induces LTP at the LA– CeLSOM synapses. e. A schematic of the whole-cell recording configuration. f. Top: sample EPSC traces recorded before (pre-BDNF) and after (post-BDNF) bath application of BDNF. Bottom: summary plot showing the effect of BDNF on EPSC peak amplitude, for which the first peak in the paired-pulse was measured and normalized to the baseline (that is, the average pre-BDNF amplitude). BDNF significantly enhanced EPSC amplitude (pre-BDNF, 98 ± 1.74%, post-BDNF, 146 ± 17.6%, n = 6 neurons (3 mice), P < 0.05, paired t test). g. BDNF application decreased paired-pulse ratio (PPR) (see Methods) of the EPSCs (pre-BDNF, 1.17 ± 0.18; post-BDNF, 0.80 ± 0.09; n = 6 neurons (3 mice), *P < 0.05, paired t test). Data are presented as mean ± s.e.m.
Extended Data Figure 10. Exogenous application of BDNF in CeL increases the excitability of SOM+ neurons and elicits unconditioned freezing response.
(a–d) BDNF increases the excitability of SOM+ CeL neurons. a. A schematic of the experimental approach, in which photostimulation was used to assess the excitability of SOM+ CeL neurons expressing ChR2. b. Sample traces of photostimulation-evoked spikes recorded in cell-attached mode, before (baseline; left) and after (right) bath application of BDNF (100 ng/ml). Light intensity was adjusted to evoke spikes with ~50% probability at baseline. c. A sample recording, in which the spike probability of a SOM+ CeL neuron was followed before, during, and after BDNF application. d. Quantification of the effect of BDNF on spike probability (baseline, 0.50 ± 0.02; BDNF, 0.74 ± 0.08; n = 8 neurons (4 mice), *P < 0.05, paired t test). (e, f) Infusion of BDNF into CeL elicits unconditioned freezing response. e. Drawing of the cannula sites. Each dot denotes where the tip of the injection cannula was located in each mouse. f. Quantification of freezing levels following CeL infusion of saline and BDNF (saline, 2.93 ± 1.84 %; BDNF, 32.22 ± 9.19 %; n = 6 mice, *P<0.05, paired t test). Data are presented as mean ± s.e.m.
Supplementary Material
Acknowledgements
We thank Dr. Eric Nestler for providing us with the Trkblox/lox mice generated by L.F.P., Dr. Karl Deisseroth for the AAV-Ef1a-fDIO backbone, Dr. Emmanuel Valjent for supporting D.D.B.'s work, and members of the Li laboratory for discussions. This work was supported by grants from NIH (B.L., L.V.A., and Z.J.H.), the Dana Foundation (B.L.), NARSAD (B.L. and Z.J.H.), Louis Feil Trust (B.L.), the Stanley Family Foundation (B.L. and Z.J.H.), and a Harvey L. Karp Discovery Award (M.A.P.).
Footnotes
Author Contributions
M.A.P. and B.L. designed the study. M.A.P. and V.R. conducted experiments. M.A.P. analyzed data. J.T. assisted the rabies viral tracing experiments. D.D.B. assisted the BDNF infusion experiments. M.W. made the AAV-fDIO-CreGFP virus. M.D. made the CAV2-Cre virus. L.F.P. generated the Trkblox/lox mouse line. M. H. generated the Som-Flp mouse line. L.V.A., R.P., and Z.J.H. provided critical reagents and suggestions. M.A.P. and B.L. wrote the paper.
The authors declare no competing financial interests.
References
- 1.Spencer SJ, Fox JC, Day TA. Thalamic paraventricular nucleus lesions facilitate central amygdala neuronal responses to acute psychological stress. Brain Res. 2004;997:234–237. doi: 10.1016/j.brainres.2003.10.054. [DOI] [PubMed] [Google Scholar]
- 2.Chastrette N, Pfaff DW, Gibbs RB. Effects of daytime and nighttime stress on Fos-like immunoreactivity in the paraventricular nucleus of the hypothalamus, the habenula, and the posterior paraventricular nucleus of the thalamus. Brain Res. 1991;563:339–344. doi: 10.1016/0006-8993(91)91559-j. [DOI] [PubMed] [Google Scholar]
- 3.Cullinan WE, Herman JP, Battaglia DF, Akil H, Watson SJ. Pattern and time course of immediate early gene expression in rat brain following acute stress. Neuroscience. 1995;64:477–505. doi: 10.1016/0306-4522(94)00355-9. [DOI] [PubMed] [Google Scholar]
- 4.Wilensky AE, Schafe GE, Kristensen MP, LeDoux JE. Rethinking the fear circuit: the central nucleus of the amygdala is required for the acquisition, consolidation, and expression of Pavlovian fear conditioning. J. Neurosci. 2006;26:12387–12396. doi: 10.1523/JNEUROSCI.4316-06.2006. [DOI] [PMC free article] [PubMed] [Google Scholar]
- 5.Ciocchi S, et al. Encoding of conditioned fear in central amygdala inhibitory circuits. Nature. 2010;468:277–282. doi: 10.1038/nature09559. [DOI] [PubMed] [Google Scholar]
- 6.Li H, et al. Experience-dependent modification of a central amygdala fear circuit. Nat. Neurosci. 2013;16:332–339. doi: 10.1038/nn.3322. [DOI] [PMC free article] [PubMed] [Google Scholar]
- 7.Krout KE, Loewy AD. Parabrachial nucleus projections to midline and intralaminar thalamic nuclei of the rat. J. Comp. Neurol. 2000;428:475–494. doi: 10.1002/1096-9861(20001218)428:3<475::aid-cne6>3.0.co;2-9. [DOI] [PubMed] [Google Scholar]
- 8.Bhatnagar S, et al. A cholecystokinin-mediated pathway to the paraventricular thalamus is recruited in chronically stressed rats and regulates hypothalamic-pituitary-adrenal function. J. Neurosci. 2000;20:5564–5573. doi: 10.1523/JNEUROSCI.20-14-05564.2000. [DOI] [PMC free article] [PubMed] [Google Scholar]
- 9.Li S, Kirouac GJ. Projections from the paraventricular nucleus of the thalamus to the forebrain, with special emphasis on the extended amygdala. J. Comp. Neurol. 2008;506:263–287. doi: 10.1002/cne.21502. [DOI] [PubMed] [Google Scholar]
- 10.Vertes RP, Hoover WB. Projections of the paraventricular and paratenial nuclei of the dorsal midline thalamus in the rat. J. Comp. Neurol. 2008;508:212–237. doi: 10.1002/cne.21679. [DOI] [PubMed] [Google Scholar]
- 11.Armbruster BN, Li X, Pausch MH, Herlitze S, Roth BL. Evolving the lock to fit the key to create a family of G protein-coupled receptors potently activated by an inert ligand. Proc. Natl. Acad. Sci. U.S.A. 2007;104:5163–5168. doi: 10.1073/pnas.0700293104. [DOI] [PMC free article] [PubMed] [Google Scholar]
- 12.Darvas M, Palmiter RD. Restriction of dopamine signaling to the dorsolateral striatum is sufficient for many cognitive behaviors. Proc. Natl. Acad. Sci. U.S.A. 2009;106:14664–14669. doi: 10.1073/pnas.0907299106. [DOI] [PMC free article] [PubMed] [Google Scholar]
- 13.He M, et al. Cell-type-based analysis of microRNA profiles in the mouse brain. Neuron. 2012;73:35–48. doi: 10.1016/j.neuron.2011.11.010. [DOI] [PMC free article] [PubMed] [Google Scholar]
- 14.Haubensak W, et al. Genetic dissection of an amygdala microcircuit that gates conditioned fear. Nature. 2010;468:270–276. doi: 10.1038/nature09553. [DOI] [PMC free article] [PubMed] [Google Scholar]
- 15.Miyamichi K, et al. Cortical representations of olfactory input by trans-synaptic tracing. Nature. 2011;472:191–196. doi: 10.1038/nature09714. [DOI] [PMC free article] [PubMed] [Google Scholar]
- 16.Mattis J, et al. Principles for applying optogenetic tools derived from direct comparative analysis of microbial opsins. Nat. Methods. 2012;9:159–172. doi: 10.1038/nmeth.1808. [DOI] [PMC free article] [PubMed] [Google Scholar]
- 17.Park H, Poo M-M. Neurotrophin regulation of neural circuit development and function. Nat. Rev. Neurosci. 2013;14:7–23. doi: 10.1038/nrn3379. [DOI] [PubMed] [Google Scholar]
- 18.Conner JM, Lauterborn JC, Yan Q, Gall CM, Varon S. Distribution of brain-derived neurotrophic factor (BDNF) protein and mRNA in the normal adult rat CNS: evidence for anterograde axonal transport. J. Neurosci. 1997;17:2295–2313. doi: 10.1523/JNEUROSCI.17-07-02295.1997. [DOI] [PMC free article] [PubMed] [Google Scholar]
- 19.He X-P, et al. Conditional deletion of TrkB but not BDNF prevents epileptogenesis in the kindling model. Neuron. 2004;43:31–42. doi: 10.1016/j.neuron.2004.06.019. [DOI] [PubMed] [Google Scholar]
- 20.Fenno LE, et al. Targeting cells with single vectors using multiple-feature Boolean logic. Nat. Methods. 2014;11:763–772. doi: 10.1038/nmeth.2996. [DOI] [PMC free article] [PubMed] [Google Scholar]
- 21.Rios M, et al. Conditional deletion of brain-derived neurotrophic factor in the postnatal brain leads to obesity and hyperactivity. Mol. Endocrinol. 2001;15:1748–1757. doi: 10.1210/mend.15.10.0706. [DOI] [PubMed] [Google Scholar]
- 22.Johnson PL, Molosh A, Fitz SD, Truitt WA, Shekhar A. Orexin, stress, and anxiety/panic states. Prog. Brain Res. 2012;198:133–161. doi: 10.1016/B978-0-444-59489-1.00009-4. [DOI] [PMC free article] [PubMed] [Google Scholar]
- 23.Li Y, et al. Changes in emotional behavior produced by orexin microinjections in the paraventricular nucleus of the thalamus. Pharmacol. Biochem. Behav. 2010;95:121–128. doi: 10.1016/j.pbb.2009.12.016. [DOI] [PubMed] [Google Scholar]
- 24.Zhang L, et al. PTSD risk is associated with BDNF Val66Met and BDNF overexpression. Mol. Psychiatry. 2014;19:8–10. doi: 10.1038/mp.2012.180. [DOI] [PubMed] [Google Scholar]
- 25.Mahan AL, Ressler KJ. Fear conditioning, synaptic plasticity and the amygdala: implications for posttraumatic stress disorder. Trends Neurosci. 2012;35:24–35. doi: 10.1016/j.tins.2011.06.007. [DOI] [PMC free article] [PubMed] [Google Scholar]
- 26.Li L, et al. Visualizing the distribution of synapses from individual neurons in the mouse brain. PLoS ONE. 2010;5:e11503. doi: 10.1371/journal.pone.0011503. [DOI] [PMC free article] [PubMed] [Google Scholar]
Associated Data
This section collects any data citations, data availability statements, or supplementary materials included in this article.


